Volume Profile Heatmap [TradingFinder] POC VAH & VAL Vol Trading
More exclusive indicators from TradingFinder
Subscribe to TFlab [TradingFinder] Pro Trading Toolkits for $48.88/month to get exclusive indicators by this author. You pay right on TradingView and can use them on your charts straight away.
Explore TFlab [TradingFinder] Pro Trading Toolkits🔵Introduction
Price movements show how the market changes over time, but they do not reveal how trading activity is distributed across different price levels. Two price regions may experience similar movements while attracting completely different levels of participation. One may contain substantial trading volume, suggesting that the market has spent considerable activity accepting those prices, while another may show limited participation and rapid price movement. Understanding these differences is an important part of Volume Profile analysis, where trading volume is examined by price rather than simply by time.

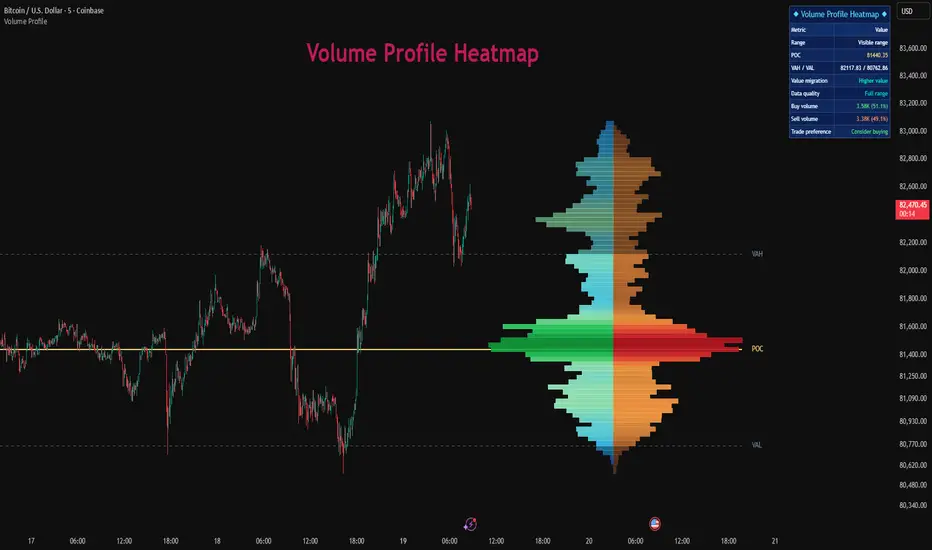
A traditional Volume Profile displays a horizontal volume histogram that identifies areas of high and low trading activity. High-volume regions can indicate established areas of market acceptance, while low-volume regions may reflect prices where trading activity was relatively limited. A Volume Profile Heatmap extends this analysis by combining volume distribution with color intensity, making differences in volume concentration easier to recognize. Instead of relying exclusively on histogram length, traders can examine the changing heatmap spectrum across price levels to distinguish major volume clusters from less active regions.
An additional dimension comes from separating estimated buying and selling volume. By examining lower-timeframe candle activity and distributing its volume across price levels, a Buy and Sell Volume Profile provides a directional view of market participation. Positive and negative heatmap color spectrums distinguish estimated bullish and bearish contributions, while the width of each histogram segment represents its relative volume. This approach helps traders study the relationship between directional activity, volume concentration, and price structure. The directional volume is an estimate derived from candle data, not a direct measurement of exchange Bid/Ask transactions or aggressive market orders.
The foundation of this analysis remains the Point of Control (POC), Value Area High (VAH), and Value Area Low (VAL). The POC identifies the price row with the highest volume concentration within the selected range. VAH and VAL define the upper and lower boundaries of the Value Area, which typically contains 70% of the accumulated volume. Together, these levels provide a framework for evaluating market acceptance, price positioning, consolidation, and potential transitions between balanced and directional conditions. Combining POC, VAH, VAL, Volume Heatmap, and estimated Buy/Sell Volume allows traders to interpret volume distribution with greater visual detail while preserving the essential structure of conventional Volume Profile trading.
🔵How to Use
The first step in using a Volume Profile Heatmap is selecting the price range to analyze. The indicator supports the visible chart range, a fixed number of recent candles, an anchored time interval, and the current daily or weekly session. Each selection provides a different analytical perspective. The visible range is useful for examining the market structure currently displayed on the chart, while a fixed lookback can maintain a more consistent observation window. Anchored analysis allows traders to study a specific market event or trading period, and session-based analysis helps identify the areas where trading activity has accumulated during the current session. Changing the selected range recalculates the volume distribution, including the POC, VAH, VAL, and directional heatmap.
Once the Volume Profile is displayed, traders can begin with the histogram's shape and the relationship between price and the Value Area. Wide sections indicate relatively high volume concentration, while narrow sections identify prices with lower accumulated volume. The positive heatmap spectrum represents estimated buying activity, and the negative heatmap spectrum represents estimated selling activity. Variations in color show differences in volume intensity within each directional component. The stacked layout combines the two directional segments within the same horizontal profile, while the opposing layout displays them on opposite sides of a shared reference axis. These views make it easier to compare the relative distribution of buying and selling activity across individual price levels.
🟣Understanding POC, VAH, and VAL
Point of Control (POC): The POC marks the price row with the greatest accumulated volume in the selected profile. It represents the most active price region and can serve as a reference for evaluating market acceptance. Price returning to the POC may indicate renewed activity around an established value level, although the POC does not guarantee support or resistance.
Value Area High (VAH): VAH represents the upper boundary of the calculated Value Area. It helps traders identify where price is approaching or moving beyond the upper portion of the established volume distribution. Reactions around VAH can provide useful information about whether higher prices are being accepted or rejected.
Value Area Low (VAL): VAL marks the lower boundary of the Value Area. It is useful for evaluating market behavior near the lower edge of an established trading distribution. Price holding below VAL may indicate movement away from the previous value region, while a return above it may suggest renewed participation within that region.
The relationship between these three levels is particularly important. When price remains between VAH and VAL, the market is trading within the established Value Area. Sustained movement beyond either boundary may suggest that participants are exploring a different price region. However, a temporary breakout alone is not sufficient evidence of directional continuation. Volume concentration, directional activity, candle behavior, and the broader market structure should all be considered.
🟣Bullish Volume Profile Analysis
A bullish scenario may develop when price begins trading near VAL or within the lower portion of the Value Area and subsequently moves toward the POC. If the Volume Profile Heatmap shows increasing estimated buying activity around the relevant price levels, the movement may indicate improving bullish participation.
A stronger bullish context can develop when price moves above the POC and approaches VAH. Traders can evaluate whether the market continues building activity at higher prices or rejects the upper Value Area boundary. A sustained move above VAH, supported by constructive price action and participation, may suggest that the market is beginning to establish value at higher levels.

For example, after an extended consolidation, price may break above VAH, briefly return to test the boundary, and then continue higher. The Volume Profile provides the location of the previous value boundary, while the heatmap adds information about estimated directional activity around that region. Traders can use this combination to evaluate potential continuation or retest setups.

Importantly, the presence of positive volume does not automatically confirm a bullish reversal or breakout. Strong volume can occur during both successful continuation and failed breakout attempts. Price confirmation and risk management remain necessary.
🟣Bearish Volume Profile Analysis
A bearish scenario may emerge when price struggles to remain above VAH and begins moving back toward the POC. If the heatmap displays concentrated estimated selling activity around the rejection area, traders may interpret the movement as a sign of increasing bearish participation.
A move below the POC can shift attention toward VAL, particularly when price continues trading within the lower portion of the Value Area. If price subsequently breaks below VAL and fails to recover that boundary, the previous volume distribution may become an important reference for evaluating bearish continuation.

For example, price may decline below VAL, recover temporarily toward the broken boundary, and then experience renewed selling pressure. The trader can compare the retest with the negative heatmap spectrum and the surrounding volume distribution to determine whether the market is showing signs of rejection at the previous value boundary.

However, estimated selling volume does not necessarily imply that price must continue lower. A high-volume decline may also occur during a temporary liquidation or a broader accumulation process. Volume Profile analysis is most useful when combined with market structure, support and resistance, and confirmation from subsequent price movements.
🟣Identifying Volume Concentration and Market Balance
Beyond directional setups, the Volume Profile Heatmap is useful for studying market balance. A broad volume concentration around the POC may reflect a region where substantial trading activity has accumulated. When price repeatedly moves around this area without establishing a sustained directional move, the market may be operating within a relatively balanced environment.
Conversely, narrow sections of the Volume Profile identify price levels where less activity has accumulated. These low-volume regions may become important when price moves between larger volume concentrations. Traders can observe whether price moves quickly through these areas or begins developing new volume distribution within them.
The information panel provides additional context by displaying the selected range, POC, VAH, VAL, value migration, and data quality. Value migration compares the POC positions of the current and previous sessions when sufficient data is available. A higher value classification reflects an upward shift, while a lower value classification indicates a downward shift. Stable value suggests that the shift remains within the indicator's classification threshold. These observations can help traders distinguish changes in the location of trading activity from short-term price fluctuations.
The data quality information is also important. When the selected range extends beyond the retained historical data, the indicator may identify the profile as incomplete. With complete-range validation enabled, an incomplete profile is withheld rather than presented as a fully calculated distribution.
🔵Settings
Profile Range: Select the analysis period: Visible Range, Last N Bars, Anchored Time, or Current Session.
Price Rows: Set the number of price levels used to build the Volume Profile. More rows provide finer price detail.
Value Area %: Define the percentage of total volume included between VAH and VAL. The default is 70%.
Lookback Bars: Choose how many recent candles are analyzed when using Last N Bars.
Start Time: Set the beginning of the selected period when using Anchored Time.
End Time: Set the end of the selected period when using Anchored Time.
Session Length: Choose daily or weekly session analysis.
Volume Data: Select lower-timeframe volume estimation or chart-timeframe OHLCV data.
Lower Timeframe: Choose the lower timeframe used for volume sampling, or allow automatic selection.
History Bars: Set the maximum number of chart candles retained for volume calculations.
Require Complete Range: Display only profiles with a verified complete range when enabled.
Buy & Sell Layout: Choose Stacked or Opposing to control how estimated buying and selling volume appears in the histogram.
Panel Position: Select the top-right, bottom-right, or top-left position for the information panel.
Dynamic POC Alert (Beta): Enable an experimental alert when price crosses the current dynamic POC on a confirmed candle.
🔵Conclusion
Understanding where trading activity is concentrated provides valuable context that cannot always be obtained from price movements alone. Volume Profile analysis helps traders distinguish established value regions from areas with relatively limited participation, while POC, VAH, and VAL create a structured framework for interpreting the relationship between price and accumulated volume.
By combining horizontal Volume Profile distribution with positive and negative Volume Heatmap spectrums, estimated Buy/Sell Volume, and Value Area analysis, traders can examine both the location and directional characteristics of market activity. This combination can be useful for identifying potential support and resistance areas, evaluating breakouts, observing market balance, and studying the movement of value between trading sessions.
The indicator is designed to support analytical decision-making rather than generate standalone trade entries. Directional volume remains an estimate based on candle information, and no individual volume level guarantees a particular market reaction. When used alongside price action, market structure, and appropriate risk management, the Volume Profile Heatmap provides a practical framework for evaluating price acceptance, volume concentration, and changing market conditions.
Price movements show how the market changes over time, but they do not reveal how trading activity is distributed across different price levels. Two price regions may experience similar movements while attracting completely different levels of participation. One may contain substantial trading volume, suggesting that the market has spent considerable activity accepting those prices, while another may show limited participation and rapid price movement. Understanding these differences is an important part of Volume Profile analysis, where trading volume is examined by price rather than simply by time.
A traditional Volume Profile displays a horizontal volume histogram that identifies areas of high and low trading activity. High-volume regions can indicate established areas of market acceptance, while low-volume regions may reflect prices where trading activity was relatively limited. A Volume Profile Heatmap extends this analysis by combining volume distribution with color intensity, making differences in volume concentration easier to recognize. Instead of relying exclusively on histogram length, traders can examine the changing heatmap spectrum across price levels to distinguish major volume clusters from less active regions.
An additional dimension comes from separating estimated buying and selling volume. By examining lower-timeframe candle activity and distributing its volume across price levels, a Buy and Sell Volume Profile provides a directional view of market participation. Positive and negative heatmap color spectrums distinguish estimated bullish and bearish contributions, while the width of each histogram segment represents its relative volume. This approach helps traders study the relationship between directional activity, volume concentration, and price structure. The directional volume is an estimate derived from candle data, not a direct measurement of exchange Bid/Ask transactions or aggressive market orders.
The foundation of this analysis remains the Point of Control (POC), Value Area High (VAH), and Value Area Low (VAL). The POC identifies the price row with the highest volume concentration within the selected range. VAH and VAL define the upper and lower boundaries of the Value Area, which typically contains 70% of the accumulated volume. Together, these levels provide a framework for evaluating market acceptance, price positioning, consolidation, and potential transitions between balanced and directional conditions. Combining POC, VAH, VAL, Volume Heatmap, and estimated Buy/Sell Volume allows traders to interpret volume distribution with greater visual detail while preserving the essential structure of conventional Volume Profile trading.
🔵How to Use
The first step in using a Volume Profile Heatmap is selecting the price range to analyze. The indicator supports the visible chart range, a fixed number of recent candles, an anchored time interval, and the current daily or weekly session. Each selection provides a different analytical perspective. The visible range is useful for examining the market structure currently displayed on the chart, while a fixed lookback can maintain a more consistent observation window. Anchored analysis allows traders to study a specific market event or trading period, and session-based analysis helps identify the areas where trading activity has accumulated during the current session. Changing the selected range recalculates the volume distribution, including the POC, VAH, VAL, and directional heatmap.
Once the Volume Profile is displayed, traders can begin with the histogram's shape and the relationship between price and the Value Area. Wide sections indicate relatively high volume concentration, while narrow sections identify prices with lower accumulated volume. The positive heatmap spectrum represents estimated buying activity, and the negative heatmap spectrum represents estimated selling activity. Variations in color show differences in volume intensity within each directional component. The stacked layout combines the two directional segments within the same horizontal profile, while the opposing layout displays them on opposite sides of a shared reference axis. These views make it easier to compare the relative distribution of buying and selling activity across individual price levels.
🟣Understanding POC, VAH, and VAL
Point of Control (POC): The POC marks the price row with the greatest accumulated volume in the selected profile. It represents the most active price region and can serve as a reference for evaluating market acceptance. Price returning to the POC may indicate renewed activity around an established value level, although the POC does not guarantee support or resistance.
Value Area High (VAH): VAH represents the upper boundary of the calculated Value Area. It helps traders identify where price is approaching or moving beyond the upper portion of the established volume distribution. Reactions around VAH can provide useful information about whether higher prices are being accepted or rejected.
Value Area Low (VAL): VAL marks the lower boundary of the Value Area. It is useful for evaluating market behavior near the lower edge of an established trading distribution. Price holding below VAL may indicate movement away from the previous value region, while a return above it may suggest renewed participation within that region.
The relationship between these three levels is particularly important. When price remains between VAH and VAL, the market is trading within the established Value Area. Sustained movement beyond either boundary may suggest that participants are exploring a different price region. However, a temporary breakout alone is not sufficient evidence of directional continuation. Volume concentration, directional activity, candle behavior, and the broader market structure should all be considered.
🟣Bullish Volume Profile Analysis
A bullish scenario may develop when price begins trading near VAL or within the lower portion of the Value Area and subsequently moves toward the POC. If the Volume Profile Heatmap shows increasing estimated buying activity around the relevant price levels, the movement may indicate improving bullish participation.
A stronger bullish context can develop when price moves above the POC and approaches VAH. Traders can evaluate whether the market continues building activity at higher prices or rejects the upper Value Area boundary. A sustained move above VAH, supported by constructive price action and participation, may suggest that the market is beginning to establish value at higher levels.
For example, after an extended consolidation, price may break above VAH, briefly return to test the boundary, and then continue higher. The Volume Profile provides the location of the previous value boundary, while the heatmap adds information about estimated directional activity around that region. Traders can use this combination to evaluate potential continuation or retest setups.
Importantly, the presence of positive volume does not automatically confirm a bullish reversal or breakout. Strong volume can occur during both successful continuation and failed breakout attempts. Price confirmation and risk management remain necessary.
🟣Bearish Volume Profile Analysis
A bearish scenario may emerge when price struggles to remain above VAH and begins moving back toward the POC. If the heatmap displays concentrated estimated selling activity around the rejection area, traders may interpret the movement as a sign of increasing bearish participation.
A move below the POC can shift attention toward VAL, particularly when price continues trading within the lower portion of the Value Area. If price subsequently breaks below VAL and fails to recover that boundary, the previous volume distribution may become an important reference for evaluating bearish continuation.
For example, price may decline below VAL, recover temporarily toward the broken boundary, and then experience renewed selling pressure. The trader can compare the retest with the negative heatmap spectrum and the surrounding volume distribution to determine whether the market is showing signs of rejection at the previous value boundary.
However, estimated selling volume does not necessarily imply that price must continue lower. A high-volume decline may also occur during a temporary liquidation or a broader accumulation process. Volume Profile analysis is most useful when combined with market structure, support and resistance, and confirmation from subsequent price movements.
🟣Identifying Volume Concentration and Market Balance
Beyond directional setups, the Volume Profile Heatmap is useful for studying market balance. A broad volume concentration around the POC may reflect a region where substantial trading activity has accumulated. When price repeatedly moves around this area without establishing a sustained directional move, the market may be operating within a relatively balanced environment.
Conversely, narrow sections of the Volume Profile identify price levels where less activity has accumulated. These low-volume regions may become important when price moves between larger volume concentrations. Traders can observe whether price moves quickly through these areas or begins developing new volume distribution within them.
The information panel provides additional context by displaying the selected range, POC, VAH, VAL, value migration, and data quality. Value migration compares the POC positions of the current and previous sessions when sufficient data is available. A higher value classification reflects an upward shift, while a lower value classification indicates a downward shift. Stable value suggests that the shift remains within the indicator's classification threshold. These observations can help traders distinguish changes in the location of trading activity from short-term price fluctuations.
The data quality information is also important. When the selected range extends beyond the retained historical data, the indicator may identify the profile as incomplete. With complete-range validation enabled, an incomplete profile is withheld rather than presented as a fully calculated distribution.
🔵Settings
Profile Range: Select the analysis period: Visible Range, Last N Bars, Anchored Time, or Current Session.
Price Rows: Set the number of price levels used to build the Volume Profile. More rows provide finer price detail.
Value Area %: Define the percentage of total volume included between VAH and VAL. The default is 70%.
Lookback Bars: Choose how many recent candles are analyzed when using Last N Bars.
Start Time: Set the beginning of the selected period when using Anchored Time.
End Time: Set the end of the selected period when using Anchored Time.
Session Length: Choose daily or weekly session analysis.
Volume Data: Select lower-timeframe volume estimation or chart-timeframe OHLCV data.
Lower Timeframe: Choose the lower timeframe used for volume sampling, or allow automatic selection.
History Bars: Set the maximum number of chart candles retained for volume calculations.
Require Complete Range: Display only profiles with a verified complete range when enabled.
Buy & Sell Layout: Choose Stacked or Opposing to control how estimated buying and selling volume appears in the histogram.
Panel Position: Select the top-right, bottom-right, or top-left position for the information panel.
Dynamic POC Alert (Beta): Enable an experimental alert when price crosses the current dynamic POC on a confirmed candle.
🔵Conclusion
Understanding where trading activity is concentrated provides valuable context that cannot always be obtained from price movements alone. Volume Profile analysis helps traders distinguish established value regions from areas with relatively limited participation, while POC, VAH, and VAL create a structured framework for interpreting the relationship between price and accumulated volume.
By combining horizontal Volume Profile distribution with positive and negative Volume Heatmap spectrums, estimated Buy/Sell Volume, and Value Area analysis, traders can examine both the location and directional characteristics of market activity. This combination can be useful for identifying potential support and resistance areas, evaluating breakouts, observing market balance, and studying the movement of value between trading sessions.
The indicator is designed to support analytical decision-making rather than generate standalone trade entries. Directional volume remains an estimate based on candle information, and no individual volume level guarantees a particular market reaction. When used alongside price action, market structure, and appropriate risk management, the Volume Profile Heatmap provides a practical framework for evaluating price acceptance, volume concentration, and changing market conditions.

💎Paid Space (VIP): tradingview.com/spaces/TradingFinder/
✅Telegram support team: t.me/TFLABS
🧠Free Forex, Crypto & Stock Trading tutorial, same as ICT, Smart Money & Price Action:
tradingfinder.com/education/forex/
✅Telegram support team: t.me/TFLABS
🧠Free Forex, Crypto & Stock Trading tutorial, same as ICT, Smart Money & Price Action:
tradingfinder.com/education/forex/
คำจำกัดสิทธิ์ความรับผิดชอบ
ข้อมูลและบทความไม่ได้มีวัตถุประสงค์เพื่อก่อให้เกิดกิจกรรมทางการเงิน, การลงทุน, การซื้อขาย, ข้อเสนอแนะ หรือคำแนะนำประเภทอื่น ๆ ที่ให้หรือรับรองโดย TradingView อ่านเพิ่มเติมใน ข้อกำหนดการใช้งาน
💎Paid Space (VIP): tradingview.com/spaces/TradingFinder/
✅Telegram support team: t.me/TFLABS
🧠Free Forex, Crypto & Stock Trading tutorial, same as ICT, Smart Money & Price Action:
tradingfinder.com/education/forex/
✅Telegram support team: t.me/TFLABS
🧠Free Forex, Crypto & Stock Trading tutorial, same as ICT, Smart Money & Price Action:
tradingfinder.com/education/forex/
คำจำกัดสิทธิ์ความรับผิดชอบ
ข้อมูลและบทความไม่ได้มีวัตถุประสงค์เพื่อก่อให้เกิดกิจกรรมทางการเงิน, การลงทุน, การซื้อขาย, ข้อเสนอแนะ หรือคำแนะนำประเภทอื่น ๆ ที่ให้หรือรับรองโดย TradingView อ่านเพิ่มเติมใน ข้อกำหนดการใช้งาน