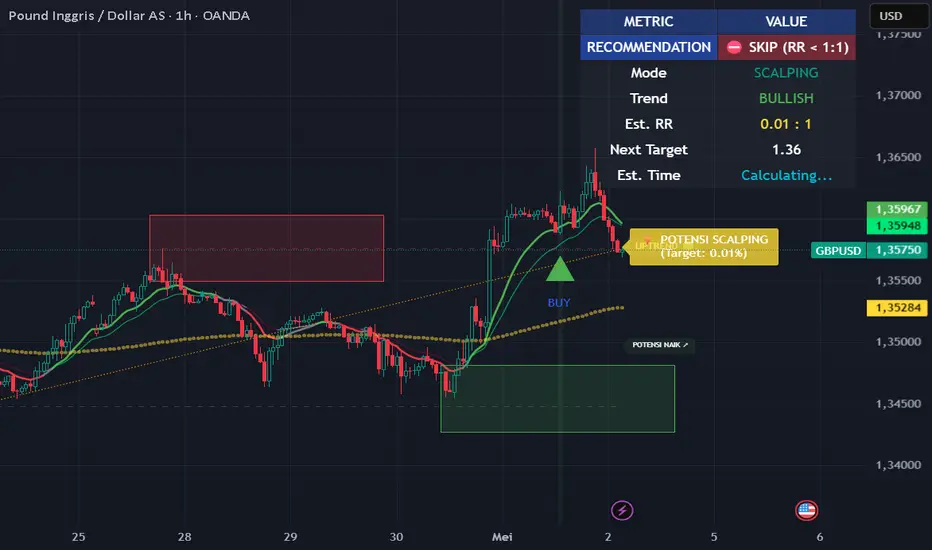
Aura RSP Matrix [Pineify] Pineify - Aura RSP Matrix - Relative Strength Phase Momentum
Aura RSP Matrix compares the chart symbol with a benchmark and classifies it into four relative-strength phases: Leading, Weakening, Lagging, and Improving. It shows whether relative performance is gaining or fading.
Key Features
Benchmark-relative RS Ratio and RS Momentum centered around 100.
Phase coloring for the oscillator, bars, markers, and dashboard.
Leading and Lagging labels fire only on the first bar of a new phase.
How It Works
The script requests the benchmark close on the timeframe, divides chart close by benchmark close, then normalizes the result with a WMA . This creates RS Ratio, where values above 100 show relative strength above its recent baseline.
RS Momentum compares RS Ratio with its own WMA baseline. Both series are smoothed with an EMA before phase detection. Smoothing reduces one-bar noise but adds lag.
How the Components Work Together
RS Ratio shows whether the symbol is strong or weak versus the benchmark. RS Momentum shows whether that position is improving or fading. Leading means both are above 100; Weakening means strength remains above 100 while momentum slips; Lagging means both are below 100; Improving means momentum turns up before RS Ratio confirms.
Trading Ideas and Insights
Use Leading as confluence for bullish setups, not as an automatic entry.
Watch Weakening after strong runs; it may show fading follow-through.
Use Improving to find names recovering against a benchmark.
Treat Lagging as a caution filter when stronger alternatives exist.
Signals are phase-change markers, not performance guarantees. In choppy markets the matrix can rotate around 100, and live bars may change until close.
Unique Aspects
Two-stage WMA normalization separates relative strength from relative momentum.
One four-state matrix keeps labels, bars, oscillator color, and dashboard status aligned.
The benchmark input supports market, sector, crypto pair, or cross-asset comparison.
How to Use
Add the indicator and choose a benchmark for your trading universe.
Read the phase from bar color, oscillator color, and dashboard.
Combine phases with price structure, volume, and higher-timeframe context.
Customization
Calculation Window (default: 20) - WMA normalization period. Higher is smoother; lower is faster.
Benchmark Ticker (default: SPX) - Relative strength comparison symbol.
Smoothing Factor (default: 3) - EMA smoothing after RS calculations.
Phase Colors and Toggles - Adjust colors, labels, and bar coloring.
Conclusion
Aura RSP Matrix is a relative strength context tool for rotation, watchlist filtering, and benchmark-relative trade selection. Use it with price action and risk controls, not as a standalone forecasting system. อินดิเคเตอร์

Market Memory Average (Zeiierman)█ Overview
Market Memory Average (Zeiierman) is a similarity-based market regime tool that scans historical price behavior to identify past conditions that closely resemble the current market state.
The script compares momentum, RSI, volatility, and relative volume to build a “market memory” model. It then extracts the internal momentum of the most similar historical states and blends them into a dynamic projection line.
The result is an adaptive average that reflects how the market has historically behaved when conditions looked like this, rather than relying on fixed formulas or traditional lagging averages.
█ How It Works
⚪ Market State Encoding
The script defines the current market using momentum (ROC), RSI, volatility (ATR%), and relative volume. These features describe how the market is behaving, not just price position.
⚪ Historical Similarity Scan
Each past bar is compared to the current state using a multi-feature distance model.
Closer matches receive higher weights through exponential decay:
similarity = 100 * exp(-distance * sensitivity)
⚪ Top Match Selection
The script ranks all historical states and keeps only the most similar ones. These represent past environments that closely resemble current conditions.
⚪ Memory Momentum
From each match, the script extracts its internal momentum (ROC).
A similarity-weighted average is then calculated:
avgMomentum = weightedMomentum / totalWeight
⚪ Market Memory Average
This averaged momentum is applied to the current price to form the line:
memoryLine = close * (1 + avgMomentum / 100)
The result reflects how similar market states have historically behaved.
⚪ Historical Match Zones
Optional boxes highlight where similar conditions occurred in the past, along with their similarity strength.
█ How to Use
⚪ Market Memory Average
Bullish color → market conditions align with historically positive momentum.
Bearish color → market conditions align with historically negative momentum.
Unlike traditional averages, this line is built from the similarity-weighted momentum of past market matches. The cloud and structure dynamically adapt based on how those historical conditions behaved.
This gives the line a context-driven, memory-based approach, rather than relying on fixed calculations. The result is a dynamic reference for directional bias and regime context, grounded in how the market has behaved under similar conditions before.
⚪ Study Historical Match Zones (Example 1)
The match boxes show where similar market conditions occurred in the past, based on momentum, volatility, RSI, and volume alignment.
Each box represents a moment where the market behaved as it does now.
These zones can help:
Visualize recurring structures: See how similar conditions previously formed, such as pullbacks, bottoms, or consolidation phases within a trend.
Identify behavioral clustering: When multiple matches appear around similar types of price action, it suggests the market frequently revisits this behavior.
Understand the current environment: By comparing where those matches occurred (trend, range, recovery), you can interpret what kind of phase the market is currently in.
Build a contextual bias: If most matches come from pullbacks and recoveries (as in the example), the current state aligns more with pause → stabilize → continue behavior, rather than reversal or breakdown conditions.
These zones provide context, not prediction, helping you understand how the market is behaving relative to its own history.
⚪ Study Historical Match Zones (Example 2)
In this example, the current market state most closely aligns with these two highlighted zones.
Both matches formed during bearish conditions:
The left match shows a rejection after a strong move up, with momentum quickly flipping into a sharp drop.
The right match shows a weak bounce inside a downtrend, where the price attempted to recover but continued lower.
Looking at the current state (circled area), the price is:
Breaking down aggressively
Moving similarly to those past rejection phases
This suggests the current behavior aligns more with rejection → continuation, rather than stabilization or reversal.
█ Settings
Historical Scan Depth: Controls how far back the script searches for similar market states.
Top Similar Matches: Determines how many historical matches influence the average.
Historical Pattern Length: Sets the width of the displayed historical match zones.
Similarity Sensitivity: Controls how strict the similarity comparison is.
RSI Length: Defines the oscillator component of the market state.
ATR Length: Controls volatility measurement used in both similarity and cloud calculations.
Volume MA Length: Defines how relative volume is calculated.
Average Smoothing: Controls the responsiveness of the Market Memory Average.
Slope Detection Length: Determines how trend direction is evaluated.
Cloud Spread: Controls how far the cloud extends from the line.
-----------------
Disclaimer
The content provided in my scripts, indicators, ideas, algorithms, and systems is for educational and informational purposes only. It does not constitute financial advice, investment recommendations, or a solicitation to buy or sell any financial instruments. I will not accept liability for any loss or damage, including without limitation any loss of profit, which may arise directly or indirectly from the use of or reliance on such information.
All investments involve risk, and the past performance of a security, industry, sector, market, financial product, trading strategy, backtest, or individual's trading does not guarantee future results or returns. Investors are fully responsible for any investment decisions they make. Such decisions should be based solely on an evaluation of their financial circumstances, investment objectives, risk tolerance, and liquidity needs.
อินดิเคเตอร์

อินดิเคเตอร์

Xander Ultimate Pro [Final Verified + Time Est - No NA Error]🚀 Xander Ultimate Pro
by @wijayanto_ok
The most advanced version of the Xander scalping system — now with Supply/Demand zones, EMA 200 bias filter, intelligent time estimation, and a smart recommendation engine. 100% error-free, non-repainting, and production-ready.
================================================================================
📌 OVERVIEW
================================================================================
Xander Ultimate Pro is a professional-grade Price Action trading system engineered for traders who demand precision, confirmation, and clarity. It synthesizes seven powerful analytical layers into one cohesive, visual interface:
✅ Multi-Timeframe Trend Bias using EMA 13/21/200 confluence
✅ Auto Fibonacci Retracement from confirmed swing structures
✅ Dynamic Support & Resistance with adaptive tolerance
✅ Supply/Demand Zone detection with visual box overlays
✅ Stochastic RSI + Volume confirmation for high-probability entries
✅ Smart Risk/Reward calculator with real-time ratio display
✅ Intelligent Time Estimation: "Scalp" vs "Swing" mode detection
✅ Actionable Recommendation Engine: "STRONG BUY/SELL", "WAIT", or "NO TRADE"
🎯 Best For: Timeframes 1m – 4H | Liquid assets (Forex majors, BTC/ETH, Indices, Commodities)
================================================================================
✨ KEY FEATURES
================================================================================
🔹 1. Advanced Trend Filter (Triple EMA System)
---------------------------------
• EMA Fast (13) + EMA Slow (21) + EMA 200 (Major Bias)
• Dynamic coloring with transparency:
🟢 Green = Bullish Confluence | 🔴 Red = Bearish Confluence | ⚪ Gray = Neutral/Sideways
• Adaptive label: "LT UPTREND" for daily+ timeframes, standard for lower TFs
• Sideways detection prevents low-quality entries in choppy markets
🔹 2. Auto Fibonacci Retracement
---------------------------------
• Automatically draws Fib from last confirmed Swing High/Low
• Highlights Golden Zone (0.618) as high-probability reversal area
• Directional label: "POTENSI NAIK ↗" (Bullish) or "POTENSI TURUN ↘" (Bearish)
• Non-repainting: Uses confirmed pivots only (lookback-based)
🔹 3. Dynamic Support & Resistance
---------------------------------
• Auto-detects Swing High/Low using ta.pivothigh() / ta.pivotlow()
• Horizontal dashed lines extended to current bar
• Adaptive tolerance: 0.2% for lower TFs, 0.5% for daily+ (reduces false breaks)
• Real-time line extension as new bars form
🔹 4. Supply & Demand Zone Boxes
---------------------------------
• Visual box overlays around key pivot zones
• Red box = Supply (potential sell zone) | Green box = Demand (potential buy zone)
• Configurable zone width (candles) and price tolerance
• Auto-extended 30 bars forward for proactive planning
🔹 5. Multi-Layer Entry Confirmation
---------------------------------
Component | Default Settings | Purpose
-------------------|---------------------------------|---------------------------
Stochastic RSI | RSI:14, %K:3, %D:3, OB:80, OS:20 | Momentum timing & reversals
Volume Filter | 20-period SMA comparison | Confirms institutional interest
Price Action Area | EMA zone / S/R bounce / Zone touch | Structural alignment validation
✅ BUY Signal Triggers When ALL Are True:
1. Bullish Trend (EMA13 > EMA21 AND price > EMA200)
2. Price in Buy Area (near EMA, Support, or Demand Zone)
3. StochRSI crosses UP from Oversold (<20)
4. Volume exceeds 20-period average
→ Green "BUY" triangle + green background highlight
✅ SELL Signal Triggers When ALL Are True:
1. Bearish Trend (EMA13 < EMA21 AND price < EMA200)
2. Price in Sell Area (near EMA, Resistance, or Supply Zone)
3. StochRSI crosses DOWN from Overbought (>80)
4. Volume exceeds 20-period average
→ Red "SELL" triangle + red background highlight
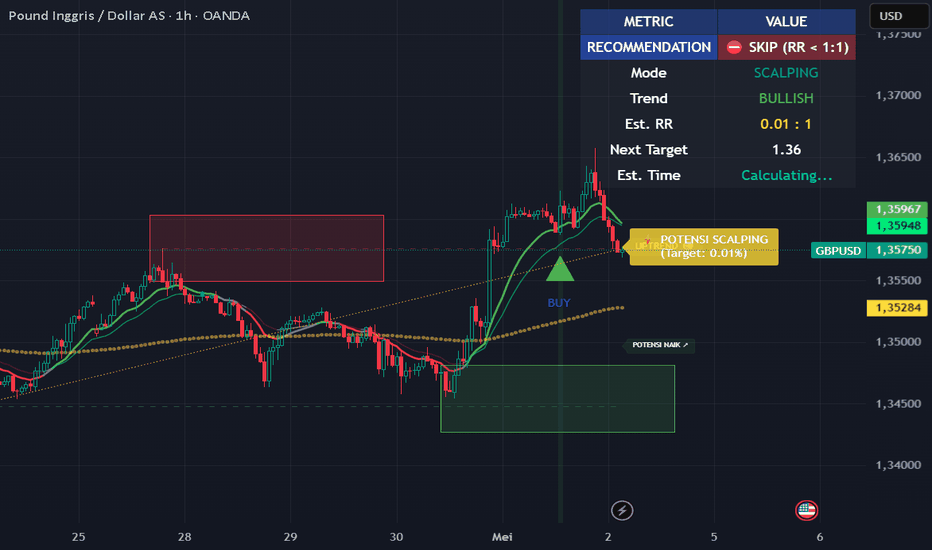
🔹 6. Smart Info Panel & Recommendation Engine
---------------------------------
📊 Real-Time Table (Top-Right Corner):
| Metric | Description |
|---------------|-------------|
| RECOMMENDATION| Actionable signal: "✅ STRONG BUY NOW", "⏳ WAIT MOMENTUM", "⛔ NO TRADE", etc. |
| Mode | Auto-detects: "SCALPING" (intraday) or "SWING/DAILY" (higher TF) |
| Trend | Current bias: BULLISH / BEARISH / NEUTRAL |
| Est. RR | Live Risk:Reward ratio (e.g., "1.85 : 1") |
| Next Target | Price level of nearest swing target |
| Est. Time | Projected duration: "~12 Candles (~Day)" |
🧠 Recommendation Logic:
• "✅ STRONG BUY/SELL NOW" → All entry conditions met + RR ≥ threshold
• "⏳ WAIT MOMENTUM" → Price in zone, awaiting StochRSI confirmation
• "⏳ WAIT PULLBACK" → Trend aligned, waiting for price to reach entry area
• "⛔ NO TRADE (Sideways)" → EMA confluence absent, avoid chop
• "⛔ SKIP (RR < 1:1)" → Potential reward too small vs risk
🔹 7. Intelligent Time Estimation Feature
---------------------------------
• Calculates last swing duration in candle count
• Converts to human-readable estimate based on timeframe:
- 1m–15m → "~X Candles (~Scalp)"
- 1h–12h → "~X Candles (~Day)"
- 1D+ → "~X Candles (~Swing)"
• Helps traders align position sizing and holding period expectations
🔹 8. Visual Scalping vs Swing Label
---------------------------------
• Auto-label above price action:
⚡ "POTENSI SCALPING" → Target < user-defined % threshold (default 1.0%)
🚀 "POTENSI SWING" → Target ≥ threshold
• Color-coded background for instant visual recognition
• Shows exact distance to target in percentage
🔹 9. Alert System (Production-Ready)
---------------------------------
• 🔔 "Xander BUY" → Triggers on confirmed buy signal
• 🔔 "Xander SELL" → Triggers on confirmed sell signal
• Message format: "BUY Signal | {{ticker}} | {{close}}" (customizable)
• Fully compatible with TradingView alerts: popup, email, webhook, SMS, Discord
================================================================================
⚙️ HOW TO USE
================================================================================
🔧 Initial Setup:
1. Add script to chart with timeframe 5m, 15m, 1H, or 4H (optimal range)
2. Recommended liquid instruments:
• Forex: EURUSD, GBPUSD, USDJPY, XAUUSD
• Crypto: BTCUSDT, ETHUSDT, SOLUSDT
• Indices: US30, NAS100, SPX500, GER40
• Commodities: XAUUSD, XAGUSD, OIL
🎯 LONG Entry Protocol:
1. Confirm panel shows "BULLISH" trend + "SCALPING" or "SWING" mode
2. Wait for price to enter Buy Area:
- Pullback to EMA 13-21 zone, OR
- Bounce from green Support line, OR
- Touch of green Demand Zone box
3. Confirm signal: Green BUY triangle appears + candle closes bullish
4. Verify StochRSI: Crossed up from <20 zone
5. Confirm Volume: Current bar > 20-period average
6. Check Panel: RR ≥ 1:1.5 and Recommendation = "✅ STRONG BUY NOW"
📍 Stop Loss: 1-2 ticks below lastSwingLow or Demand Zone bottom
🎯 Take Profit:
- Conservative: lastSwingHigh / Supply Zone top
- Aggressive: Fib 0.236 or 0.382 extension
- Always respect RR target ≥ 1:1.5
🎯 SHORT Entry Protocol:
1. Confirm panel shows "BEARISH" trend + mode label
2. Wait for price to enter Sell Area:
- Pullback to EMA 13-21 zone, OR
- Rejection from red Resistance line, OR
- Touch of red Supply Zone box
3. Confirm signal: Red SELL triangle appears + candle closes bearish
4. Verify StochRSI: Crossed down from >80 zone
5. Confirm Volume: Current bar > 20-period average
6. Check Panel: RR ≥ 1:1.5 and Recommendation = "✅ STRONG SELL NOW"
📍 Stop Loss: 1-2 ticks above lastSwingHigh or Supply Zone top
🎯 Take Profit:
- Conservative: lastSwingLow / Demand Zone bottom
- Aggressive: Fib 0.236 or 0.382 extension downward
- Always respect RR target ≥ 1:1.5
⚠️ Critical Filters (Do Not Ignore):
❌ NEVER trade when Recommendation = "⛔ NO TRADE (Sideways)"
❌ SKIP any signal with Est. RR < 1:1 (visible in panel)
❌ AVOID entries 5-10 minutes before/after high-impact news (NFP, CPI, FOMC)
❌ DO NOT chase entries if price is >2% away from EMA zone (overextended)
✅ ALWAYS wait for candle CLOSE beyond signal bar for confirmation
✅ ALWAYS use hard Stop Loss — never move it against your position
✅ Consider partial profit taking at 1:1 RR, let remainder run to target
================================================================================
🔍 TECHNICAL NOTES (For Advanced Users & Developers)
================================================================================
📐 Non-Repainting Architecture:
• Pivot detection: ta.pivothigh/low with rightBars = lookback → confirmed only after N candles
• All signals trigger on bar close, not intra-candle
• NA error prevention: All swing variables initialized with "not na()" guards
• Line/box management: Old objects deleted before new creation (prevents chart clutter)
📊 Adaptive Tolerance System:
• Lower TFs (1m-1H): tolerance = close * 0.002 (0.2%)
• Higher TFs (4H+): tolerance = close * 0.005 (0.5%)
• Prevents false S/R breaks on volatile assets while maintaining sensitivity
⏱ Time Estimation Logic:
lastMoveDuration = currentSwingIndex - previousSwingIndex
→ Converted to human-readable format via timeframe.period detection
→ Case-sensitive TF matching: "1m", "5m", "1h", "4h", "1D", etc.
→ Fallback: "Calculating..." until first full swing cycle completes
🧮 Risk/Reward Calculation:
// For LONG:
risk = entry_price - lastSwingLow
reward = lastSwingHigh - entry_price
RR = reward / risk
// For SHORT:
risk = lastSwingHigh - entry_price
reward = entry_price - lastSwingLow
RR = reward / risk
• Uses close price as proxy for entry (adjust manually for precision)
• Panel displays "N/A" or "Wait Swing" until valid swings are detected
🎨 Visual Optimization:
• Max limits set: max_lines_count=500, max_labels_count=500, max_boxes_count=100
• Transparent colors (color.new(..., alpha)) prevent chart clutter
• Background highlights only on confirmed signals (no visual noise)
================================================================================
⚠️ DISCLAIMER & RISK WARNING
================================================================================
🚨 CRITICAL NOTICE: This script is an analytical and educational tool only. It does NOT constitute financial advice, guarantee profits, or replace independent trading judgment.
1. ✅ Backtest Thoroughly: Validate performance in TradingView's bar replay mode across multiple market conditions (trending, ranging, high volatility) before live use.
2. ✅ Start Small: When going live, begin with minimal position size to verify real-world behavior matches backtest expectations.
3. ✅ Understand Limitations:
• Performs optimally in trending markets with clear structure
• May generate fewer signals (or whipsaws) in extreme sideways/choppy conditions
• News events can invalidate technical setups — always check economic calendar
4. ✅ Non-Repainting Confirmation:
• Signals appear only after candle close AND pivot confirmation
• Minor 1-candle lag on swing detection is intentional for reliability
• Do not anticipate signals — wait for full confirmation
5. ✅ Risk Management is Mandatory:
• ALWAYS use a hard Stop Loss on every trade
• Never risk more than 1-2% of account equity per trade
• Adjust position size based on SL distance, not signal strength
🔹 Trading forex, cryptocurrencies, indices, and derivatives involves substantial risk of loss and is not suitable for all investors. Past performance is not indicative of future results. Trade only with capital you can afford to lose entirely.
================================================================================
🔄 VERSION HISTORY
================================================================================
Version | Release Date | Key Updates
--------|--------------|--------------------------------------------------
1.0 | May 2026 | Initial public release: Core EMA + S/R + StochRSI + Volume + RR Table
1.1 | May 2026 | Added Supply/Demand zones, EMA 200 bias, adaptive tolerance
1.2 | May 2026 | Added Time Estimation, Smart Recommendation Engine, NA error fixes, Scalping/Swing auto-label, enhanced panel
================================================================================
💬 FEEDBACK, SUPPORT & COMMUNITY
================================================================================
• 🛠 Bug Reports: Please include screenshot + timeframe + asset name + steps to reproduce for fastest resolution.
• 💡 Feature Requests: Comment on the script page or DM @wijayanto_ok with detailed use case.
• 🤝 Collaborations: Open to integrating user-suggested indicators (with proper credit).
• 🌟 Show Support: If this tool adds value to your trading, a like, follow, or constructive review helps immensely.
📬 Preferred Contact: TradingView DM @wijayanto_ok
================================================================================
🔖 TAGS (For Search Optimization)
================================================================================
scalping, price-action, ema, fibonacci, support-resistance, supply-demand, stochastic-rsi, volume-profile, risk-reward, swing-trading, confirmation, non-repainting, tradingview, pine-script, indicator, strategy, auto-fib, time-estimation, recommendation-engine
================================================================================
✅ PRE-PUBLISH QUALITY CHECKLIST
================================================================================
Code compiles with zero errors or warnings in Pine Script v6
Tested on 5+ assets across Forex, Crypto, and Indices
Validated on timeframes: 5m, 15m, 1H, 4H, 1D
All user inputs have logical defaults and min/max constraints
Comprehensive inline comments for maintainability
Full risk disclaimer and educational warnings included
Alert conditions defined and tested
Zero repainting behavior confirmed via bar replay
NA/Null handling prevents runtime errors
Visual elements respect TradingView object limits
Documentation complete, professional, and mobile-friendly
English language optimized for global TradingView audience
================================================================================
🙏 FINAL WORDS
================================================================================
"Plan your trade, trade your plan. Consistency > Perfection."
— Xander Trading Philosophy
Thank you for trusting Xander Ultimate Pro with your market analysis.
May your entries be precise, your risk managed, and your RR always in your favor. 🎯📈
Happy Trading,
@wijayanto_ok
================================================================================
🔐 LICENSE
================================================================================
This Pine Script® code is subject to the terms of the Mozilla Public License 2.0
at mozilla.org
© 2026 wijayanto_ok. All rights reserved.
You are free to use, modify, and share this script for personal trading purposes.
Commercial redistribution or resale of the code is prohibited without explicit permission.
================================================================================ อินดิเคเตอร์
Xander Scalping Strategy [Price Action + Confirmation]🚀 Xander Scalping Strategy
by @wijayanto_ok
A multi-confirmation scalping strategy combining trend filtering, dynamic support/resistance, Stochastic RSI momentum, and volume confirmation — with visual Risk/Reward estimation for disciplined trading.
================================================================================
📌 OVERVIEW
================================================================================
Xander Scalping Strategy is a Price Action-based trading tool designed for traders who prioritize high-probability, multi-layer confirmation before entry. It helps identify:
✅ Trend Direction using EMA 13/21 crossover
✅ Dynamic Support & Resistance from confirmed swing highs/lows
✅ Precision Entry Signals via Stochastic RSI + Volume spike confirmation
✅ Visual Risk/Reward Estimator for smarter position management
🎯 Best For: Timeframes 5m – 1H | Liquid assets (Forex majors, BTC/ETH, Indices)
================================================================================
✨ KEY FEATURES
================================================================================
🔹 1. Trend Filter (EMA 13/21)
---------------------------------
• Fast EMA (13) & Slow EMA (21) with dynamic coloring:
🟢 Green = Uptrend | 🔴 Red = Downtrend | ⚪ Gray = Sideways
• Real-time trend label in top-right corner for quick reference
🔹 2. Dynamic Support & Resistance
---------------------------------
• Auto-detects Swing High/Low using ta.pivothigh() / ta.pivotlow()
• Horizontal S/R lines extended to the right (real-time visualization)
• Updates automatically when new swings are confirmed
⚠️ Note: 1-candle lag for pivot confirmation = non-repainting logic
🔹 3. Multi-Layer Entry Confirmation
---------------------------------
Component | Settings | Purpose
-------------------|---------------------------------------|---------------------------
Stochastic RSI | RSI Len: 14, %K: 3, %D: 3, OB: 80, OS: 20 | Momentum timing & reversal signals
Volume Filter | Avg Volume (20-period) | Filters low-liquidity false signals
Price Action | Pullback to EMA zone OR bounce/reject at S/R | Confirms structural alignment
✅ BUY Signal Conditions:
1. Uptrend (EMA 13 > EMA 21)
2. Price pulls back to EMA zone OR bounces from Support
3. StochRSI crosses UP from Oversold (<20)
4. Volume > 20-period average
→ Green "BUY" arrow appears below candle
✅ SELL Signal Conditions:
1. Downtrend (EMA 13 < EMA 21)
2. Price pulls back to EMA zone OR rejects from Resistance
3. StochRSI crosses DOWN from Overbought (>80)
4. Volume > 20-period average
→ Red "SELL" arrow appears above candle
🔹 4. Visual Risk/Reward Table (Top-Right)
---------------------------------
Metric | Description
----------|--------------------------------------------------
Status | Current trend or active signal (LONG/SHORT/UPTREND/DOWNTREND)
Est. RR | Estimated Risk:Reward ratio based on latest swing levels
💡 Tip: Use RR ≥ 1:1.5 as an additional filter for higher-quality entries.
🔹 5. Alert System
---------------------------------
• 🔔 "Xander Buy Signal" — Triggered when all BUY conditions met
• 🔔 "Xander Sell Signal" — Triggered when all SELL conditions met
• Compatible with TradingView alerts (popup, email, webhook, SMS)
================================================================================
⚙️ HOW TO USE
================================================================================
🔧 Setup:
1. Apply script to chart with timeframe 5m, 15m, or 1H
2. Recommended assets:
• Forex: EURUSD, GBPUSD, USDJPY
• Crypto: BTCUSDT, ETHUSDT
• Indices: US30, NAS100, SPX500
🎯 LONG Entry Setup:
1. Confirm "UPTREND 🟢" label is visible
2. Wait for pullback to EMA 13-21 zone OR bounce from green Support line
3. Confirm: Green BUY arrow appears + candle closes bullish
4. StochRSI: Crosses up from <20 zone
5. Volume: Bar higher than 20-period average
📍 Stop Loss: Below nearest lastSwingLow
🎯 Take Profit: Nearest lastSwingHigh OR RR target ≥1:1.5
🎯 SHORT Entry Setup:
1. Confirm "DOWNTREND 🔴" label is visible
2. Wait for pullback to EMA 13-21 zone OR rejection from red Resistance line
3. Confirm: Red SELL arrow appears + candle closes bearish
4. StochRSI: Crosses down from >80 zone
5. Volume: Bar higher than 20-period average
📍 Stop Loss: Above nearest lastSwingHigh
🎯 Take Profit: Nearest lastSwingLow OR RR target ≥1:1.5
⚠️ Recommended Filters:
❌ Avoid trading when label shows "SIDEWAYS ⚪"
❌ Skip signals with Est. RR < 1:1
❌ Avoid entries 5 min before/after high-impact news events
✅ Always confirm with candlestick patterns (pinbar, engulfing, etc.)
================================================================================
🔍 TECHNICAL NOTES (Advanced Users)
================================================================================
📐 Pivot Detection (Non-Repainting):
ph = ta.pivothigh(high, lookbackPeriod, lookbackPeriod)
pl = ta.pivotlow(low, lookbackPeriod, lookbackPeriod)
• Requires rightBars = lookbackPeriod for confirmation → NO REPAINTING
• New swing confirmed only after N candles close to the right
• Recommended: lookbackPeriod = 50 for significant swings; 20-30 for responsive signals
📊 Stochastic RSI Calculation:
rsiSource = ta.rsi(close, 14)
stoch = (rsiSource - lowestRSI) / (highestRSI - lowestRSI) * 100
%K = ta.sma(stoch, 3), %D = ta.sma(%K, 3)
• Measures relative momentum within 0–100 range
• Crosses at extremes (20/80) offer high-probability reversal signals
📈 Risk/Reward Estimation:
// For BUY:
risk = close - lastSwingLow
reward = lastSwingHigh - close
RR = reward / risk
• Uses latest confirmed swing levels as reference for SL/TP
⚠️ Estimates only — always adjust to real-time market structure
================================================================================
⚠️ DISCLAIMER & RISK WARNING
================================================================================
🚨 IMPORTANT: This script is an analytical tool only. It does NOT guarantee profits or replace sound trading judgment.
1. Backtest First: Test in demo mode for 2–4 weeks before live trading.
2. No Holy Grail: No strategy wins 100%. Manage expectations and use strict money management.
3. Market Conditions: Performs best in trending markets. May underperform in extreme sideways or news-driven volatility.
4. Non-Repainting: Signals appear only after candle close and pivot confirmation. Minor 1-candle lag on swing detection is intentional for reliability.
5. Always Use Stop Loss: Never trade without predefined risk protection.
🔹 Trading forex, crypto, and derivatives carries substantial risk of loss. Trade only with capital you can afford to lose.
================================================================================
🔄 VERSION HISTORY
================================================================================
Version | Date | Changes
--------|------------|--------------------------------------------------
1.0 | May 2026 | Initial release: EMA + S/R + StochRSI + Volume + RR Table
================================================================================
💬 FEEDBACK & SUPPORT
================================================================================
• 🛠 Found a bug? Report with screenshot + timeframe + asset for faster resolution.
• 💡 Have an improvement idea? Comment below or DM @wijayanto_ok.
• 🌟 Enjoying the script? A like/follow helps support future updates!
"Plan your trade, trade your plan. Consistency > Perfection."
— Xander Scalping Philosophy
================================================================================
🔖 TAGS (For Search Optimization)
================================================================================
scalping, price-action, ema, support-resistance, stochastic-rsi, volume, risk-reward, swing-trading, confirmation, non-repainting, tradingview, pine-script
================================================================================
✅ PRE-PUBLISH CHECKLIST
================================================================================
Tested on 3+ assets & timeframes
All inputs have sensible defaults
Code is well-commented & structured
Risk disclaimer included
Alert conditions defined
No unwanted repainting logic
Documentation complete & professional
================================================================================
🙏 Thank you for using Xander Scalping Strategy!
Happy trading, and may your RR always be in your favor. 🎯📈
================================================================================ อินดิเคเตอร์

อินดิเคเตอร์

Price oscillator [Session Adjusted]Price Oscillator
This indicator combines directional momentum bias with dynamic volatility analysis, helping traders identify both trend direction and potential exhaustion zones.
Core Concept
The oscillator calculates the percentage deviation of price from a session-adjusted moving average (close / MA - 1).
The histogram is plotted as always-positive columns (green when price is above the MA, red when below). This design enables a clear visual comparison between momentum strength and the Bollinger Band Width (BBW).
When the colored columns cross above the BBW line, it signals an over-extended condition, often indicating a high probability of imminent correction or mean reversion.
Volatility Analysis
The blue BBW line is a key element of the indicator:
- Rising BBW (positive slope) indicates volatility expansion — typically associated with strong trending moves or breakout phases.
- Falling BBW (negative slope) indicates volatility contraction — often signaling consolidation periods or impending explosive moves.
Main Features
Adaptive Lookback Period:
Automatically adjusts based on the selected session duration (default 24 hours), providing timeframe consistency.
Flexible Smoothing:
Choose between SMA, EMA, RMA, or WMA for the reference moving average.
Dual Signal System:
Colored columns show momentum direction and strength.
BBW line reveals both the level and the direction (slope) of volatility.
Exhaustion Zones:
Crosses between momentum columns and BBW act as dynamic overbought/oversold signals.
How to Use
Directional Bias Filter: Green columns = bullish bias | Red columns = bearish bias.
Volatility Regime: Use the slope of the BBW line to distinguish between trending (expanding volatility) and consolidating (contracting volatility) environments.
Correction Signals: Watch for strong momentum columns crossing above the BBW line — this frequently precedes pullbacks or reversals.
Particularly effective on Forex pairs and European indices (DAX, CAC40, FTSEMIB, etc.) on 1H to 4H, and Daily timeframes.
อินดิเคเตอร์

3AK On Balance Turnover [OBT]📊 3AK On Balance Turnover (OBT)
3AK OBT (On Balance Turnover) is a price-action + participation indicator designed to help swing traders understand the strength behind a move , not just the move itself.
While traditional indicators like On Balance Volume focus on volume, this indicator goes one step further by tracking turnover (Volume × Price) — giving a clearer picture of money flow into and out of a stock.
🔍 What does this indicator show?
The indicator plots a cumulative turnover line (OBT) that rises or falls based on price movement:
When price moves up → turnover is added
When price moves down → turnover is subtracted
This creates a running total of buying vs selling pressure — helping you see whether real money is supporting the trend .
💡 How to interpret OBT (Key Insights)
1. Strength during pullbacks
One of the most powerful uses of OBT is during pullbacks.
If price pulls back but OBT stays near highs, it suggests:
The selling pressure is weak
The overall trend is still strong
The pullback may be temporary (market-driven, not stock weakness)
👉 This helps traders avoid exiting strong stocks too early due to minor corrections.
2. Breakout readiness using Smoothening Curve
You can optionally enable a smoothening curve (Moving Average of OBT).
When OBT is far above the curve → it may be extended
When OBT and curve are close together → compression phase
👉 Breakouts tend to have a higher probability when OBT and its curve are close, as it indicates buildup before expansion.
3. Early breakout signals (OBT leads Price)
Markers help identify important signals:
🟪 New OBT High before Price High
OBT makes a new high, but price hasn’t yet
Indicates accumulation happening quietly
👉 Often signals that a price breakout may be near
🟨 New OBT High + Price High
Both OBT and price make new highs together
👉 Confirms strong momentum and participation
(Both markers can be turned ON/OFF from settings based on your preference.)
🎯 Why use On Balance Turnover instead of Volume?
Volume alone doesn’t always reflect true participation.
OBT improves this by incorporating price:
High volume at low price ≠ High volume at high price
OBT captures actual traded value, making it more meaningful
⚙️ Customization
Choose different smoothening types: SMA, EMA, WMA, VWMA
Adjust smoothening length
Control visibility of breakout markers
Configure lookback period for “new high” detection (default: 65 bars ~ 3 months)
⚠️ Disclaimer
This indicator is designed for educational and swing trading purposes only.
It does not guarantee profits or successful trades.
Market conditions, news, and broader sentiment can impact price behavior. Always use this indicator alongside your own analysis and risk management. อินดิเคเตอร์

Momentum Pullback Continuation [AGPro Series]Momentum Pullback Continuation
🧠 Core Idea
Is a momentum pullback resetting cleanly for continuation, or is the move losing its execution quality?
📌 Overview / What it does
Momentum Pullback Continuation is a chart-first continuation planner built for traders who review momentum-driven trends after a controlled pullback.
The script maps a momentum reset pocket, continuation trigger line, invalidation rail, target-room corridor, state labels, alerts, and a clean AGPro planning panel. It converts trend support, momentum slope, pullback depth, close recovery, volume behavior, and target room into a 0-100 Continuation Score.
The default publication preset is 1H-focused. Higher timeframes can be tested from the inputs, but the strongest intended use case is hourly momentum pullback review.
It does not predict price, automate entries, or turn every trend pullback into a signal. It is a structured decision tool for evaluating whether the current momentum reset deserves closer review.
🎯 Purpose & Design Philosophy
This script was built to fill the gap between basic momentum readings and practical continuation planning.
Many traders can see that momentum exists, but the harder question is whether the pullback is resetting in a controlled way or damaging the continuation structure. This planner focuses on that decision layer.
The design supports a disciplined workflow: identify the active momentum side, inspect the reset pocket, evaluate the score, locate the invalidation rail, compare target room, and read the next-action state.
⚡ Why This Script Is Different
Most tools focus on momentum oscillators, moving-average direction, divergence events, or generic continuation labels.
This script does NOT clone Hidden Divergence Continuation Zones, Trend Continuation Quality, Structural Momentum Oscillator, ROC Momentum Shift Map, or a generic pullback signal map.
Instead, it treats the pullback as a planning event. The main output is not a buy/sell marker. It is a momentum reset decision state with score, risk edge, target-room context, and action guidance.
⚙️ Methodology
1. Context Detection
The script identifies bullish or bearish momentum context using an EMA stack, normalized trend slope, and smoothed rate-of-change pressure.
2. Reference Mapping
It builds a concept-native Momentum Reset Pocket around the active trend support area, then maps a continuation trigger line, invalidation rail, and target-room guide.
3. Reaction Evaluation
The score model evaluates momentum slope, pullback depth, trend support, close recovery, volume behavior, and available target room.
4. Visual Output
The chart shows the reset pocket, target-room corridor, trigger and risk guides, compact event labels, sparse context labels, alerts, and a premium AGPro panel.
🗺️ How to Read the Chart
Reset Pocket = the area where a momentum pullback is expected to stabilize before continuation can be reviewed.
Trigger Line = the fast continuation reference that price needs to recover after the reset.
Invalidation Rail = the planning line where the active reset context is considered lost.
Target-Room Corridor = the forward planning area between current price and the target-room guide.
Labels = RESET, WATCH, READY, WEAK, and INVALID attention markers.
Colors = teal marks bullish continuation context, pink marks bearish continuation context, amber marks weak or caution states, indigo marks watch/target-room context, and red marks invalidation.
Panel = summarizes Momentum State, Pullback Quality, Continuation Score, Risk Edge, and Action.
🚦 Signals & States
• RESET → price has interacted with the momentum reset pocket.
• WATCH → the reset is developing, but recovery or score quality is not complete.
• READY → momentum, pullback depth, recovery, volume context, and target room align strongly enough for structured review.
• WEAK → the pullback is too deep, low quality, or not recovering well enough.
• INVALID → price has crossed the invalidation rail and the active reset context should be rebuilt.
🔔 Alerts Logic
Alerts trigger when READY, WATCH, WEAK RESET, or INVALID states appear.
Each alert is an attention marker tied to the rule-based state engine. Alerts are not trade instructions and do not guarantee that continuation will occur.
🧩 Confluence Logic
The continuation context becomes stronger when trend support, positive momentum slope, controlled pullback depth, clean close recovery, acceptable volume behavior, and target-room availability align.
The script intentionally requires multiple conditions instead of labeling every pullback inside a trend as meaningful.
📊 When to Use
• Directional markets with visible momentum pressure
• 1H charts and nearby intraday momentum review
• Trend continuation review workflows
• Pullbacks after a clear momentum impulse
• Situations where risk edge and target room matter before acting
• Markets where volume and close behavior are readable enough to support context
⚠️ When NOT to Use
• Low-liquidity symbols with unreliable candles or volume
• Extremely choppy markets with frequent trend-side flips
• News-driven volatility where reset structure changes too quickly
• Very flat markets where momentum pressure is absent
• Instruments where the active pullback is far beyond the mapped risk edge
🎛️ Key Inputs
• Continuation Side → selects Auto, Bullish Only, or Bearish Only evaluation.
• Timeframe Profile → keeps the default script behavior focused on 1H charts, with optional broader intraday or all-timeframe testing.
• Sensitivity → adjusts how strict the momentum reset model is.
• EMA settings → define trigger, reset, and support references.
• Momentum ROC settings → control the internal momentum pressure reading.
• Reset Pocket Width → changes how wide the reset area is around trend support.
• READY / WATCH Score → sets state thresholds.
• Visual settings → control zones, guide lines, labels, panel theme, panel location, and font sizes.
🖥️ Interface & Visual Design
The interface is designed to stay chart-first and practical.
The reset pocket and target-room corridor provide the main visual planning structure. Labels are compact and spaced with cooldown controls. The AGPro panel uses a single merged blue header row and focuses only on the core decision fields.
🧪 Practical Usage Workflow
1. Read the panel Momentum State.
2. Check whether price is interacting with the Momentum Reset Pocket.
3. Compare Pullback Quality and Continuation Score.
4. Locate the Risk Edge and Target-Room Corridor.
5. Use the Action row to decide whether the context is READY, still WATCH, weak, invalid, or only worth scanning.
🔍 Interpretation Guidelines
Think of the script as a continuation readiness map, not a command system.
A higher score means the active momentum pullback matches the script's internal definition of cleaner continuation structure. A lower score means one or more components are missing, such as trend support, recovery quality, volume context, or target room.
The invalidation rail is a planning boundary for the active context. It is not a guaranteed stop level and should not replace the user's own risk process.
🚫 What This Script Is NOT
This script is not a prediction engine.
This script is not financial advice.
This script is not an auto-trading system.
This script does not provide guaranteed signals.
This script does not replace independent confirmation, position sizing, or risk management.
⚠️ Limitations & Transparency
Momentum continuation behavior changes across symbols, sessions, and timeframes.
The default 1H Focus profile intentionally suppresses active labels, zones, and alerts outside the intended hourly review window.
Low-liquidity markets can distort volume behavior and reset quality.
High volatility can widen risk edges and reduce target-room clarity.
Sideways conditions can create repeated resets without clean continuation.
No rule-based script can fully account for sudden news, spread changes, slippage, or discretionary execution constraints.
🧠 Market Context Notes
Momentum pullbacks are often more useful when the broader trend remains intact, the pullback is controlled rather than impulsive against trend, and the recovery candle shows clear close quality.
The best reads usually come from alignment between structure, momentum, volume, volatility, and clean forward room.
🧾 Use Case Examples
When price pulls into the reset pocket during bullish momentum and then recovers the trigger line with a stronger score, the script can mark READY for continuation review.
When price enters the pocket but momentum slope fades and pullback depth becomes excessive, the script can mark WEAK RESET.
When price crosses the invalidation rail, the active reset context is treated as lost and should be rebuilt.
🧱 System Philosophy
AGPro tools are built around structured interpretation.
The goal is not to create more chart noise. The goal is to turn visible market behavior into a cleaner decision framework: context, quality, risk, target room, and next action.
🔐 Non-Promise Statement
No script can provide certainty.
No score guarantees continuation.
The output should be interpreted as structured context, not as a promise of future price movement.
📉 Risk Disclosure
Trading involves risk.
Users are responsible for their own analysis, confirmation, position sizing, and decisions.
This script is for educational and analytical use only and does not provide financial advice.
📚 Educational Note
Use the planner to study how momentum resets behave across different symbols and timeframes. Over time, compare READY, WATCH, WEAK RESET, and INVALID states to understand which environments produce cleaner continuation structure.
อินดิเคเตอร์

Concordia Regime Execution [JOAT]Concordia Regime Execution
Introduction
Concordia Regime Execution is an open-source TradingView strategy that integrates regime detection, trend bias, structure, momentum breadth, pressure confirmation, and ATR-based risk management into one non-repainting execution model. The strategy is built as a realistic framework rather than a curve-fit showcase.
The problem Concordia solves is signal fragmentation. Regime, trend, structure, and momentum are often evaluated separately, which leads to entries taken in the wrong environment. Concordia requires multiple engines to align before a position is opened, then manages risk through predefined stop, target, trailing, and bias-failure exits.
Core Concepts
1. Regime Detection
ADX, choppiness, and compression work together to classify whether the market is suitable for directional participation.
2. Trend Bias Filter
Fast, intermediate, and structural EMAs plus anchored VWAP context define directional bias before any entry can pass.
3. Structure Confirmation
Confirmed bullish or bearish breaks of recent swing structure add structural alignment to the trade decision.
4. Momentum Breadth
A compact ribbon engine classifies whether fast momentum is actually expanding in the same direction as trend and structure.
5. Pressure and Risk Layer
Chart-derived pressure and crowding inputs help confirm continuation and suppress entries during elevated stress.
6. Risk Management
Each trade uses ATR-based initial stop placement, ATR-based profit target, optional trailing activation, and bias-failure closure if internal conditions deteriorate.
Features
Regime gate: Expansion, compression, and transitional filtering
Trend alignment: EMA stack plus anchored VWAP bias logic
Structure filter: Recent swing break confirmation
Momentum breadth: Ribbon spread confirmation instead of a single oscillator line
Pressure confirmation: Chart-derived directional pressure and crowding logic
Risk model: ATR stop, ATR target, trailing trigger, and bias-failure exit
Top-right dashboard: Regime, bias, structure, momentum, pressure, risk, setup scores, active position, and stop/target levels
Confirmed-bar entries: All setup logic is gated on confirmed bars
How to Use This Strategy
Step 1: Start with liquid markets
Concordia is better suited to instruments where anchored VWAP, ATR, and structure transitions behave consistently.
Step 2: Use realistic assumptions
Commission, slippage, and position sizing inputs should match your actual market and trading conditions before evaluating performance.
Step 3: Evaluate regime quality first
The strategy is intentionally selective. If the market is compressing or structurally unstable, fewer trades should occur.
Step 4: Review bias-failure exits
These exits are included to avoid overstaying trades when internal alignment breaks down before the stop or target is reached.
Strategy Limitations
Like any rules-based strategy, it can underperform in abrupt gap conditions or news-driven spikes
ATR-based exits adapt to volatility, but they are not guaranteed to be optimal for every instrument
The strategy is intentionally conservative and may miss some fast reversals
Historical performance does not guarantee future results
Originality Statement
Concordia Regime Execution is original in the way it integrates regime, trend, structure, momentum breadth, pressure confirmation, and ATR-based trade management into a single open-source strategy designed for realistic chart use rather than decorative backtest output.
Disclaimer
This strategy is provided for educational and informational purposes only. It is not financial advice and should not be treated as a recommendation to buy or sell any instrument. Strategy results are based on historical chart data and platform assumptions. Live trading results can differ materially. Always validate settings and use independent risk management.
กลยุทธ์

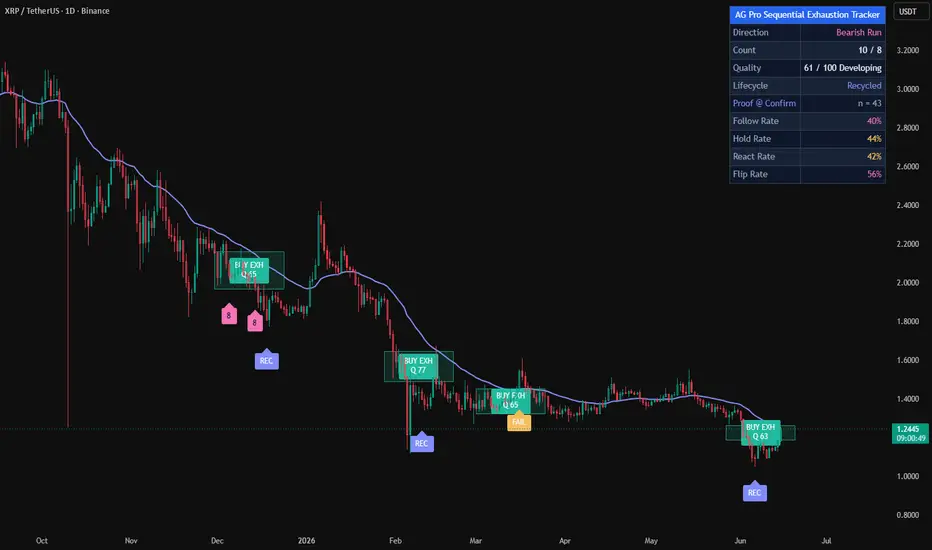
Reversal Confirmation Planner [AGPro Series]Reversal Confirmation Planner
🧠 Core Idea
Is a reversal actually confirming, or is it still only an early reaction?
📌 Overview / What it does
Reversal Confirmation Planner is a chart-first planning tool built to separate early reversal reactions from structured confirmation context.
The script detects sweep or wick-rejection reactions around recent swing references, then evaluates whether the reaction develops into a cleaner confirmation plan. It maps a confirmation pocket, invalidation edge, target-room band, compact event labels, alerts, and a clean AG Pro decision panel.
It does not predict reversals, automate entries, or scan every classical reversal pattern. The goal is to help traders organize the confirmation phase: reaction quality, confirmation close, momentum turn, volume support, room, invalidation, and next action.
🎯 Purpose & Design Philosophy
This script was built for traders who do not want to treat every wick, sweep, or counter-move as a valid reversal.
Many reversal tools mark the first reaction. This planner waits for structure. It asks whether price has moved from reaction into confirmation, whether momentum is turning, whether volume supports the shift, and whether the active plan has enough room before the next projected guide.
The design supports a decision-making workflow. It does not ask the user to chase every signal. It helps the user decide whether the reversal context is still early, building, confirming, confirmed, failed, expired, or already testing its room.
⚡ Why This Script Is Different
Most reversal tools focus on detecting a pattern, labeling a wick, or marking every possible counter-trend reaction.
This script does NOT behave like a broad reversal-pattern scanner, double-top/double-bottom detector, head-and-shoulders module, 1-2-3 map, wedge detector, Turtle Soup map, liquidity sweep tool, or generic support/resistance zone script.
Instead, it works as a confirmation planner. The core workflow is reaction → confirmation pocket → invalidation edge → target-room context → next-action state. This keeps the public concept narrow, useful, and clearly separate from other AGPro reversal tools.
⚙️ Methodology
1. Context Detection
The script watches for bullish or bearish reversal reactions using sweep behavior, wick rejection, candle close location, and prior directional context.
2. Reference Mapping
Once a reaction qualifies, the planner creates a confirmation line, confirmation pocket, invalidation edge, and target-room guide.
3. Reaction Evaluation
The model scores sweep or rejection quality, confirmation progress, momentum turn, volume support, and available room.
4. Visual Output
The chart shows the active confirmation pocket, centered target-room band, risk/target guide lines, compact labels, alert conditions, and an AG Pro panel with the current decision state.
🗺️ How to Read the Chart
Confirmation Pocket = the area between the reaction reference and the confirmation close line.
Invalidation Edge = the level beyond the reaction extreme where the active confirmation plan is considered failed by the script rules.
Target-Room Band = a projected planning zone that shows whether the reversal has enough forward room relative to the active risk distance.
Labels = compact state markers such as REACTION, CONFIRMING, CONFIRMED, FAILED, EXPIRED, ROOM TESTED, or PLAN.
Colors = teal supports bullish reversal planning, pink supports bearish reversal planning, amber marks developing context, indigo marks target-room context, and red marks invalidation or failed confirmation.
Panel = summarizes Reversal Stage, Confirmation Score, Invalidation, Room, and Action.
🚦 Signals & States
• REACTION → an early sweep or rejection is active, but confirmation is not complete.
• BUILDING → the context is improving, but the confirmation close is not fully qualified.
• CONFIRMING → price is testing or closing through the confirmation line with sufficient structure to review.
• CONFIRMED → the confirmation score and close behavior meet the script threshold.
• ROOM TESTED → the projected target-room guide has been reached after confirmation.
• FAILED → the active plan violated its invalidation edge.
• EXPIRED → the reaction did not confirm within the selected confirmation window.
🔔 Alerts Logic
The script includes alerts for bullish reaction, bearish reaction, bullish confirmation, bearish confirmation, failed confirmation, and high-quality confirmation.
Alerts trigger when the internal rule conditions are met. They are attention markers for chart review, not trade instructions, automated entries, or guaranteed reversal signals.
🧩 Confluence Logic
The strongest confirmation context appears when multiple layers align:
• A clear sweep or rejection reaction forms.
• Price progresses through the confirmation pocket.
• Momentum begins to turn in the reaction direction.
• Volume support is not weak.
• The target-room band offers enough room relative to invalidation distance.
When these layers align, the confirmation score becomes stronger. When one or more layers are weak, the state usually remains reaction, building, expired, or failed.
📊 When to Use
• After visible sweep or rejection behavior.
• During possible reversal transitions after directional extension.
• Around swing references where confirmation matters more than the first wick.
• 4H swing-review charts, where the default label spacing and confirmation pockets usually have the cleanest visual balance.
• Daily charts when the user wants fewer but more selective reversal confirmation states.
• In markets where traders want to compare reaction quality, invalidation, and room before acting.
• For discretionary review of crypto, forex, indices, equities, and commodities on liquid charts.
⚠️ When NOT to Use
• Extremely low-liquidity symbols with unreliable wicks or volume.
• Very noisy micro-timeframes where reaction candles are unstable.
• News spikes or extreme volatility events where confirmation levels can be crossed erratically.
• Charts where the user expects a complete reversal-pattern scanner.
• Situations where the user wants automated trade execution.
🎛️ Key Inputs
• Confirmation Mode → controls whether labels and alerts wait for bar close or update live.
• Swing Reference Length → defines the recent swing references used for sweep-based reactions.
• Sensitivity → adjusts how selective the reaction model is.
• Confirmation Window Bars → limits how long a reaction can wait for confirmation.
• Minimum Reaction Score → controls the quality required before tracking a candidate.
• CONFIRMED Threshold → controls the minimum 0-100 score required for confirmed state.
• Preferred Room / Risk → adjusts how much forward room is preferred relative to invalidation distance.
• Visual settings → control pockets, bands, guide lines, labels, panel position, panel theme, and font sizes.
🖥️ Interface & Visual Design
The interface is built around a premium chart-first workflow.
The confirmation pocket and target-room band are concept-native visuals, not generic support/resistance zones. Their labels are centered inside the boxes for cleaner chart reading.
The default visual preset is tuned for 4H-style swing review: enough labels to keep the chart informative, but enough spacing to avoid a crowded reversal scanner look.
The AG Pro panel uses a compact structure with one merged blue title row and five decision rows. It is designed to show only the current planning context without turning the chart into a dashboard-heavy script.
🧪 Practical Usage Workflow
1. Read the panel state.
2. Check whether the chart is showing REACTION, BUILDING, CONFIRMING, CONFIRMED, FAILED, or EXPIRED.
3. Review the confirmation pocket and invalidation edge.
4. Compare target-room context against the room/risk readout.
5. Use alerts as review prompts, not as trade instructions.
🔍 Interpretation Guidelines
Treat the first reaction as incomplete information.
A higher score means the reaction has developed more confirmation structure according to the script rules. It does not mean the reversal must continue.
A failed or expired state is also useful information. It tells the user that the reaction did not confirm cleanly under the selected rules.
🚫 What This Script Is NOT
• Not a prediction engine.
• Not financial advice.
• Not auto trading.
• Not guaranteed signals.
• Not a broad reversal-pattern scanner.
• Not a full liquidity sweep system.
• Not a generic support/resistance zone tool.
⚠️ Limitations & Transparency
All outputs are rule-based and depend on the selected inputs, timeframe, and symbol behavior.
Swing references confirm with natural delay. Wick structure can be noisy on low-liquidity symbols. Volume quality varies across markets. Fast volatility can cause reactions to confirm and fail quickly.
The confirmation score is an internal comparison model. It is useful for reading this script's framework, but it is not an objective probability model.
🧠 Market Context Notes
Reversal confirmation is strongest when price reacts from a meaningful extension, then follows through with cleaner close behavior and improving participation.
The script is intentionally focused on the confirmation phase. It does not attempt to map every higher-timeframe structure, order block, fair value gap, harmonic pattern, or reversal formation.
🧾 Use Case Examples
When price sweeps below a recent swing low, closes back above it, then starts progressing through the confirmation pocket, the planner may shift from REACTION to BUILDING or CONFIRMING.
When price confirms but the room/risk readout is weak, the user can see that the reversal may be structurally less attractive inside this framework.
When price violates the invalidation edge before confirmation, the planner marks the context as FAILED instead of leaving the reaction visually ambiguous.
🧱 System Philosophy
The AGPro approach is to build decision engines, not decorative signal boards.
This script focuses on one clear question: did the reversal reaction earn confirmation, or is it still only a reaction?
🔐 Non-Promise Statement
No script can confirm future price movement with certainty.
This tool provides structured context, not guarantees.
📉 Risk Disclosure
Trading involves risk.
This script is for educational, analytical, and chart-review purposes only. It does not provide financial advice, investment advice, or guaranteed trading outcomes.
Users remain responsible for their own decisions, risk management, position sizing, and broader market analysis.
📚 Educational Note
Use the planner to study how reactions mature, fail, expire, or confirm under consistent rules. The value is in disciplined interpretation, not in treating any single label as a complete trading system.
อินดิเคเตอร์

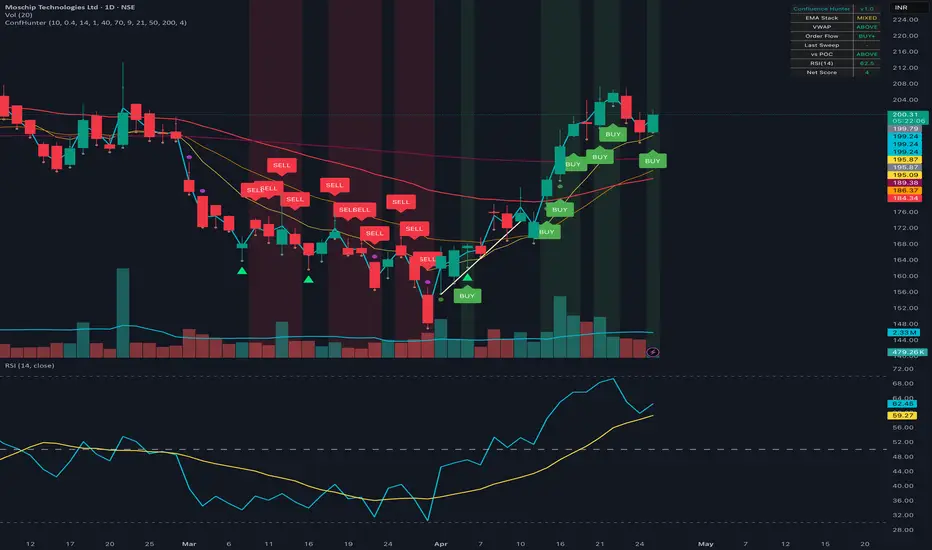
Confluence HunterConfluence Hunter is a multi-factor confluence engine that fuses six independent dimensions of market behavior into one signal. Instead of firing on a single condition (a moving average cross, an RSI level), it only triggers when at least 4 of 6 factors agree on the same bar — dramatically cutting false signals.
THE SIX FACTORS
1. EMA STACK (Trend) — 9 / 21 / 50 / 200 EMAs. Stacked up = uptrend; stacked down = downtrend; mixed = chop, stay out.
2. SESSION VWAP (Fair Value) — Volume-weighted average price anchored to the daily session, with a configurable ±σ band. Price above VWAP = bulls in control.
3. LIQUIDITY SWEEPS (Structure) — Detects stop hunts: bars that pierce a recent swing high/low and snap back with a strong rejection wick (≥40% of range by default). These are the highest-edge structural events on the chart and act as the trigger.
4. ORDER FLOW DELTA (Intent) — Bar-by-bar buy/sell pressure derived from close position within range × volume, smoothed with an EMA. Strong-delta bars are highlighted with circle markers below/above.
5. SESSION VOLUME PROFILE (Acceptance) — Plots POC, VAH, and VAL for the active session using a configurable bin count (default 40 rows) and Value Area % (default 70%). Trading above POC with the trend = strong continuation; below POC against the trend = caution.
6. RSI(14) (Momentum) — Tiebreaker confirming momentum supports the bias.
CONFLUENCE SCORING
Each factor returns +1 (bullish), 0 (neutral), or −1 (bearish). The dashboard in the top-right shows the live status of each. A green BUY label fires only when bullish count ≥ 4 AND bearish count ≤ 1 (defaults). The same logic mirrors for SELL labels.
HOW TO USE FOR STOCK SELECTION
Step 1 — Filter by regime: throw it on the daily chart of every name in your watchlist. Skip anything with a MIXED EMA stack or trading on the wrong side of the 200 EMA.
Step 2 — Rank by Net Score: cycle the survivors and rank by the dashboard's Net Score (bullCount − bearCount, max ±6). +5 or +6 = A-tier setup.
Step 3 — Wait for a structural trigger: don't enter at +6 alone (you're late). Wait for either a fresh BUY/SELL label or a sweep arrow near a key level (VWAP, POC, or VAL).
Step 4 — Confirm on lower timeframe: drop to 1H/15m and require the same bullish/bearish state. Multi-timeframe alignment cuts losers significantly.
ENTRY / STOP / TARGET FRAMEWORK
- Entry: close of the BUY/SELL bar, or pullback to VWAP / 9-21 EMA on the next bar.
- Stop: just beyond the wick of the sweep bar.
- Target 1: opposite VWAP band (take 50% off).
- Target 2: prior session POC or next swing high; trail rest with 21 EMA.
INPUTS
All factors are tunable: swing lookback, sweep strictness (wick ratio), VWAP band width, volume profile rows and value area %, EMA lengths, and minimum confluence threshold (default 4 of 6 — raise to 5 for fewer/cleaner signals, lower to 3 for more visual analysis).
ALERTS
Built-in alerts for: Confluence BUY, Confluence SELL, Bullish Liquidity Sweep, Bearish Liquidity Sweep.
LIMITATIONS
- The order-flow delta is a proxy from close-position-in-range × volume. Pine Script does not have access to real exchange tick/footprint data. It is directionally useful but not equivalent to true CVD.
- Volume Profile is session-anchored (resets daily), not visible-range. For multi-day profiles, layer TradingView's built-in Volume Profile Visible Range on top.
- For Forex (where volume is tick-based, not real volume) the OF and VP factors are weaker — lean more on EMAs + VWAP + sweeps.
Works on any market: equities, futures, commodities, crypto, forex. Best on 1H, 4H, and Daily timeframes.
This script is free and open-source. Feedback and forks welcome. อินดิเคเตอร์

Impulse Follow-Through Quality [AGPro Series]Impulse Follow-Through Quality
🧠 Core Idea
Did the impulse receive enough follow-through to remain valid?
📌 Overview / What it does
Impulse Follow-Through Quality is a chart-first momentum expansion planner built to evaluate what happens after a strong impulse candle appears.
Instead of treating every strong candle as a standalone signal, the script starts a follow-through review window and measures whether price extends, pauses constructively, pulls back too deeply, reaches a target-room guide, or crosses a failure rail. These elements are converted into a 0-100 Impulse Quality score and a clear next-action state.
The script produces an impulse highlight, follow-through box, failure rail, measured target guide, compact labels, alerts, and a clean AGPro planning panel. It does not predict continuation, automate trades, or guarantee that momentum will continue.
🎯 Purpose & Design Philosophy
This script was built for traders who want to separate a meaningful impulse from a candle that only looks strong for one bar.
Many momentum tools focus on the impulse itself. The practical question often comes after that candle: does the move attract follow-through, or does it begin to fail? This planner fills that gap by turning the post-impulse phase into a readable decision process.
The design supports a patient review mindset: identify the impulse, watch the follow-through window, evaluate pullback depth, check target room, and review the failure rail before reacting.
⚡ Why This Script Is Different
Most tools focus on strong candles, volume spikes, momentum bursts, or basic continuation labels.
This script does NOT act as a Volume Climax Detector, does NOT rebuild an Institutional Candle Detector, and does NOT reduce the chart to a simple buy/sell momentum signal.
Instead, it evaluates what happens after the impulse. The key output is not the candle itself. The key output is the follow-through quality state: IMPULSE, WAIT FT, FT WATCH, VALID FT, PULLBACK RISK, WEAK FT, FAILED, or TARGET REVIEW.
⚙️ Methodology
1. Context Detection
The script detects qualified bullish or bearish impulse candles using ATR-normalized range, body efficiency, close location, trend context, and participation.
2. Reference Mapping
Once an impulse qualifies, the script maps the impulse origin, follow-through box, failure rail, and target-room guide.
3. Reaction Evaluation
The model evaluates follow-through progress, closes beyond the impulse close, retracement depth, participation support, target room, and whether price crosses the failure rail.
4. Visual Output
The result is displayed through an impulse highlight, centered follow-through box label, failure rail, target guide, compact labels, deterministic alerts, and a premium AGPro panel.
🗺️ How to Read the Chart
Impulse Highlight = the latest qualified impulse leg that starts the review window.
Follow-Through Box = the active planning area between the impulse close and the measured target-room guide. Its label is centered inside the box.
Failure Rail = the practical invalidation reference behind the impulse. It is an analytical line, not a stop order.
Target Guide = a measured target-room reference based on the impulse range.
Labels = compact state markers for impulse start, constructive follow-through, weak follow-through, pullback risk, failure rail review, and target review.
Colors = teal supports constructive long-side follow-through, pink supports short-side or failure context, amber marks review risk, and indigo marks watch states.
Panel = summarizes Impulse Quality, Follow-Through, Pullback Risk, Target Room, and Action.
🚦 Signals & States
• IMPULSE → a qualified impulse candle has started a review window.
• WAIT FT → the impulse exists, but follow-through is not confirmed yet.
• FT WATCH → follow-through conditions are improving but not strong enough for the highest state.
• VALID FT → follow-through quality is constructive according to the rule set.
• PULLBACK RISK → retracement depth is elevated inside the impulse range.
• WEAK FT → the follow-through window is aging without enough progress.
• FAILED → price crossed the failure rail behind the impulse.
• TARGET REVIEW → price reached the measured target-room guide and context should be reviewed.
🔔 Alerts Logic
Alerts can trigger when a new impulse starts, follow-through becomes constructive, follow-through enters watch state, the move weakens, pullback risk rises, price crosses the failure rail, or price reaches the target-room guide.
Each alert is an attention marker. Alerts are not trade instructions, entry commands, exit commands, or automated strategy rules.
🧩 Confluence Logic
The strongest context appears when a clean impulse candle is followed by measurable progress, multiple closes beyond the impulse close, controlled retracement depth, supportive participation, and readable target room.
When these components weaken, the planner can shift toward WAIT FT, FT WATCH, PULLBACK RISK, WEAK FT, or FAILED.
📊 When to Use
• After strong momentum candles where continuation quality matters.
• During trend continuation attempts that need follow-through review.
• After breakout or expansion bars where a one-bar move may be misleading.
• On liquid symbols where ATR, candle structure, and volume behavior are readable.
• When you want a post-impulse planning map instead of another raw momentum signal.
⚠️ When NOT to Use
• Very low-liquidity symbols with unstable candles or unreliable volume.
• Extremely noisy micro-timeframes where impulse candles appear too frequently.
• News-driven spikes where one-bar expansion can distort the model.
• Markets with large gaps that make ATR and failure-rail references less useful.
• Situations where the user expects guaranteed continuation or automated trade signals.
🎛️ Key Inputs
• Follow-Through Side → controls Auto, Long Follow-Through, or Short Follow-Through mode.
• Minimum Impulse ATR → changes how large a candle must be before review begins.
• Minimum Body Efficiency → controls how clean the impulse body must be.
• Minimum Edge Close → controls how near the candle must close to its directional edge.
• Follow-Through Window → controls how many bars are used to judge early continuation.
• Required Progress ATR → defines preferred movement after the impulse close.
• Maximum Pullback Ratio → controls when retracement depth becomes elevated risk.
• Failure Rail Buffer ATR → adjusts the analytical failure rail behind the impulse.
• Visual settings → control the impulse highlight, follow-through box, failure rail, target guide, labels, panel visibility, panel location, theme, and font sizes.
🖥️ Interface & Visual Design
The interface is designed to stay chart-first.
The impulse highlight gives the origin. The follow-through box gives the active planning area. The failure rail and target guide define the practical review frame.
The AGPro panel provides a compact decision summary with a merged blue title row, adjustable panel location, adjustable theme, and adjustable font size.
🧪 Practical Usage Workflow
1. Read the panel Impulse Quality score and Action.
2. Check the impulse highlight and the direction of the follow-through box.
3. Review whether price is extending beyond the impulse close.
4. Compare pullback depth with the failure rail.
5. Use the target guide as a context-review reference, not as a guarantee.
6. Treat alerts as attention markers inside broader analysis.
🔍 Interpretation Guidelines
Think in terms of follow-through quality, not prediction.
A higher score means the impulse has more constructive continuation characteristics according to the script's rule set. A weaker score means the move may be aging, retracing too deeply, lacking progress, or crossing its failure reference.
VALID FT does not mean price must continue. FAILED does not mean the market cannot recover later. The states organize the review process.
🚫 What This Script Is NOT
• Not a prediction engine.
• Not financial advice.
• Not an auto-trading system.
• Not a guaranteed signal tool.
• Not a buy/sell signal service.
• Not a Volume Climax Detector.
• Not an Institutional Candle Detector.
• Not a generic momentum oscillator.
⚠️ Limitations & Transparency
The script is rule-based and depends on recent price action, ATR, candle structure, selected inputs, and volume behavior.
Different timeframes can produce different impulse and follow-through readings. Volatility spikes can temporarily distort the score. Symbols with unreliable volume may produce weaker participation readings.
Outputs should always be interpreted with broader market structure, liquidity, and trader-defined risk controls.
🧠 Market Context Notes
Impulse candles are only useful when the market confirms or rejects them through follow-through.
A clean impulse that receives controlled extension may deserve more attention than a larger candle that immediately retraces. A smaller impulse can also become meaningful when the follow-through window stays organized.
🧾 Use Case Examples
When price prints a strong bullish impulse, closes near the high, then follows through with multiple closes above the impulse close while pullback depth remains controlled, the planner may classify the move as VALID FT.
When an impulse appears but price fails to extend, retraces deeply, or crosses the failure rail, the planner may shift toward WEAK FT, PULLBACK RISK, or FAILED.
🧱 System Philosophy
AGPro planning tools are designed to help traders evaluate context before reacting.
This script follows that philosophy by turning impulse follow-through into a structured planning question: did the move receive enough confirmation, progress, and risk clarity to remain worth reviewing?
🔐 Non-Promise Statement
No indicator can guarantee continuation, reversal, breakout success, or outcome.
This tool provides structured visual context and rule-based attention markers. It does not provide certainty.
📉 Risk Disclosure
Trading involves risk.
Market conditions can change quickly, and no script can remove uncertainty.
Users are responsible for their own analysis, risk management, position sizing, and trading decisions.
This script is for educational and analytical use only and does not provide financial advice.
📚 Educational Note
Use the planner to study how strong candles behave after they appear, how follow-through quality changes across timeframes, and how pullback depth affects the readability of momentum continuation.
อินดิเคเตอร์

Setup Decay Tracker [AGPro Series]Setup Decay Tracker
🧠 Core Idea
Is a once-valid setup still healthy, or is its quality decaying over time?
📌 Overview / What it does
Setup Decay Tracker is a chart-first execution planning tool built to evaluate what happens after a setup has already started forming. Instead of treating every trigger as equally useful, it separates the process into two stages: setup validation and post-validation quality decay.
The script builds an active decay band, validation rail, follow-through rail, invalidation shelf, expiry marker, state labels, and a compact planning panel. Its purpose is to show whether the active setup is still valid, starting to fade, entering decay review, expiring, reclaiming its trigger side, or invalidating.
It does not predict price, automate trades, or issue buy/sell commands. Alerts and labels are attention markers designed to help traders review setup quality within broader market context.
🎯 Purpose & Design Philosophy
This script was built for traders who already understand that the first setup trigger is only the beginning of the decision process. A setup can look valid at first, then lose quality because time passes, momentum fades, volatility contracts, follow-through stalls, or price loses and reclaims the trigger side.
The gap it fills is post-validation review. Many tools mark a trigger, but fewer tools ask whether that trigger is aging well after it becomes valid. Setup Decay Tracker focuses on that question with a clean visual workflow.
The design supports a planning mindset: validate first, monitor quality second, review decay third.
⚡ Why This Script Is Different
Most tools focus on the moment a signal appears.
This script does NOT behave like a generic signal generator, broad regime classifier, support/resistance map, order-block map, or simple breakout alert.
Instead, it tracks the lifecycle of one active setup after validation. It asks whether the setup is still earning its place on the chart by measuring time risk, follow-through, momentum loss, volatility loss, trigger-side reclaim behavior, and invalidation context.
⚙️ Methodology
1. Context Detection
The script identifies the evaluation side using trend and range context, or the user can force long-side or short-side tracking.
2. Setup Validation
A trigger starts tracking, but the setup is not treated as fully valid until it reaches minimum favorable ATR travel and a validation-quality threshold.
3. Decay Evaluation
After validation, the script measures the active setup with a 0-100 decay model based on time risk, momentum loss, volatility loss, failed follow-through, and reclaim behavior.
4. Visual Output
The result appears as a decay band, validation rail, follow-through rail, invalidation shelf, expiry marker, compact labels, and a premium AGPro planning panel.
🗺️ How to Read the Chart
Zones = the active setup decay band between the follow-through reference and the invalidation shelf.
Labels = state changes such as TRACK, VALID, WATCH, DECAY, RECLAIM, EXPIRED, and INVALID.
Colors = teal for healthier states, gold for watch states, pink/red for decay review or invalidation pressure, and indigo for validation or reclaim context.
Panel = the decision summary showing Decay Score, Time Risk, Follow-Through, Invalidation, and Action.
🚦 Signals & States
• TRACK → a new setup is being monitored for validation
• VALID → the setup reached minimum quality and decay tracking is active
• STILL VALID → decay score remains low and follow-through is still acceptable
• QUALITY WATCH → quality is fading, but the setup has not reached decay review
• DECAY REVIEW → the setup has enough quality decay to deserve closer review
• RECLAIM → price recovered the trigger side after temporary loss
• EXPIRED → the setup aged beyond the active decay window or reached expiry-level decay
• INVALID → the invalidation shelf was crossed inside this rule set
🔔 Alerts Logic
The script includes alerts for:
• New setup tracking
• Setup validation
• Quality watch state
• Decay review state
• Trigger-side reclaim
• Setup expiry
• Setup invalidation
Alerts are attention markers. They are not trade instructions and should be interpreted with market structure, liquidity, volatility, and timeframe context.
🧩 Confluence Logic
The decay model becomes more meaningful when several conditions align.
When time risk rises, follow-through remains weak, momentum fades, volatility contracts, and price struggles around the trigger side, the setup decay context becomes stronger.
When follow-through improves, the trigger side holds, volatility remains healthy, and momentum stays directional, the setup remains cleaner.
📊 When to Use
• Breakout setups that need post-trigger validation
• Trend-reclaim setups where quality can fade after the first reclaim
• Continuation contexts where follow-through matters
• Active trade planning where invalidation and target references need to stay visible
• Markets where setup aging and time risk are part of the decision process
⚠️ When NOT to Use
• Extremely low-liquidity symbols
• Very noisy micro timeframes where triggers appear too frequently
• News-driven candles where normal volatility logic becomes distorted
• Markets with large gaps that make ATR-based validation less stable
• Situations where the user expects automatic entries, exits, or guaranteed outcomes
🎛️ Key Inputs
• Evaluation Side → chooses Auto, Long Setup, or Short Setup tracking
• Trigger Model → controls whether tracking starts from range acceptance, trend reclaim, or impulse continuation
• Sensitivity → changes how strict validation and decay response should be
• Setup Lookback → defines the recent structure window used for trigger context
• Validation Travel ATR → sets the minimum favorable movement needed before a setup is considered valid
• Decay Tracking Bars → controls how long a validated setup remains active
• Follow-Through Target ATR → defines the progress reference used inside the decay model
• Invalidation Buffer ATR → builds the invalidation shelf beyond the trigger candle
• Label and Panel Font Size → controls visual readability
🖥️ Interface & Visual Design
The interface is built around a clean chart-first layout. The decay band gives the setup a visible lifecycle area, while the centered band label summarizes the active state without requiring a dashboard-only workflow.
The panel is compact and decision-focused. Its first row follows the AGPro standard: one merged blue header row containing only the panel title. Panel location, panel theme, and panel font size are adjustable.
Labels are intentionally moderate. The script uses event labels plus sparse context labels so the chart stays alive without becoming crowded.
🧪 Practical Usage Workflow
1. Read the panel and check the active state.
2. Confirm whether the setup is validating, still valid, in watch state, in decay review, expired, or invalidated.
3. Check the decay band, validation rail, follow-through rail, and invalidation shelf.
4. Review labels for the most recent state change.
5. Interpret the output with broader market context before making any decision.
🔍 Interpretation Guidelines
Think of the Decay Score as a quality-loss meter, not a directional forecast.
A low Decay Score suggests that the setup is still holding its validation context.
A rising Decay Score suggests that time, weak progress, fading momentum, volatility loss, or trigger-side instability are reducing setup quality.
A Decay Review state means the setup deserves attention. It does not mean price must reverse or that a trade must be closed.
🚫 What This Script Is NOT
• Not a prediction engine
• Not financial advice
• Not an auto-trading system
• Not a guaranteed signal tool
• Not a generic support/resistance map
• Not a broad market regime classifier
⚠️ Limitations & Transparency
ATR-based rails can behave differently across markets, timeframes, and volatility regimes.
Fast news moves, thin liquidity, and wide spreads can distort validation and decay readings.
No rule-based tool can fully understand every market condition. The output should be read as structured context, not certainty.
🧠 Market Context Notes
Setup decay often matters most when the first trigger was valid but follow-through becomes uncertain. A setup can remain technically alive while losing momentum, time efficiency, or volatility support.
The script focuses on that middle zone between “still valid” and “clearly invalidated.”
🧾 Use Case Examples
When price breaks a recent range, validates with minimum travel, then stalls for many bars without reaching the follow-through rail, the Decay Score can rise into watch or review context.
When price temporarily loses the trigger side and then reclaims it, the script marks reclaim context and continues monitoring quality rather than treating the setup as automatically clean.
When price crosses the invalidation shelf, the setup is marked invalid inside this rule set.
🧱 System Philosophy
Setup Decay Tracker follows the AGPro planning approach: the best public tools should help traders make a decision, not simply show another signal.
The script is designed to answer practical questions:
Is this setup valid?
How much quality has it lost?
Where is the invalidation?
Is follow-through still acceptable?
What should I review now?
🔐 Non-Promise Statement
This script does not provide certainty.
It does not guarantee outcomes.
It provides a structured way to monitor setup quality decay after validation.
📉 Risk Disclosure
Trading involves risk.
Users are responsible for their own analysis, decisions, risk management, and trade execution.
This script is for educational and analytical purposes only and does not provide financial advice.
📚 Educational Note
Use the tool to study how setup quality changes after the first valid trigger. The most useful reading often comes from comparing the panel state, decay band, labels, and broader market context together.
อินดิเคเตอร์

Entry Timing Quality [AGPro Series]Entry Timing Quality
🧠 Core Idea
Is the current setup timing early, improving, in-window, late, or already exhausted?
📌 Overview / What it does
Entry Timing Quality is a chart-first execution timing tool built to evaluate when a setup deserves attention from a timing perspective.
The script produces a 0-100 Timing Score, a timing window, an invalidation rail, target-side room context, early / improving / prime / late / exhausted state labels, a momentum clock marker, alert conditions, and a clean AGPro panel.
It does not predict price direction, automate execution, print directional commands, or replace a trader's own setup model. Its purpose is to organize timing quality after a setup thesis already exists.
🎯 Purpose & Design Philosophy
This script was built for traders who already see a possible setup but need a cleaner way to judge whether the timing is too early, becoming actionable, already extended, or no longer fresh.
The gap it fills is specific: many tools show entries, signals, levels, or broad readiness states, but they do not isolate the timing phase of a setup.
The design supports a disciplined execution-review mindset: timing first, risk context second, action only after independent confirmation.
⚡ Why This Script Is Different
Most tools focus on printing entries, highlighting generic signals, or building full trade plans.
This script does NOT act as a full Entry Execution Readiness system, Position Planner, Reward Room Analyzer, or directional signal indicator.
Instead, it answers a narrower timing question: is the setup still early, improving into a better timing window, in a prime timing phase, late, exhausted, or structurally invalidated?
⚙️ Methodology
1. Context Detection
The script detects the active timing side automatically from trend structure, or lets the user force long-side or short-side timing review.
2. Reference Mapping
It maps a timing window around the active trigger reference, an invalidation rail from recent structure, a late timing rail, and target-side reference room.
3. Reaction Evaluation
The model scores trigger proximity, candle efficiency, pullback maturity, momentum reset, volatility expansion, risk distance, and target-side room.
4. Visual Output
The chart displays the active timing window, target-side room context, invalidation rail, late timing rail, momentum clock marker, event labels, alerts, and the AGPro panel.
🗺️ How to Read the Chart
Zones = the timing window and target-side room context.
Invalidation rail = the structural level that weakens or resets the current timing read.
Late timing rail = the area where timing may become extended rather than fresh.
Labels = compact markers for Early, Improving, Prime, Late, Exhausted, and Invalidated states.
Colors = teal for stronger long-side timing context, pink for short-side or invalidation context, amber for early or late caution, and indigo for improving timing.
Panel = the fast decision cockpit showing Timing Score, Window State, Momentum Phase, Risk Distance, and Action.
🚦 Signals & States
• PRIME -> timing score and confirmation conditions align inside or near the active timing window.
• IMPROVING -> timing is building but has not reached the Prime threshold.
• EARLY -> the setup exists, but timing still needs cleaner proximity, reset, or candle quality.
• LATE -> price has stretched away from the timing window and may be less fresh.
• EXHAUSTED -> extension, pullback damage, or momentum heat suggests the timing phase needs reset.
• INVALIDATED -> price closed beyond the structural invalidation rail.
🔔 Alerts Logic
Prime Timing alerts trigger when the state upgrades into Prime Timing.
Improving Timing alerts trigger when the setup moves into an active monitoring state.
Late / Exhausted alerts trigger when the timing phase becomes stretched or no longer fresh.
Invalidation alerts trigger when price closes beyond the active invalidation rail.
Alerts are attention markers. They are not trading instructions.
🧩 Confluence Logic
Timing quality improves when trigger proximity, candle efficiency, pullback maturity, momentum reset, stable volatility, trend support, and target-side room align.
The score is intentionally multi-factor so a single candle or a single trend condition cannot dominate the timing read.
📊 When to Use
• Pullback timing reviews
• Trend continuation setups that need timing discipline
• Breakout continuation setups after a reset
• Execution-review workflows where a setup thesis already exists
• Charts where the user wants to avoid chasing late movement
⚠️ When NOT to Use
• Very low-liquidity symbols
• Extremely noisy sideways markets
• News-shock volatility spikes
• Charts where no independent setup thesis exists
• Situations where exact broker-level execution rules are required
🎛️ Key Inputs
• Timing Side -> Auto, Long Timing, or Short Timing review mode.
• Sensitivity -> adjusts how early or selective the timing model becomes.
• Timing Lookback -> affects structure references, pullback maturity, risk distance, and target-side room.
• Minimum Prime Timing Score -> sets the threshold required for Prime Timing.
• Confirmation Mode -> controls how much candle, trend, and momentum confirmation is required.
• Label Cooldown / Max Visible Labels -> controls label density and chart cleanliness.
• Visual settings -> control timing window, momentum clock marker, label offsets, and font sizes.
• Panel settings -> control panel visibility, location, theme, and font size.
🖥️ Interface & Visual Design
The panel follows the AGPro public-release standard with one merged blue header row containing only the script name.
The chart is designed to feel active but not crowded. It uses one timing window, one invalidation rail, one late rail, target-side room context, a compact momentum clock marker, and controlled event labels.
Label and panel font sizes are adjustable, with Normal as the default.
🧪 Practical Usage Workflow
1. Read the panel Timing Score and Window State.
2. Check whether price is inside, near, late beyond, or away from the timing window.
3. Review the Momentum Phase to see whether timing is resetting, expanding, hot, or cooling.
4. Compare Risk Distance with target-side room context.
5. Treat Prime Timing as a review state, not as an automatic execution command.
🔍 Interpretation Guidelines
A high Timing Score means the modeled timing conditions are cleaner than usual according to the script's rules.
An Improving state can be useful because it shows timing is building but not yet fully aligned.
A Late or Exhausted state does not mean price must reverse. It means the timing read is no longer fresh and should be reviewed with extra caution.
The best interpretation comes from reading score, state, momentum phase, risk distance, and invalidation together.
🚫 What This Script Is NOT
• Not a prediction engine
• Not financial advice
• Not auto trading
• Not guaranteed signals
• Not a full position-sizing planner
• Not a directional command system
• Not a full reward-room or target-planning tool
⚠️ Limitations & Transparency
The model is rule-based and depends on recent structure, ATR, moving-average context, candle behavior, and RSI-based momentum reset.
Different timeframes can produce different timing windows and invalidation rails.
Fast volatility expansion can move a setup from Improving to Late quickly.
No rule-based tool can know future price behavior, order-book conditions, spreads, or a user's execution plan.
🧠 Market Context Notes
Timing is most useful when read together with broader market structure, liquidity, trend condition, volatility, and session context.
A setup can have good direction but poor timing.
A setup can also have a clean timing window but poor broader context.
🧾 Use Case Examples
When price pulls back near the timing window, momentum resets, candle quality improves, and risk distance remains controlled, the state may move from Early to Improving or Prime.
When price stretches far beyond the late rail while momentum becomes hot, the script may mark Late or Exhausted rather than encouraging the user to chase.
When price closes beyond the invalidation rail, the active timing read is marked as Invalidated.
🧱 System Philosophy
AGPro tools are designed to convert visible chart information into structured decision context.
This script follows that philosophy by separating timing quality from generic signals, full trade planning, or prediction language.
🔐 Non-Promise Statement
No script can provide certainty.
No timing score can guarantee a future outcome.
This tool organizes visible timing conditions so users can perform a more structured review.
📉 Risk Disclosure
Trading involves risk.
Users are responsible for their own analysis, execution, risk management, and decisions.
This script is for educational and analytical purposes only and does not provide financial advice.
📚 Educational Note
Use the script to study how timing improves, becomes prime, stretches late, exhausts, or invalidates around a structured execution window.
อินดิเคเตอร์

RKB_MechTradeThe RKB MechTrade Momentm indicator is a comprehensive, all-in-one dashboard designed for Momentum and swing traders and investors. Upgraded to the latest Pine Script™ v6, it consolidates relative strength, volume analysis, trend momentum, and price-action proximity into a single, non-intrusive on-chart table.
Here is a breakdown of the core features and how to use them:
1. 52-Week High & Customizable Pullback Bands
The indicator plots the 52-week highest high directly on your chart, serving as a primary benchmark for resistance and breakouts.
Dynamic Pullback Bands: Below the 52-week high, it plots two customizable percentage bands (defaulting to 10% and 23% below the high).
Use Case: These bands help visualize structural support zones and identify textbook pullback setups (like VCPs or flag patterns) relative to the yearly high.
2. Z-Score of Returns (ZOR)
The ZOR module is the engine of the script's relative strength analysis.
How it works: It measures the performance of the base asset against a comparative benchmark (defaults to NSE:NIFTY) over multiple weighted timeframes (63, 126, 189, and 252 days).
The Score: It normalizes these weighted returns into a clean Z-Score. A score above 60 is highlighted in blue, indicating strong relative momentum and market outperformance. Values below 60 are flagged in red.
Note: To ensure data accuracy, ZOR is explicitly calculated and displayed only on the Daily timeframe.
3. Price Proximity Metrics (DTH & DTE)
Knowing how extended a stock is can prevent buying at the top or shorting at the bottom.
Distance to High (DTH): Calculates the exact percentage gap between the current closing price and the 52-week high. If the stock is breaking out, it clearly states "At or Above 52W High".
Distance to EMA (DTE): Measures the percentage deviation from a user-defined EMA (default 21-period). This is an excellent metric for spotting mean-reversion opportunities or avoiding heavily overextended entries.
4. Institutional Volume & Traded Value (Turnover)
Rather than just looking at raw volume bars, this script calculates the actual capital flowing into the asset.
Traded Value in Crores: It calculates the traded turnover (Volume × Close Price) and adapts automatically to your chart. On a Daily chart, it shows daily turnover; on a Weekly chart, it accumulates the weekly turnover.
Color-Coded Liquidity: The Traded Value cell changes color based on strict liquidity thresholds:
Red: Less than 5 Cr (Low Liquidity)
Amber: 5 Cr to 50 Cr (Moderate Liquidity)
Green: Greater than 50 Cr (High Institutional Liquidity)
Volume Context: It also compares current volume to a long-term average (default 500 periods), tagging the session as "Trade" (active) or "Low" (quiet).
5. Trend Angle & Price Velocity
MA Angle (∠): Calculates the geometric slope/angle of a chosen Moving Average (defaults to a 20-period EMA). A positive angle indicates a clear uptrend, while a negative angle warns of a downtrend.
Velocity: Analyzes the current bar's High-Low range against a 14-period average. If the current range is wider than the average, it tags the market as "Fast" (expansion/volatility). If narrower, it tags it as "Slow" (contraction/consolidation).
6. Interactive UI & Tooltips
Clean Table: All data is neatly organized in a vertical dashboard anchored to the bottom-right of the screen (fully customizable in the settings).
Hover-to-Learn: Built using Pine Script™ v6 features, every single cell in the dashboard includes an interactive tooltip. Users can simply hover their mouse over any metric (like ZOR or Velocity) to instantly read a description of what it means and how it is calculated. อินดิเคเตอร์

Exit Readiness Planner [AGPro Series]Exit Readiness Planner
🧠 Core Idea
Is the active move showing enough decay to prepare an exit review?
📌 Overview / What it does
Exit Readiness Planner is a chart-first trade management tool built to evaluate whether an active move is losing enough quality to deserve closer review. Its cleanest default use case is 4H swing-management review, where structure, target proximity, and decay are usually easier to read than on very small timeframes.
The script converts momentum decay, candle-efficiency loss, target proximity, volatility contraction, and reversal pressure into a 0-100 Exit Readiness Score. It produces an exit-pressure zone, target and risk-shift rails, exhaustion fade context, compact state labels, alerts, and a clean AGPro panel.
It does not predict price direction, automate exits, or print direct sell commands. Its purpose is to organize exit-review context while the user remains responsible for all decisions.
🎯 Purpose & Design Philosophy
Many traders plan entries carefully but review exits only after momentum has already faded. This script was built to make the exit-review question more structured.
It helps traders who manage active moves and want a cleaner way to monitor whether the move still has room, strength, and volatility support, or whether it is shifting into a review state.
The design supports a management mindset: read the current pressure, check remaining room, review exhaustion, then decide what deserves attention.
⚡ Why This Script Is Different
Most tools focus on take-profit ladders, trailing stops, or direct exit signals.
This script does NOT build a profit-target ladder, a Chandelier Exit clone, a stop-loss optimizer, or a buy/sell command system.
Instead, it asks a narrower decision question: is the active move showing enough decay, target proximity, or risk-shift pressure to prepare an exit review?
⚙️ Methodology
1. Context Detection
The script identifies the active move side using Auto Context, Long Move, or Short Move.
2. Reference Mapping
It maps target-side structure, remaining room, a fast trend reference, and an exit-pressure zone around the active target rail.
3. Reaction Evaluation
The model scores momentum decay, candle-efficiency loss, target proximity, volatility contraction, and reversal pressure.
4. Visual Output
The output appears as a forward exit-pressure zone, exhaustion fade band, compact labels, alert conditions, and a premium AGPro panel.
🗺️ How to Read the Chart
Zones = the forward exit-pressure area near the active target rail.
Labels = clear attention markers such as EXIT REVIEW, EXIT WATCH, TARGET NEAR, RISK SHIFT, or PRESSURE EASED.
Colors = teal suggests calmer monitor context, amber suggests watch or target proximity, pink/red suggests stronger exit-review pressure.
Panel = summarizes Exit Pressure, Remaining Room, Exhaustion State, Risk Shift, and Action.
🚦 Signals & States
• EXIT REVIEW → the score and supporting conditions show stronger decay or pressure.
• EXIT WATCH → review context is developing but is not yet in the stronger review state.
• TARGET NEAR → price is close to the active target-side reference.
• RISK SHIFT → pressure appeared against the active move near the trend reference.
• MONITOR → exit pressure is not strong enough for active review attention.
🔔 Alerts Logic
• Exit Readiness Review → triggers when the planner enters Exit Review state.
• Exit Readiness Watch → triggers when watch context appears.
• Target Near → triggers when price becomes close to the active target rail.
• Risk Shift → triggers when pressure appears against the active move.
• Pressure Eased → triggers when active pressure returns to monitor context.
Alerts are attention markers. They are not trade instructions.
🧩 Confluence Logic
The strongest review context appears when momentum decay, candle-efficiency loss, target proximity, volatility contraction, and reversal pressure align.
When only one factor appears, the state may remain Watch or Monitor. When several factors align, the score can move toward Exit Review.
📊 When to Use
• During active trade management.
• Especially on 4H swing-management charts.
• When price is approaching a target-side reference.
• During trend moves that may be losing momentum.
• After strong directional candles begin to compress.
• On liquid symbols where ATR and pivot references are meaningful.
⚠️ When NOT to Use
• Extremely low-liquidity markets with unreliable candles.
• News spikes where volatility changes too quickly.
• Very noisy micro-timeframes with unstable wick behavior.
• As a standalone reason to close a position.
• When the user has no broader trade plan or risk framework.
🎛️ Key Inputs
• Active Move Side → selects Auto Context, Long Move, or Short Move.
• Sensitivity → controls how quickly decay and pressure affect the score.
• Lookback → defines the structure window for target references and room.
• Exit Review Score → sets the threshold for the stronger review state.
• Exit Watch Score → sets the lower attention threshold.
• Visual Settings → control zones, rails, fade bands, labels, optional move-side prefixes, optional micro markers, panel visibility, theme, location, and font sizes.
🖥️ Interface & Visual Design
The interface is chart-first and built around one primary visual object: the exit-pressure zone.
The panel uses the AGPro publication layout with a single merged blue title row, adjustable location, adjustable theme, and adjustable font size.
Labels use clear full-text state names, offset from candles, and are controlled by cooldown and maximum-visible settings to keep the chart active without becoming crowded. Move-side prefixes and tiny micro markers are available but disabled by default for a cleaner 4H publication preset.
🧪 Practical Usage Workflow
1. Read the panel Action state.
2. Check the Exit Pressure score.
3. Review the remaining room to the active target rail.
4. Compare the exhaustion state with candle behavior.
5. Treat alerts and labels as review prompts, not trade commands.
🔍 Interpretation Guidelines
A high score means the script sees more exit-review pressure according to its rules. It does not mean price must reverse.
Target Near means remaining room is compressed relative to ATR. It does not mean the target must hold.
Risk Shift means pressure appeared against the active move. It should be interpreted with timeframe, volatility, and broader structure.
🚫 What This Script Is NOT
• Not a prediction engine.
• Not financial advice.
• Not auto trading.
• Not guaranteed signals.
• Not a sell-signal service.
• Not a take-profit ladder.
• Not a trailing-stop strategy.
⚠️ Limitations & Transparency
Exit-readiness behavior depends on the selected lookback, ATR length, target pivot length, sensitivity, timeframe, and market condition.
Low volatility can make target proximity more frequent. High volatility can widen references and delay review states. Small timeframes can produce more frequent state changes.
The script is rule-based and should be read as an analytical management layer inside a broader plan.
🧠 Market Context Notes
An active move can remain valid while still deserving review.
Exit readiness is not the same as bearish or bullish prediction. It is a structured way to notice when the move may be losing quality, nearing a reference, or showing pressure against the active side.
🧾 Use Case Examples
When price approaches the target rail and candle efficiency falls, the planner may move from Monitor to Exit Watch.
When target proximity, momentum decay, and reversal pressure align, the planner may mark Exit Review.
When pressure eases and the move regains quality, the script can return to Monitor.
🧱 System Philosophy
Exit Readiness Planner follows the AGPro decision-engine approach:
Context before reaction.
Review before emotion.
Attention markers instead of commands.
🔐 Non-Promise Statement
No indicator can guarantee continuation, reversal, target behavior, or exit timing.
This tool provides structured chart context only.
📉 Risk Disclosure
Trading involves risk.
Users are responsible for their own analysis, risk controls, position sizing, and trading decisions.
This script does not provide financial advice, investment advice, or guaranteed trading outcomes.
📚 Educational Note
Use the script to study how exit-review pressure changes as momentum fades, room compresses, volatility contracts, and pressure appears against the active move.
อินดิเคเตอร์

Bitcoin Market Regime Detector [RegimeRisk]█ WHAT THIS INDICATOR DOES
Most indicators answer "when should I buy or sell?" This one answers a different question: "what type of market am I in right now?"
Bitcoin Market Regime Detector classifies BTC into three market states:
BULL — Trend and momentum aligned to the upside. Trend-following
and breakout strategies have an edge here.
BEAR — Trend and momentum aligned to the downside. Shorts, hedging,
and risk reduction belong here.
RANGE — No dominant trend. Breakout strategies get chopped up.
Mean-reversion and range-bound setups work better.
The premise is simple: strategy selection should come after regime identification, not before. A moving average crossover strategy that prints money in a Bull regime will bleed you dry in a Range. A mean-reversion setup that works in Range will get steamrolled in a Bear. Knowing the regime first changes everything downstream.
█ HOW IT WORKS
The indicator combines four dimensions into a composite trend score:
1. Trend Direction — Fast/slow EMA crossover determines baseline bias
2. Trend Strength — ADX filters low-conviction environments
3. Momentum — RSI confirms buyer or seller control
4. Directional Index — DI+ vs DI- casts a final directional vote
Each dimension contributes to a score ranging from -2.5 (strong bearish) to +2.5 (strong bullish). The classification logic:
• ADX below threshold → Range (regardless of other signals)
• Strong positive score + RSI confirmation → Bull
• Strong negative score + RSI confirmation → Bear
• Conflicting or weak signals → Range
This layered approach prevents false regime calls during choppy, low-conviction periods where a single indicator would flip back and forth.
█ WHAT'S ON THE CHART
• Colour-coded bars — green (Bull), red (Bear), indigo (Range)
• Background shading — subtle regime colouring across the chart
• Regime change labels — flags appear when the regime shifts
• Info panel — current regime, duration in bars, and trend score
• Optional EMAs — toggle the underlying fast/slow EMAs on or off
█ ALERTS
Four alert conditions are built in:
• Regime → Bull
• Regime → Bear
• Regime → Range
• Any Regime Change
Set these through TradingView's alert menu to get notified on your phone or email when the market regime shifts.
█ SUGGESTED USE
Apply to BTCUSDT on the 4H or Daily timeframe. Use the regime as a filter for your existing strategy:
• In Bull: favour long entries, trend-following setups, breakout trades
• In Bear: favour short entries, hedging, reduced position sizes
• In Range: favour mean-reversion, avoid breakout strategies, tighten stops
The indicator works on other assets and timeframes, but the default parameters (21/55 EMA, 14-period ADX/RSI) are calibrated for BTC on higher timeframes. Adjust the inputs if applying to different instruments or lower timeframes.
█ INPUTS
Trend
• Fast EMA Length (default 21)
• Slow EMA Length (default 55)
Trend Strength
• ADX Length (default 14)
• ADX Range Threshold (default 20) — below this, market is classified as Range
Momentum
• RSI Length (default 14)
• RSI Bull Threshold (default 60)
• RSI Bear Threshold (default 40)
Display
• Background colour, regime labels, info panel, and EMAs can each be toggled independently
█ LIMITATIONS
This is a simplified regime classifier using indicators available natively in Pine Script. It does not have access to derivatives data (funding rates, open interest, liquidation flows) or cross-asset correlations that would improve classification accuracy, particularly for detecting volatility spikes and regime transitions. It is a trend/momentum-based classification tool — not a signal generator. Use it to inform your strategy selection, not as standalone buy/sell signals. อินดิเคเตอร์

Trend Entry Verifier [AITD]🎯 Trend Entry Verifier — Lock On Before You Pull The Trigger
Stop pulling the trigger when the target isn't locked.
Most traders fire on partial intel — a trendline here, an RSI hint there — and wonder why their stops keep getting hit. Trend Entry Verifier runs a 3-stage clearance check on every bar. No clearance, no shot. When all three lights turn green, you move with confidence.
🛡️ The 3-Stage Clearance Check:
Trend (HMA 13/34) — fast Hull moving averages confirm the field of engagement
Momentum (RSI) — pressure check; RSI above 50 = bulls advancing, below 50 = bears advancing
Strength (ADX + DMI) — power check; ADX above 22 means the move has real force, DI+/DI- confirms who's actually winning
✅ GO only fires when all three clear. Anything less = NO-GO. Stand down. The market has to prove itself before you risk capital.
💔 The Pain This Eliminates:
You know the feeling. You see a "clean" move, jump in, and the market immediately turns into a chop-fest that eats your stop. Or worse — the trend you trusted was actually weak, and you're holding a bag while everyone else exits.
Most losing trades aren't direction errors. They're timing errors — entering when the field hasn't been cleared. TEV refuses to let you fire on weak intel.
🎯 The Confidence This Builds:
When the ribbon flashes bright and the table says GO, you know three independent systems agreed. Not a guess. Not a gut feel. A verified clearance. You enter with conviction, hold with discipline, and exit when the system tells you the field has changed.
🪖 Mission Brief — How To Use It:
🟢 GO + BULLISH → field is clear; favor pullback entries or continuation breakouts
🔴 GO + BEARISH → field is clear; favor rejection entries or breakdown setups
⚫ NO-GO → conditions mixed, weak, or in transition; stand down or scale back
⚪ MIXED trend → trend and momentum disagree; do NOT engage, wait for alignment
🚨 The Visual Ribbon — Your Threat Indicator:
The ribbon at zero shows direction at a glance. When GO conditions clear, the ribbon brightens and thickens — your weapon is hot. When NO-GO, it dims back down. No squinting. No second-guessing. Bright = engage. Dim = stand down.
⚠️ Bonus Threat Markers:
🟧 Orange "R" triangles — RSI hit an extreme (above 70 or below 30); enemy is overextended, don't chase
🟧 Orange "B" triangles — price pierced a Bollinger Band; exhaustion zone, watch for reversal
These flag overextension so you don't engage a stretched target. Why This Hits Different:
🎯 No mystery readings — every state has a clear name and a clear job
🛡️ Conservative by design — NO-GO is the default; you earn the GO
🧹 Single-pane simplicity — one ribbon, one table, one decision per bar
📚 Educational by nature — the table teaches you what to look for, not just what to do
🚫 Built For Traders Who Are Tired Of:
Entering on "looks like a trend" only to get ambushed
Stacking 4 indicators to confirm what one should
Tools that fire during obvious chop
Indicators that look pretty but never tell you when to stay out
One ribbon. One table. One decision. Lock on or stand down.
Defaults: HMA 13/34, RSI 14, DMI 14/14, ADX minimum 22 — fully customizable.
Pairs well with VWRSI Crossovers & Extremes — TEV clears the field. VWRSI calls the shot. Use them together for a full recon → engage workflow.
🎯 Built by The AI Trading Desk. อินดิเคเตอร์

Sequential Exhaustion Tracker [AGPro Series]Sequential Exhaustion Tracker
🔷 Overview
Sequential Exhaustion Tracker is a price-action based trend maturity tool built for traders who want to read how far a directional candle sequence has developed, when that sequence is becoming late-stage, and whether the market is more likely to recycle the move or fail back through its terminal zone.
The script is not an oscillator, not a crossover tool, and not a protected-brand sequential clone. It does not depend on classic overbought or oversold thresholds. Instead, it tracks qualified directional progress bar by bar, measures the quality of the active count, opens a visual exhaustion window when the run becomes mature, and then follows the next phase as either recycle, testing, or failure.
That makes the script useful for a very specific question:
Is the current directional run still building cleanly, or has it entered the kind of late-sequence area where follow-through, failure, and reset behavior need closer attention?
🔷 What The Script Measures
The engine combines four practical components:
1. Directional candle count
The script counts qualified progress candles in the active direction. A candle must show meaningful close-to-close progress, sufficient body commitment, and optional trend-filter alignment before it can advance the count.
2. Exhaustion threshold
The count becomes mature only after it reaches the selected threshold. This avoids treating every small move as exhaustion and keeps the tool focused on developed directional sequences.
3. Exhaustion quality
The quality model blends count maturity, ATR-normalized stretch from the baseline, opposing wick absorption, and body-efficiency fade. A high reading means the sequence is not only long enough, but also showing late-run characteristics.
4. Recycle/failure lifecycle
Once a qualified exhaustion window appears, the script continues tracking price behavior. Strong continuation through the terminal zone can classify the sequence as recycled. A break back through the zone can classify it as failed. This turns the indicator into a lifecycle tracker instead of a one-bar label generator.
🔷 Visual Design
The chart output is designed to stay premium and readable:
- Compact count labels use milestone-based defaults so the chart shows sequence progress without turning into a label wall.
- ATR-based label offsets keep labels away from candle bodies.
- Exhaustion zones are drawn as rectangular terminal windows, not generic support/resistance blocks.
- Recycle and failure markers are intentionally short and selective.
- Older labels and zones are automatically removed to protect chart performance.
- The summary panel uses the AGPro standard merged blue title row and a clean four-line state readout.
🔷 Panel Readout
The panel summarizes the active condition in a compact format:
Direction
Shows whether the current qualified run is bullish, bearish, or neutral.
Count
Shows the active sequential count against the selected exhaustion threshold.
Exhaustion Quality
Shows the maturity score and the current quality band.
Recycle Status
Shows whether the sequence is building, mature, testing an exhaustion window, recycling, recycled, failed, or waiting.
🔷 How This Differs From Other AGPro Scripts
This script is intentionally separated from AGPro oscillator exhaustion tools.
Stochastic Exhaustion Map focuses on stochastic behavior, momentum fatigue, and reset context inside an oscillator framework.
Williams %R Exhaustion Map focuses on Williams %R extension behavior and release-corridor logic.
Sequential Exhaustion Tracker focuses on the visible candle sequence itself: directional progress, count maturity, terminal exhaustion zone, and post-exhaustion lifecycle behavior.
It is also different from support/resistance reaction tools because the rectangles are not structural S/R zones. They are temporary terminal sequence windows created only when a mature count and exhaustion quality condition are present.
🔷 How This Differs From Common Sequential Count Scripts
Many sequential scripts focus mainly on printing a fixed count and stopping there. Sequential Exhaustion Tracker takes a different path.
It does not simply count bars for visual decoration. It asks whether the count is supported by meaningful directional progress, whether the run has become stretched relative to its own volatility, whether the candle structure is showing absorption, and what happens after the mature sequence appears.
The key difference is the lifecycle layer:
- Building sequence
- Mature count
- Exhaustion window
- Testing window
- Recycle build
- Recycled continuation
- Failed exhaustion window
This gives the script a cleaner analytical role than a basic numbered label tool.
🔷 Suggested Use
The script is best used as a chart-context layer for:
- identifying late-stage directional runs
- separating fresh continuation from mature extension
- watching terminal sequence zones
- studying continuation recycle behavior
- spotting failed late-run pressure
- keeping sequential count context visible without overcrowding the chart
It is designed to complement market structure, trend context, volatility conditions, and the trader's broader workflow.
🔷 Default Settings
The default settings are built for a balanced public-chart presentation:
- Count threshold: 8
- Quality threshold: 62
- Trend alignment: enabled
- Count label mode: Mature Milestones
- Count label start: 6
- Minimum label spacing: 8 bars
- Exhaustion zones: enabled
- Panel: enabled
- Label and panel font sizes: Normal
These defaults aim to keep the chart informative without turning it into a noisy label wall.
🔷 Why It Was Built
Directional markets often move in phases. Early movement can be clean and efficient. Middle movement can be supported and persistent. Late movement can still continue, but the character of the candles often starts to change.
Sequential Exhaustion Tracker was built to make that progression easier to read directly on the chart. The goal is not to call every top or bottom. The goal is to show where the current sequence sits in its own lifecycle and whether the post-exhaustion behavior is confirming continuation, stalling, or failing.
That narrow focus is what makes the tool distinct: it is not a general momentum dashboard, not an oscillator map, not a support/resistance engine, and not a signal checklist. It is a dedicated sequential maturity and lifecycle tracker.
อินดิเคเตอร์

RSI Failure Swing Detector [AGPro Series]RSI Failure Swing Detector
🔹 **Overview**
RSI Failure Swing Detector is a focused RSI reversal-structure tool built around one classic momentum concept: the confirmed RSI failure swing.
Instead of treating every oversold or overbought RSI reading as a reversal condition, this script waits for the full internal RSI sequence:
1. RSI reaches an extreme zone.
2. RSI recovers or reacts away from that extreme.
3. RSI pulls back while respecting the original RSI extreme.
4. RSI breaks the internal swing level that confirms the failure swing.
Only after that sequence is complete does the script mark a confirmed trigger on the chart.
The purpose is to make RSI failure swings easier to read in real time without turning the tool into a generic divergence scanner, RSI pressure map, or broad reversal dashboard.
🔹 **What Makes It Different**
Most RSI tools focus on one of three common ideas:
- RSI overbought and oversold levels.
- RSI divergence against price.
- RSI momentum or pressure state.
This script is intentionally different.
RSI Failure Swing Detector does not look for RSI divergence. It does not compare RSI swings against price swings to create hidden or regular divergence logic. It also does not measure RSI pressure, trend pressure, or directional dominance.
Its job is narrower and cleaner:
**It detects when RSI builds a classic failure swing sequence and then confirms that sequence through an internal RSI swing break.**
That keeps the tool separated from existing AGPro momentum scripts such as RSI Pressure Map, Stochastic Exhaustion Map, Multi-Oscillator Consensus Engine, Divergence Stack Scanner, and broader reversal-quality tools. The analytical lane here is not "is pressure building?" or "is price diverging?" The lane is:
**Has RSI completed a confirmed failure swing sequence?**
🔹 **Core Logic**
The bullish model starts when RSI moves into the oversold zone. The script then tracks the first recovery leg, waits for a pullback that stays meaningfully above the original RSI low, and confirms the pattern only when RSI breaks the recovery high.
The bearish model works in the opposite direction. It starts when RSI moves into the overbought zone, tracks the first reaction leg, waits for a bounce that stays meaningfully below the original RSI high, and confirms the pattern only when RSI breaks the reaction low.
This creates a clean four-part sequence:
- Extreme
- Recovery or reaction
- Controlled pullback
- Confirmed internal break
The confirmation step is important. The script is designed to avoid printing premature reversal labels while RSI is still only sitting at an extreme.
🔹 **Trigger Pockets**
When a failure swing is confirmed, the script can project a short chart-level trigger pocket from the confirmation bar.
These pockets are not generic support or resistance zones. They are failure-swing context zones designed to help the user visually track whether price respects or loses the area around a confirmed momentum trigger.
The pocket is time-limited, ATR-scaled, and capped by a maximum visible pocket setting so the chart remains clean.
🔹 **Panel**
The AGPro panel summarizes the active environment:
- RSI State
- Swing Stage
- Confirmation
- Sequence Score
- Trigger Pocket status
The first panel row follows the AGPro standard: one merged blue header row containing only the script title. Panel location, panel theme, label size, and panel font size are all configurable from settings.
🔹 **Visual Design**
The chart layer is intentionally restrained.
Stage labels explain where the RSI sequence is developing, while confirmed trigger labels appear only after the failure swing is complete. The default stage-label mode highlights only the final setup stage before confirmation, keeping lower-timeframe charts cleaner while still preserving the sequence logic.
Label cooldowns, maximum visible label limits, ATR-based offsets, compact trigger labels, and capped trigger pockets are included to keep the chart readable.
The default visual style is designed for a premium public chart: informative, but not crowded.
🔹 **Inputs**
Key settings include:
- RSI Length
- RSI Source
- Oversold Level
- Overbought Level
- Minimum RSI Separation
- Minimum RSI Pullback
- Maximum Sequence Bars
- Confirm On Bar Close
- Stage Label Detail
- Trigger Pocket Depth
- Trigger Pocket Projection Bars
- Panel Signal Memory Bars
- Label and panel size controls
- Panel location and theme controls
These settings allow the user to tune the detector for different symbols and timeframes while preserving the core failure swing structure.
🔹 **Best Use Case**
RSI Failure Swing Detector is best used when the trader wants a clean visual framework for RSI reversal structure without adding divergence complexity or broad pressure-state interpretation.
It can be useful for reviewing moments when RSI fails to retest its prior extreme and then confirms a momentum turn through its own internal swing level.
It is designed to organize one specific RSI pattern with cleaner confirmation, better visual hierarchy, and a focused chart workflow.
อินดิเคเตอร์

อินดิเคเตอร์

Edo TRIX Core CrossEdo TRIX Core Cross — Dual TRIX Oscillator with Four-State Momentum Histogram and Cross Detection
Momentum tells you more than direction — it tells you whether a move is gaining force, holding steady or already losing energy. Most momentum readings collapse all of that into a single color-coded line. Edo TRIX Core Cross separates it into two things the trader can read at a glance: where the momentum stands, and what it is doing right now.
The indicator runs two TRIX oscillators — one fast, one slow — and plots their difference as a histogram color-coded across four states: bullish expansion, bullish fading, bearish expansion and bearish fading. An information panel shows the current bias, the momentum state and the configured lengths bar by bar. Cross markers print directly on the pane when the fast line crosses above or below the slow line.
What the indicator does
The TRIX oscillator is built on a triple exponentially smoothed moving average. Each additional smoothing pass removes progressively more short-cycle noise, leaving only the rate of change of the underlying trend. That is the core reason TRIX tends to produce fewer false signals than single or double-smoothed oscillators: most of the short-term reactivity has already been filtered out by the time the rate of change is calculated.
Edo TRIX Core Cross takes that base and adds a second layer of context. Rather than reading a single TRIX value in isolation, the indicator compares a Fast TRIX against a Slow TRIX and tracks their relationship continuously. The result is a cleaner momentum signal that still retains the ability to flag directional changes before they become obvious on price.
The two lines
Fast TRIX — default length 5. The reactive line. It responds first to changes in short-term momentum and acts as the dynamic reference of the system.
Slow TRIX — default length 9. The stabilizing line. It filters noise and represents the underlying momentum trend. Its movements are gradual and less influenced by temporary shifts in price action.
When Fast is above Slow, short-term momentum is outpacing the reference and the bias is bullish. When Fast is below Slow, short-term momentum is giving ground and the bias is bearish. The distance between the two lines tells you how strong that bias is at any given moment.
The four-state histogram
The histogram plots the difference between Fast TRIX and Slow TRIX. Most histograms in the public domain color bars using two states — green above zero, red below. Edo TRIX Core Cross uses four:
Bullish expansion (solid green) — histogram is positive and larger than the previous bar. Momentum is accelerating upward.
Bullish fading (faded green) — histogram is positive but equal to or smaller than the previous bar. Momentum is still positive but losing strength.
Bearish expansion (solid red) — histogram is negative and more negative than the previous bar. Momentum is accelerating downward.
Bearish fading (faded red) — histogram is negative but equal to or less negative than the previous bar. Downside momentum is easing.
This distinction matters because momentum does not reverse in a single bar. It decelerates, flattens, and only then turns. The faded states capture that deceleration in real time — a transition from solid to faded on the histogram is often the first visible sign that the current move is running out of fuel.
Information panel
A compact on-pane panel keeps the key readings visible bar by bar:
TRIX CROSS — header.
Bias — BULLISH when Fast is above Slow, BEARISH when Fast is below Slow. Text color matches the bias state.
Momentum — combines the histogram direction and its acceleration state into four possible readings: Expanding ▲, Fading ▼, Expanding ▼, Fading ▲. This single field mirrors the four-state histogram in text form.
Fast / Slow — the currently configured lengths for both lines.
Position and theme are configurable: four corner positions plus Dark or Light mode to match the chart background.
Cross detection
Every time Fast crosses Slow, the indicator prints a marker on the pane. A green upward triangle at the bottom marks a bullish cross; a red downward triangle at the top marks a bearish cross. The markers are explicit and easy to see without overlapping the lines themselves.
A cross should always be read in context. Its relevance depends on where the lines sit relative to the zero line at the moment of the cross, what the histogram is doing around it, and how the cross aligns with the price structure on the main chart. A bullish cross formed well below zero with both lines still in negative territory is a very different event from a bullish cross formed above zero during an ongoing expansion.
Settings
TRIX Settings — Fast Length (default 5) and Slow Length (default 9).
Display — Show Histogram, Show TRIX Lines and Show Cross Markers, each toggled independently. Fast and Slow line colors and widths, plus bull and bear cross marker colors.
Panel — Panel Position (four corners) and Panel Theme (Dark / Light).
How to read it
Start with the bias. Fast above Slow and above the zero line, with a solid-green histogram, is the cleanest bullish state the indicator produces. Fast below Slow and below zero, with a solid-red histogram, is the cleanest bearish state.
Then watch the histogram color shift between solid and faded. Solid bars mean the current move is still accelerating; faded bars mean it is slowing. Repeated faded bars after an extended expansion often precede a cross, giving advance notice that the bias may be about to flip.
Use cross markers as confirmation events rather than triggers. A bullish cross above zero with prior bullish expansion carries more weight than a bullish cross near the zero line in a directionless market. Combine the cross location, the histogram state at the cross bar and the surrounding price structure before drawing conclusions.
Alerts
Four alert conditions are included and can be configured from the standard TradingView alert dialog:
TRIX Bull Cross — Fast crosses above Slow.
TRIX Bear Cross — Fast crosses below Slow.
Histogram Crossed Zero Up — the histogram crosses above the zero line, signaling bullish pressure forming.
Histogram Crossed Zero Down — the histogram crosses below the zero line, signaling bearish pressure forming.
The zero-line alerts are independent of the cross alerts. The histogram can cross zero without Fast and Slow crossing each other, which lets the trader catch shifts in momentum pressure that have not yet produced a formal cross between the lines.
Open source
Edo TRIX Core Cross is released as an open-source indicator. The full Pine Script is publicly available on TradingView for study, adaptation and integration into any workflow. Default parameters are tuned for immediate use across multiple asset classes and timeframes.
Important
This indicator is a technical analysis tool intended for educational and informational purposes only. It does not generate automatic buy or sell signals, does not predict tops or bottoms, and is not a substitute for proper risk management or the trader's own judgment. Always use it within a broader analysis framework. อินดิเคเตอร์