อินดิเคเตอร์
Master Filter - Trend and Smart Money ZonesOverview
Master Filter combines a proprietary trend engine with the smart-money tools traders actually act on - EMA structure, Fair Value Gaps, Order Blocks and market-structure labels - in a single, clean overlay. Instead of stacking five separate indicators, you get one consistent read of where the trend is and where price is likely to react .
Everything is computed on the current chart timeframe and updates live as new bars form.
What's inside
1. The Master Filter © - trend & signals
A triple-smoothed price baseline (TEMA) is tracked against an adaptive average that follows the highs in an uptrend and the lows in a downtrend. An ATR-based channel (length 365 x multiplier, smoothed) acts as a confirmation filter that aims to suppress false flips during chop. When direction confirms, the script prints a LONG / SHORT marker on the bar. You can optionally plot the high / middle / low channel lines.
2. EMA suite + smoothed mirrors
EMA 100 / 200 / 300 / 365 for trend context, with a shaded zone between the 300 and 365 EMAs. Two optional "mirror" EMAs (a smoothed reflection of the 200 and 365) project the opposite side of price to frame mean-reversion zones.
3. Fair Value Gaps (current timeframe)
Three-bar imbalances are drawn as boxes with a dashed mid-line and tagged with the chart timeframe. Live gaps extend to the current bar and are removed automatically once price trades back through them (mitigation). A "max visible" cap keeps only the most recent gaps.
4. Order Blocks (current timeframe)
SMC-style order blocks are detected on structure breaks (price closing through the last swing high/low). The OB candle is selected within a bounded search window, with a volatility filter so an oversized, high-range bar isn't mistaken for the block. Each OB is drawn as a box plus dashed mid-line, kept per direction up to a configurable limit, and dropped on a strict break. A "max pivot age" setting skips stale blocks far from current price during strong trends.
5. Market structure - HH / HL / LH / LL
Swing pivots are labelled as Higher High / Higher Low / Lower High / Lower Low (teal for higher, orange for lower) so structure shifts are visible at a glance.
How to use
Read the trend from the LONG/SHORT markers and EMA stack; trade with it.
Use FVG and Order Block zones as areas to look for entries, partial exits or invalidation - not as automatic buy/sell signals.
Confirm with HH/HL/LH/LL: continuation favours trend-aligned zones; a structure break warns of a possible shift.
Settings
Grouped by section - Main trend (length, multiplier, channel filter, plot channel), Moving Average (EMA lengths, mirrors, smoothing), Fair Value Gaps (show, max visible, colours), Order Blocks (show, max per side, search/structure length, max pivot age, colours), and HH/HL/LH/LL (show, swing length, lookback).
Alerts
Change of the trend - fires when the Master Filter direction flips.
Notes
This indicator is a decision-support tool, not a signal-for-hire system. It does not place orders and past behaviour does not guarantee future results. Always combine it with your own risk management.
อินดิเคเตอร์

อินดิเคเตอร์
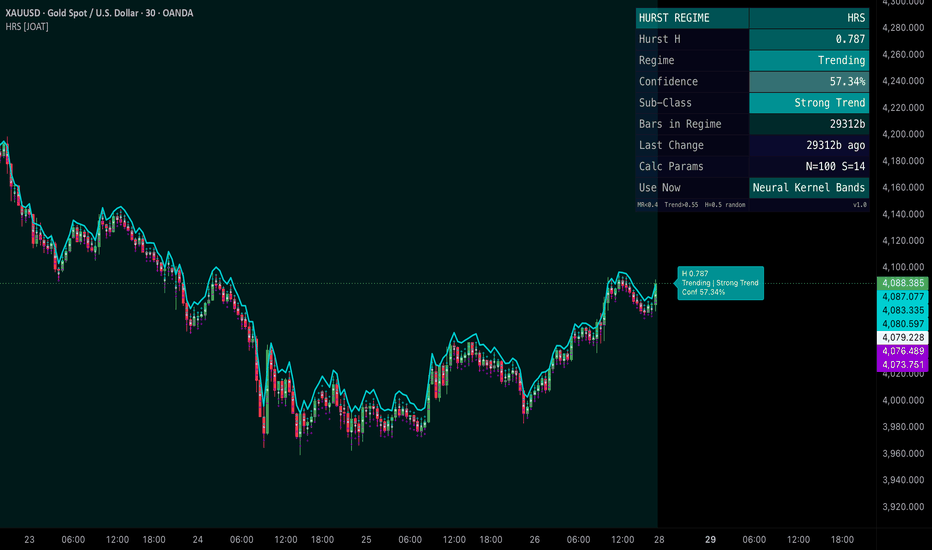
Hurst Regime Sentinel [JOAT]HURST REGIME SENTINEL
A proper R/S Hurst-exponent regime classifier — the single most respected statistical test for "is this market trending, mean-reverting, or random?". On top of the textbook R/S analysis, the Sentinel adds a five-class regime taxonomy (Strong MR, MR, Random, Trend, Strong Trend), a confirmation-bars filter to suppress flicker, a right-side floating Hurst badge, a regime-tinted background, and — uniquely — a Suggested JOAT Indicator dashboard row that names the best-fit companion script in the JOAT suite for the current regime.
The Hurst exponent, properly
The Hurst exponent H is a number between 0 and 1 that characterises the long-run persistence of a time series:
H < 0.5 — anti-persistent / mean-reverting. The series tends to reverse its recent direction.
H = 0.5 — random walk (Brownian motion). No memory.
H > 0.5 — persistent / trending. The series tends to continue its recent direction.
The classical estimator is R/S analysis (rescaled range): split the window into sub-segments, compute the range of cumulative deviations from each sub-mean, normalise by the sub-stdev, average, and fit a log-log slope. This script implements that estimator over a configurable lookback (default 100, the canonical value), with optional log-return source for theoretical correctness, and an EMA smoother on top of the raw H series to give a stable regime read.
Five-class regime taxonomy
The Sentinel does not just classify into trend/MR/random — it sub-classifies the trend and MR sides:
Strong MR — H below the strong-MR boundary (default 0.30). Severely anti-persistent. Aggressive reversion regime.
MR — H between strong-MR and the MR upper (default 0.40). Mean-reverting.
Random — H between MR upper and trend lower (default 0.55). No statistical edge from persistence assumptions.
Trend — H above trend lower. Trending.
Strong Trend — H above the strong-trend boundary (default 0.65). Strongly persistent. Aggressive momentum regime.
A Minimum-bars-to-confirm filter (default 3 bars) suppresses regime flicker; a change must persist this many bars before it is committed.
Suggested JOAT Indicator row (unique)
The dashboard exposes a Suggested Indicator row that names the best-fit companion script from the JOAT suite for the current regime. The user can pick which suggestions appear (defaults: Volatility Reversion Bands Pro for MR, Quantum Trend Matrix for Trend, Liquidity Magnet Pro for Random — but every other JOAT indicator is selectable). This converts the abstract regime read into a concrete next action: when the regime changes, the script tells you which other tool in the suite to put on the chart.
Visual system
Right-side floating label — anchored N bars to the right of the latest bar with current H value, regime, and sub-class.
Regime-change labels — drawn at the bar where a confirmed regime change occurs.
Background tint by regime — violet for MR, teal for Trend, untinted for Random. Strong sub-classes use a stronger (lower-transparency) alpha than mild sub-classes. Both alphas are configurable.
Optional Hurst line companion — when enabled, plots the H series scaled to a configurable fraction of the visible price range. Use to visually track H movement over time. Off by default for a clean chart.
Optional reference levels at 0.40 / 0.50 / 0.55 when the line is shown.
A locked Mystic palette (teal trend / violet MR / white random on a midnight-blue ground) gives the chart a distinctive structural identity.
Dashboard
Monospaced table positionable to any of nine corners. Surfaces:
Current H value (raw and smoothed).
Regime classification with glyph.
Sub-class (Strong MR / MR / Random / Trend / Strong Trend).
Bars in current regime.
Distance from H to nearest threshold.
Suggested JOAT Indicator row (toggleable).
Source series in use (Close / HL2 / HLC3 / OHLC4 / Log Returns).
Alerts
Multiple alert conditions, each independently controllable:
Regime changed to MR / Random / Trend
Sub-class changed to Strong MR / Strong Trend
H crosses 0.50 (random-walk centre)
How to read it
Three reads, in order of conviction:
Sub-class entry (Strong MR or Strong Trend) — the highest-conviction read. The market has decisively committed to a persistence regime; the suggested companion indicator becomes high-conviction.
Regime change confirmed (after the minimum-bars filter) — meaningful enough to switch toolkits. If you were trading momentum and the script now reads MR, your edge has just rotated.
H crossing 0.50 — the structural fault line. Above, persistence is positive; below, it is negative. Even without a sub-class entry, a clean cross of 0.50 is a regime warning.
Suggested settings
Defaults (lookback 100, EMA smoothing 14, MR upper 0.40, trend lower 0.55, strong boundaries 0.30 / 0.65) are tuned for daily and 4H charts on liquid markets — the timeframes where R/S analysis is statistically most meaningful. For 1H and below the indicator works but the H estimate becomes noisier; raise the EMA smoother to compensate. For very long horizons (1W+) increase lookback to 200.
Originality / what's reused
The R/S Hurst estimator is the textbook 1951 method — public-domain statistics, implemented from the original Hurst paper. The implementation here — the bounded-loop R/S computation with sub-segment averaging, the five-class regime taxonomy with strong sub-classes, the confirmation-bars regime-change filter, the regime-driven background tint with mild/strong alpha tiers, the optional scaled Hurst-line overlay, the right-side floating badge, and the suggested-JOAT-indicator dashboard row — is JOAT-original. No third-party code reused.
Open source
Published open-source under the default Mozilla Public License 2.0. The R/S loop, the regime classifier, the suggested-indicator router, and the dashboard are isolated modules. Forks welcome with credit.
Limitations
Hurst R/S is statistical — it describes the recent past, it does not predict the future. The estimator carries the natural noise of finite-sample R/S; the EMA smoother is there to suppress flicker but cannot eliminate underlying noise on short lookbacks. The "Suggested JOAT Indicator" row is a heuristic mapping from regime to tool, not a prediction that any specific signal from that tool will fire — it tells you which corner of the toolkit to look at; the tool itself tells you when to act.
—
-made with passion by jackofalltrades
อินดิเคเตอร์
ATR Multi Time Frame DisplayAn updated version to the simple ATR display. This updated version now give you an option to toggle on the 1 min ATR no matter what time frame you swap to. This also has an option to choose between RMA, SMA, EMA, or WMA. The smoothing method averages those True Range values over your chosen length, like 14 candles.
RMA
This is TradingView’s default ATR style and the classic Wilder ATR. It reacts smoothly without being too jumpy. If you’re unsure, start here. Good for general trading, stops, and position sizing.
SMA
Simple average. Every candle in the lookback has equal weight. It can feel a bit clunky because old high-volatility candles stay in the average until they suddenly drop off. Useful if you want a very plain “last 14 bars average range” reading.
EMA
More weight on recent candles, so it reacts faster when volatility expands or contracts. Good if you scalp, trade breakouts, or want stops/targets to adjust quickly. Downside: it can get jumpier.
WMA
Also weights recent candles more, often even more directly than EMA over the lookback. It can be responsive and clean, but may be too sensitive for some traders.
RMA is the best default because it’s the standard ATR most traders expect. If you find it lags too much on the 1-minute ATR, try EMA next. อินดิเคเตอร์

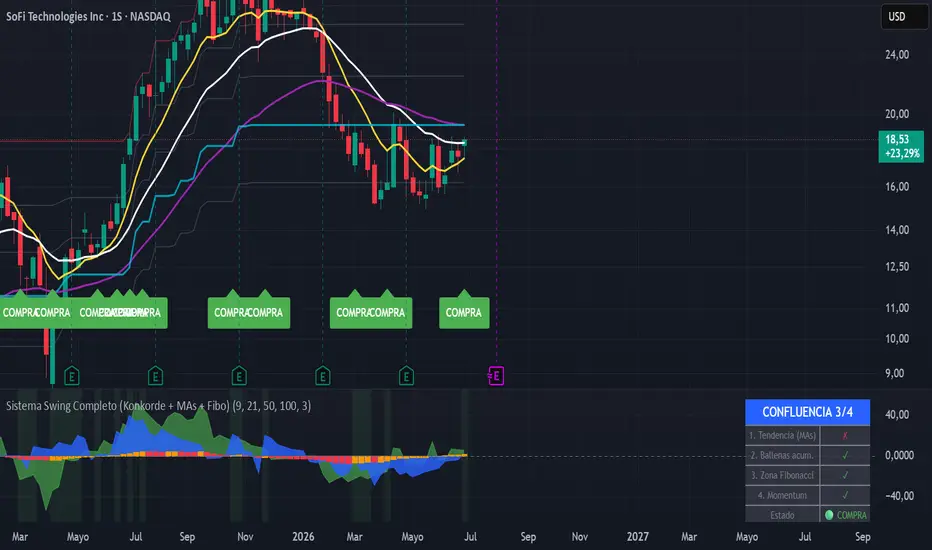
Sistema Swing Completo (Konkorde + MAs + Fibo)// This source code is subject to the terms of the Mozilla Public License 2.0
//@version=6
indicator("Sistema Swing Completo (Konkorde + MAs + Fibo)", overlay=false)
// =====================================================================
// 1. KONCORDE (VOLUMEN DE BALLENAS VS MINORISTAS)
// =====================================================================
// Cálculo de PVI (Minoristas) y NVI (Ballenas)
var float pvi = 1000.0
var float nvi = 1000.0
if bar_index > 0
pvi := volume > volume ? pvi + ((close - close ) / close ) * pvi : pvi
nvi := volume < volume ? nvi + ((close - close ) / close ) * nvi : nvi
// Oscilación de Minoristas (Manos Débiles)
pvim = ta.ema(pvi, 15)
pvimax = ta.highest(pvim, 90)
pvimin = ta.lowest(pvim, 90)
minoristas = (pvi - pvim) * 100 / math.max(pvimax - pvimin, 1)
// Oscilación de Ballenas (Manos Fuertes)
nvim = ta.ema(nvi, 15)
nvimax = ta.highest(nvim, 90)
nvimin = ta.lowest(nvim, 90)
ballenas = (nvi - nvim) * 100 / math.max(nvimax - nvimin, 1)
plot(minoristas, color=color.new(color.green, 40), style=plot.style_area, title="Volumen Minorista (Verde)")
plot(ballenas, color=color.new(color.blue, 20), style=plot.style_area, title="Volumen Ballenas (Azul)")
// =====================================================================
// 2. INDICADOR DE MOMENTUM (MACD)
// =====================================================================
= ta.macd(close, 12, 26, 9)
escala_momentum = 5 // Multiplicador para igualar la escala del Konkorde visualmente
color_hist = hist > hist ? color.new(color.orange, 0) : color.new(color.red, 0)
plot(hist * escala_momentum, color=color_hist, style=plot.style_columns, title="Momentum (Columnas)")
hline(0, color=color.gray, linestyle=hline.style_dashed)
// =====================================================================
// 3. MEDIAS MÓVILES CONFIGURABLES (Proyectadas al gráfico superior)
// =====================================================================
len1 = input.int(9, title="Longitud EMA 1")
len2 = input.int(21, title="Longitud EMA 2")
len3 = input.int(50, title="Longitud EMA 3")
ema1 = ta.ema(close, len1)
ema2 = ta.ema(close, len2)
ema3 = ta.ema(close, len3)
// El uso de force_overlay=true envía estas líneas a las velas japonesas
plot(ema1, color=color.new(color.yellow, 0), linewidth=2, title="EMA Rápida", force_overlay=true)
plot(ema2, color=color.new(color.white, 0), linewidth=2, title="EMA Media", force_overlay=true)
plot(ema3, color=color.new(color.purple, 0), linewidth=2, title="EMA Lenta", force_overlay=true)
// =====================================================================
// 4. RETROCESO DE FIBONACCI (Proyectado al gráfico superior)
// =====================================================================
fibo_lookback = input.int(100, title="Periodo para Fibonacci")
hh = ta.highest(high, fibo_lookback)
ll = ta.lowest(low, fibo_lookback)
diff = hh - ll
plot(hh, color=color.new(color.red, 50), title="100% (Máximo)", force_overlay=true)
plot(hh - diff * 0.236, color=color.new(color.gray, 60), title="76.4%", force_overlay=true)
plot(hh - diff * 0.382, color=color.new(color.gray, 60), title="61.8%", force_overlay=true)
plot(hh - diff * 0.500, color=color.new(color.aqua, 20), linewidth=2, title="50.0% (Equilibrio)", force_overlay=true)
plot(hh - diff * 0.618, color=color.new(color.gray, 60), title="38.2%", force_overlay=true)
plot(ll, color=color.new(color.green, 50), title="0% (Mínimo)", force_overlay=true) อินดิเคเตอร์

อินดิเคเตอร์

MACD Momentum Entry Engine [trade_w_samet]🎯 MACD Momentum Entry Engine
MACD Momentum Entry Engine is a structured momentum-analysis and visual trade-model indicator designed to help traders study confirmed MACD events, momentum quality, directional persistence, market regime, trend alignment, candle confirmation, and multi-target risk references directly from one coordinated workflow.
The script is built around one central idea:
A MACD event should not automatically become an entry signal.
Instead of treating every MACD crossover as equally meaningful, the engine first identifies the type of momentum event, then evaluates its strength, expansion, slope, acceleration, market environment, candle quality, directional persistence, and optional trend alignment before a permanent LONG or SHORT setup is accepted.
The indicator includes:
• Configurable MACD fast, slow, and signal lengths
• EMA, SMA, RMA, and WMA calculation options
• Early Trigger and Momentum Confirmed entry timing
• Reversal, Continuation, Zero-Line Reclaim, and Momentum Expansion setups
• A transparent 0–100 Momentum Quality Score
• Alignment, histogram strength, expansion, slope, and acceleration scoring
• Loose, Balanced, Strict, and Off quality modes
• A separate 0–100 Anti-Chop Market Regime Score
• ADX, price efficiency, EMA separation, and volatility-expansion analysis
• A separate 0–100 Entry Qualification Score
• Candle body, close location, MACD separation, persistence, impulse, and trigger-context analysis
• A final composite setup score
• A+, A, B, and C internal setup grades
• Optional chart EMA, confirmed higher-timeframe EMA, and combined trend bias
• Confirmed higher-timeframe calculations
• Zero-line directional filtering
• ATR-normalized absolute histogram-strength filtering
• Internal signal cooldown and same-bar re-entry protection
• One-active-trade-at-a-time visual management
• ATR-based and XAUUSD fixed-pip risk models
• Three visual take-profit levels
• Stop First and Targets First same-bar assumptions
• Equal-third internal trade-model accounting
• Active Entry, TP1, TP2, TP3, and SL lines
• Active reward and risk boxes on the main chart
• TP3-only historical trade-model preservation
• Separate SL, Closed TP1, Closed TP2, and TP3 result labels
• Adjustable LONG, SHORT, and result-label sizes
• MACD histogram, line, signal line, momentum background, and anti-chop background
• Neon LONG and SHORT dots directly on the MACD line
• A compact main-chart dashboard
• XAUUSD symbol verification and mismatch warning
• Static TradingView alert conditions
• Detailed dynamic alert() messages
• Data Window diagnostics
• Confirmed-close permanent signals
The purpose of this script is to provide a structured way to study when a MACD event is supported by broader momentum and market context.
It is not financial advice.
It is not an automated trading system.
It does not guarantee profitable trades.
It does not execute broker orders.
It does not replace personal analysis, position sizing, or risk management.
━━━━━━━━━━━━━━━━━━━━━━
📌 OVERVIEW
━━━━━━━━━━━━━━━━━━━━━━
At a high level, MACD Momentum Entry Engine does the following:
• Calculates a configurable MACD using the selected average types.
• Separates the visual histogram scale from the calculation scale.
• Detects confirmed MACD crossovers and zero-line events.
• Identifies Reversal, Continuation, Zero-Line Reclaim, and Expansion setup types.
• Optionally accepts the event immediately through Early Trigger mode.
• Optionally arms the setup and waits for renewed momentum through Momentum Confirmed mode.
• Measures momentum alignment, histogram strength, histogram expansion, MACD slope, and acceleration.
• Produces separate bullish and bearish 0–100 Momentum Quality Scores.
• Measures market regime using ADX, directional efficiency, EMA separation, and volatility expansion.
• Produces a separate 0–100 Market Regime Score.
• Evaluates candle direction, body quality, close location, MACD separation, persistence, and price impulse.
• Produces separate bullish and bearish Entry Qualification Scores.
• Combines momentum, regime, and entry quality into a final composite score.
• Assigns an internal A+, A, B, or C grade.
• Applies optional chart EMA and confirmed higher-timeframe EMA bias.
• Applies zero-line, absolute-strength, cooldown, and trade-slot controls.
• Confirms permanent LONG and SHORT signals only after candle close.
• Opens one visual trade model from the confirmed signal-bar close.
• Calculates Entry, Stop Loss, TP1, TP2, and TP3.
• Tracks targets and stop events from the next candle onward.
• Applies the selected same-bar processing assumption.
• Preserves completed TP3 models when historical display is enabled.
• Removes trade drawings after SL, Closed TP1, or Closed TP2 outcomes.
• Converts the original entry label into the final result for non-TP3 outcomes.
• Adds a separate electric-purple FULL TARGET label for TP3 outcomes.
• Displays Momentum, Trend, Regime, Trade, Last Result, and Protection states in the bottom-right dashboard.
• Provides static and dynamic alert options.
• Exposes diagnostic values through TradingView’s Data Window.
The indicator does not use machine-learning prediction.
Its scores are not probabilities.
Its labels do not promise future direction.
The script is a rule-based educational momentum framework that explains how a raw MACD event becomes an accepted or rejected setup.
━━━━━━━━━━━━━━━━━━━━━━
🧠 CORE IDEA
━━━━━━━━━━━━━━━━━━━━━━
The core idea behind MACD Momentum Entry Engine is that a crossover alone contains limited context.
A basic crossover only confirms that one MACD line has moved through another.
It does not automatically explain:
• whether the histogram is expanding
• whether momentum is accelerating
• whether the move is occurring in a directional or choppy market
• whether the signal candle supports the direction
• whether MACD separation is meaningful relative to recent behavior
• whether momentum has persisted
• whether price is aligned with an optional trend filter
• whether a recent signal already occurred
• whether a visual trade model is already active
The engine therefore uses a staged sequence:
MACD event
→ setup classification
→ momentum-quality scoring
→ optional trend-bias validation
→ anti-chop regime scoring
→ entry qualification
→ additional signal filters
→ confirmed signal
→ visual trade model
→ TP / SL lifecycle
→ result handling
For bullish conditions, the script studies upward MACD transitions, positive histogram alignment, renewed expansion, positive slope, positive acceleration, bullish candle behavior, and directional persistence.
For bearish conditions, the same process is mirrored.
The purpose is not to find the largest possible number of signals.
The purpose is to make the acceptance process visible, configurable, and understandable.
━━━━━━━━━━━━━━━━━━━━━━
🧩 WHY THIS SCRIPT IS NOT A SIMPLE BUY/SELL INDICATOR
━━━━━━━━━━━━━━━━━━━━━━
MACD Momentum Entry Engine is not designed to be used as a blind buy/sell system.
A raw MACD event must move through multiple stages:
A crossover or momentum event appears
→ the event is classified
→ the momentum-quality layer is evaluated
→ the trend-bias layer is evaluated
→ the anti-chop layer is evaluated
→ the candle and entry-quality layer is evaluated
→ zero-line and absolute-strength filters are checked
→ cooldown and active-trade restrictions are checked
→ the setup must remain valid at candle close
→ a permanent LONG or SHORT setup is printed
→ Entry, SL, TP1, TP2, and TP3 are projected
→ the trade model is monitored from the following candle
→ the model closes at TP3 or Stop
→ the final chart result is preserved or cleaned
Each module serves a different purpose.
The MACD core defines the momentum relationship.
The setup engine identifies what kind of event occurred.
The momentum-quality engine measures the internal strength of that event.
The anti-chop engine measures whether the broader environment is directional enough for the selected mode.
The entry-qualification engine evaluates the signal candle and immediate price response.
The trend-bias engine optionally restricts direction.
The trade engine standardizes the visual risk framework.
The dashboard explains the current engine state.
This makes the script a coordinated momentum-analysis workflow rather than a basic crossover marker.
━━━━━━━━━━━━━━━━━━━━━━
⚙️ HOW THE SCRIPT WORKS
━━━━━━━━━━━━━━━━━━━━━━
The script operates through connected calculation stages.
First, it calculates every supported moving-average type on every candle.
The selected average type is then used for the fast MACD average, slow MACD average, and signal average.
The MACD line is the difference between the selected fast and slow averages.
The histogram is the difference between the MACD line and the signal line.
fastAverage = f_selectMa(macdMaType, fastEma, fastSma, fastRma, fastWma)
slowAverage = f_selectMa(macdMaType, slowEma, slowSma, slowRma, slowWma)
macdLine = fastAverage - slowAverage
signalLine = f_selectMa(signalMaType, signalEma, signalSma, signalRma, signalWma)
histogram = macdLine - signalLine
The histogram visual multiplier changes only the displayed column length.
It does not change:
• the MACD line
• the signal line
• the histogram used by calculations
• quality scores
• setup detection
• trade results
After the MACD core is calculated, the engine measures:
• absolute histogram strength
• one-bar histogram expansion
• MACD slope
• momentum acceleration
• adaptive baselines for each measurement
The setup engine then checks the enabled event types.
The quality, trend, regime, qualification, and additional-filter stages determine whether the setup is eligible.
A final permanent signal is accepted only after the candle closes and every enabled condition remains valid.
━━━━━━━━━━━━━━━━━━━━━━
🟢 BULLISH MACD MOMENTUM LOGIC
━━━━━━━━━━━━━━━━━━━━━━
A bullish setup begins with one of four enabled event types.
Bullish Reversal
A bullish MACD crossover occurs while the MACD line remains below zero.
This represents a momentum turn from the negative side of the zero line.
Bullish Continuation
A bullish MACD crossover occurs while the MACD line is at or above zero.
This represents renewed bullish alignment on the positive side.
Bullish Zero-Line Reclaim
The MACD line crosses above zero while:
• MACD is above the signal line
• the histogram is positive
• the bar is confirmed
Bullish Momentum Expansion
The histogram resumes positive expansion after a short contraction while:
• MACD remains above the signal line
• MACD slope is positive
• no new crossover is being used on the same bar
• no new zero-line cross is being used on the same bar
The event must then pass the active momentum-quality requirement.
When enabled, it must also pass:
• chart EMA bias
• confirmed higher-timeframe EMA bias
• EMA slope confirmation
• ATR distance from the trend EMA
• anti-chop regime requirement
• entry qualification
• bullish candle direction
• minimum MACD separation
• momentum persistence
• zero-line direction
• absolute histogram strength
• cooldown
• active-trade availability
The final signal uses confirmed-bar logic.
bullishSignal =
barstate.isconfirmed and
bullishEntryCandidate and
bullishZeroLinePass and
absoluteStrengthPass and
bullishQualityPass and
bullishTrendPass and
antiChopPass and
bullishQualificationPass and
bullishCandlePass and
separationPass and
bullishPersistencePass and
cooldownPass and
tradeSlotAvailable
When every active rule passes, the script can display:
• a neon green dot on the MACD line
• a LONG label on the main chart
• setup type, grade, and score information
• a visual Entry, SL, TP1, TP2, and TP3 model
This confirms that the configured bullish momentum conditions were valid at candle close.
It does not mean price must continue upward.
━━━━━━━━━━━━━━━━━━━━━━
🔴 BEARISH MACD MOMENTUM LOGIC
━━━━━━━━━━━━━━━━━━━━━━
A bearish setup mirrors the bullish process.
Bearish Reversal
A bearish MACD crossover occurs while the MACD line remains above zero.
This represents a momentum turn from the positive side of the zero line.
Bearish Continuation
A bearish MACD crossover occurs while the MACD line is at or below zero.
This represents renewed bearish alignment on the negative side.
Bearish Zero-Line Reclaim
The MACD line crosses below zero while:
• MACD is below the signal line
• the histogram is negative
• the bar is confirmed
Bearish Momentum Expansion
The histogram resumes negative expansion after a short contraction while:
• MACD remains below the signal line
• MACD slope is negative
• no new bearish crossover is being used on the same bar
• no new bearish zero-line cross is being used on the same bar
The setup must then pass the same quality, trend, regime, candle, separation, persistence, strength, cooldown, and trade-slot controls.
A permanent SHORT signal appears only when all active conditions remain valid at candle close.
The script can then display:
• a neon red dot on the MACD line
• a SHORT label on the main chart
• setup type, grade, and score information
• Entry, SL, TP1, TP2, and TP3 references
This confirms that the configured bearish momentum conditions were valid at candle close.
It does not guarantee continued downside movement.
━━━━━━━━━━━━━━━━━━━━━━
💎 MACD MOMENTUM QUALITY FILTER SYSTEM
━━━━━━━━━━━━━━━━━━━━━━
The script includes a separate bullish and bearish Momentum Quality Score.
The quality layer evaluates five components.
Alignment — maximum 20 points
Bullish alignment requires:
• MACD above the signal line
• positive histogram
Bearish alignment requires:
• MACD below the signal line
• negative histogram
Histogram Strength — maximum 25 points
The absolute histogram value is compared with an adaptive EMA baseline.
This measures whether current separation is meaningful relative to recent MACD behavior.
Histogram Expansion — maximum 20 points
The engine measures the one-bar change in absolute histogram strength.
Points are awarded only when the histogram is expanding in the setup direction.
MACD Slope — maximum 20 points
Bullish setups require positive slope for this component.
Bearish setups require negative slope.
The slope magnitude is compared with its own adaptive baseline.
Momentum Acceleration — maximum 15 points
Acceleration measures the change in MACD slope.
Positive acceleration supports bullish scoring.
Negative acceleration supports bearish scoring.
bullishQualityScore = f_clamp(
bullishAlignmentScore +
bullishHistogramStrengthScore +
bullishExpansionScore +
bullishSlopeScore +
bullishAccelerationScore,
0.0,
100.0
The available quality modes are:
Off
Removes the minimum Momentum Quality Score restriction.
Loose
Requires a minimum score of 45.
Balanced
Requires a minimum score of 60.
Strict
Requires a minimum score of 75 and is the default.
The score is not a win rate.
It is not a probability.
It measures how closely the current MACD event matches the engine’s momentum-strength framework.
━━━━━━━━━━━━━━━━━━━━━━
📏 VOLATILITY / ATR NORMALIZATION FILTER
━━━━━━━━━━━━━━━━━━━━━━
The indicator uses ATR normalization to compare certain values across changing volatility conditions.
The Absolute Strength Filter calculates:
Absolute Histogram Strength = |Histogram| / ATR × 100.
This value is used as an additional minimum-strength condition.
The default settings are:
• Normalization ATR Length: 14
• Minimum Absolute Strength: 1.0
• Use Absolute Strength Filter: enabled
ATR normalization helps reduce dependence on the raw numerical scale of a market.
For example, a raw MACD histogram value cannot be compared directly across instruments with very different prices and volatility.
Normalization places the histogram in relation to the instrument’s recent ATR.
The same ATR framework is also used by:
• optional price-to-EMA trend buffers
• EMA-separation regime measurement
• price-impulse scoring
• ATR-based trade management
ATR normalization does not make one configuration universal.
Symbols, sessions, exchanges, and data feeds can still behave differently.
━━━━━━━━━━━━━━━━━━━━━━
🕯️ DISPLACEMENT QUALITY FILTER
━━━━━━━━━━━━━━━━━━━━━━
The entry-qualification engine evaluates whether the signal candle shows enough directional response.
The Candle component contributes up to 25 points.
It is divided into:
Directional Body — maximum 12.5 points
For bullish setups, the engine measures the positive candle body relative to the full candle range.
For bearish setups, it measures the negative body.
Close Location — maximum 12.5 points
Bullish setups receive more points when the close is nearer the candle high.
Bearish setups receive more points when the close is nearer the candle low.
Price Impulse contributes up to 15 additional points.
The engine compares the one-bar directional price movement with ATR.
A bullish price impulse measures positive close-to-close displacement.
A bearish price impulse measures negative close-to-close displacement.
This layer does not predict the next candle.
It measures whether the completed signal candle supports the direction of the MACD event.
━━━━━━━━━━━━━━━━━━━━━━
📊 REACTION STRENGTH FILTER
━━━━━━━━━━━━━━━━━━━━━━
The engine includes a separate Entry Qualification Score.
Its components are:
Candle Quality — maximum 25 points
Combines directional body and close location.
MACD Separation — maximum 25 points
Measures current histogram separation relative to its adaptive baseline.
Momentum Persistence — maximum 20 points
Measures how long directional MACD and histogram alignment has remained active.
Price Impulse — maximum 15 points
Measures directional close-to-close movement relative to ATR.
Trigger Context — maximum 15 points
Confirms that an eligible setup event is currently active.
The total is limited to 0–100.
Available modes are:
Off
Removes the minimum Entry Qualification Score restriction.
Loose
Requires a minimum score of 45.
Balanced
Requires a minimum score of 60.
Strict
Requires a minimum score of 75 and is the default.
The final signal also uses internal candle-direction, separation, and persistence requirements.
These internal parameters remain active in the background to keep the public settings menu cleaner.
The Entry Qualification Score is not a verified accuracy figure.
It describes the quality of the completed entry context according to the script’s rules.
━━━━━━━━━━━━━━━━━━━━━━
🧼 CONFIRMED SIGNAL FILTER
━━━━━━━━━━━━━━━━━━━━━━
Permanent LONG and SHORT signals wait for candle close.
The engine uses confirmed-bar checks on:
• MACD crossovers
• zero-line crossings
• expansion triggers
• momentum confirmation
• final LONG and SHORT conditions
The higher-timeframe trend layer also uses previous completed higher-timeframe values.
htfConfirmedClose = request.security(
syminfo.tickerid,
higherTimeframe,
close ,
gaps = barmerge.gaps_off,
lookahead = barmerge.lookahead_on
)
htfConfirmedEma = request.security(
syminfo.tickerid,
higherTimeframe,
ta.ema(close, trendLength) ,
gaps = barmerge.gaps_off,
lookahead = barmerge.lookahead_on
)
This approach prevents an unfinished higher-timeframe candle from becoming the permanent trend reference.
Entry Timing provides two workflows.
Early Trigger
Uses the confirmed setup event directly.
Momentum Confirmed
Arms the setup and waits for a later confirmed candle with:
• continued MACD alignment
• directional histogram
• renewed histogram expansion
• directional MACD slope
The confirmation opportunity is temporary.
If renewed momentum does not appear inside the internal window, the armed setup expires.
The script does not plot final signals into earlier candles.
Historical results can still change when:
• settings change
• symbol data changes
• timeframe changes
• the data provider revises history
• the available chart-history range changes
━━━━━━━━━━━━━━━━━━━━━━
🎯 ENTRY MODEL
━━━━━━━━━━━━━━━━━━━━━━
When a final LONG or SHORT setup passes every enabled condition, the trade engine can create a visual trade model.
The Entry reference is the close of the confirmed signal candle.
For a LONG model:
• Stop is below Entry
• TP1 is above Entry
• TP2 is above TP1
• TP3 is above TP2
For a SHORT model:
• Stop is above Entry
• TP1 is below Entry
• TP2 is below TP1
• TP3 is below TP2
tradeEntryPrice := close
tradeStopPrice := tradeEntryPrice - selectedStopDistance
tradeTp1Price := tradeEntryPrice + selectedTp1Distance
tradeTp2Price := tradeEntryPrice + selectedTp2Distance
tradeTp3Price := tradeEntryPrice + selectedTp3Distance
The model begins checking TP and SL from the following candle.
This prevents the signal candle’s earlier high or low from being treated as though it occurred after the close-based entry.
The engine stores:
• direction
• entry bar
• entry price
• stop price
• TP1 price
• TP2 price
• TP3 price
• initial risk
• target R values
• TP1 and TP2 progress
• setup type
• setup grade
• risk model
• original signal label
The displayed model is an educational chart reference.
It is not a broker order.
━━━━━━━━━━━━━━━━━━━━━━
🛑 ATR STOP-LOSS MODEL
━━━━━━━━━━━━━━━━━━━━━━
The indicator includes two risk models.
ATR Based
Stop distance is calculated as:
ATR × ATR Stop Multiplier.
The default settings are:
• ATR Length: 14
• ATR Stop Multiplier: 1.50
• TP1: 0.50R
• TP2: 1.00R
• TP3: 1.50R
The minimum distance is protected by the symbol’s minimum tick.
XAUUSD Fixed Pips
Stop and target distances use:
Selected Pips × XAUUSD Pip Size.
The default settings are:
• Pip Size: 0.01
• Stop Loss: 1000 pips
• TP1: 500 pips
• TP2: 1000 pips
• TP3: 1500 pips
Under the common 0.01 convention, those values correspond to:
• Stop distance: 10.00 price units
• TP1 distance: 5.00 price units
• TP2 distance: 10.00 price units
• TP3 distance: 15.00 price units
Broker conventions can differ.
Users should verify their symbol specification before relying on fixed-pip distances.
The XAUUSD protection system checks the symbol.
The dashboard shows:
• ✅ XAUUSD VERIFIED when XAUUSD Fixed Pips is used on a recognized XAUUSD symbol
• ⚠️ CHECK SYMBOL when the mode is used on another symbol
• 🛡️ ATR MODE when ATR Based is selected
The warning does not block calculations.
It tells the user to verify pip size and target distances.
━━━━━━━━━━━━━━━━━━━━━━
🎯 TAKE-PROFIT RR MODEL
━━━━━━━━━━━━━━━━━━━━━━
The visual model contains three take-profit levels.
ATR Based mode calculates targets from the initial stop distance:
TP1 Distance = Initial Risk × TP1 RR.
TP2 Distance = Initial Risk × TP2 RR.
TP3 Distance = Initial Risk × TP3 RR.
XAUUSD Fixed Pips mode uses independent fixed target distances.
The script enforces the following order:
TP1 < TP2 < TP3.
If a selected value would violate that order, the next target is moved at least one minimum tick beyond the prior target.
The trade model internally treats the position as three equal portions.
Each target represents one-third of the model.
If Stop is reached after TP1 or TP2, the script calculates an internal net-R result from:
• the portions already modeled as closed at reached targets
• the remaining portion or portions modeled at Stop
This internal calculation supports Data Window counters.
It is not broker-verified performance.
It does not account for:
• spread
• commission
• slippage
• latency
• partial-fill differences
• financing
• order rejection
• execution venue behavior
━━━━━━━━━━━━━━━━━━━━━━
📦 ACTIVE TP / SL BOX SYSTEM
━━━━━━━━━━━━━━━━━━━━━━
When a confirmed trade model opens, the script can draw on the main chart:
• Entry line
• TP1 line
• TP2 line
• TP3 line
• Stop Loss line
• TP1 reward box
• TP2 reward box
• TP3 reward box
• SL risk box
• LONG or SHORT label
The Entry line is white.
The TP lines are green and initially dashed.
The SL line is red and solid.
The SL box uses a solid border.
When a target is reached:
• the corresponding box becomes more visible
• the corresponding target line becomes solid
• the target line becomes thicker
• the dynamic target alert can fire
When TP3 is reached:
• the complete model closes
• the original LONG or SHORT label remains
• a separate electric-purple TP3 FULL TARGET label appears
• the trade model can remain historically visible
When the model closes at Stop before TP3:
• all active boxes are deleted
• all active trade lines are deleted
• the original LONG or SHORT label is converted into the final result
• the final result becomes SL, CLOSED TP1, or CLOSED TP2
Only TP3 outcomes can retain completed historical boxes and lines.
This is a chart-cleanliness decision.
It does not imply that other outcomes did not occur.
━━━━━━━━━━━━━━━━━━━━━━
🚦 ONE ACTIVE TRADE AT A TIME
━━━━━━━━━━━━━━━━━━━━━━
The script uses one-active-trade-at-a-time visual management.
When the trade engine is enabled:
• a new trade model cannot open while another model is active
• a new trade cannot open on the same candle that closed the previous model
• the internal setup engine continues calculating
• permanent signals are restricted by trade-slot availability
This prevents overlapping Entry, TP, and SL structures.
It also keeps the trade lifecycle easier to interpret.
When the trade engine is disabled, qualified signals can still be evaluated without opening a visual trade model.
The one-active-model rule is a visual and analytical design choice.
It does not restrict the user’s personal trading activity.
━━━━━━━━━━━━━━━━━━━━━━
⚠️ SAME-CANDLE TP / SL HANDLING
━━━━━━━━━━━━━━━━━━━━━━
Trade monitoring begins after the entry candle.
If a later historical candle touches both Stop and one or more targets, standard OHLC data does not reveal the exact intrabar sequence.
The indicator therefore provides two assumptions.
Stop First
If Stop and a target are both touched on the same candle, Stop is processed first.
This is the default and more conservative assumption.
Targets First
Reached targets are processed before Stop.
If TP3 is reached, the model closes at TP3.
Otherwise, remaining portions can close at Stop.
Neither mode reconstructs tick-level execution.
The indicator does not know:
• whether the high occurred before the low
• the bid/ask path
• actual fill sequence
• spread at the time
• slippage
• queue priority
• partial fills
The selected same-bar rule is a modeling assumption required by the limits of OHLC candles.
━━━━━━━━━━━━━━━━━━━━━━
🏷️ MACD MOMENTUM LABELS
━━━━━━━━━━━━━━━━━━━━━━
The indicator uses separate entry and result labels.
Entry labels display:
🚀 LONG
or:
🔴 SHORT
Entry Label Content provides:
Direction Only
Displays only LONG or SHORT.
Grade
Displays direction and setup grade.
Score + Grade
Displays direction, grade, and rounded composite score.
The default is Score + Grade.
LONG and SHORT label sizes can be adjusted independently.
Both default to Small.
The label tooltip contains:
• setup direction
• setup type
• setup grade
• composite score
• Momentum Quality Score
• Entry Qualification Score
• Market Regime Score
• trend-bias state
Result labels include:
🛑 SL
⚠️ CLOSED TP1
✅ CLOSED TP2
🏆 TP3 HIT
✅ FULL TARGET
SL, Closed TP1, and Closed TP2 transform the original entry label.
TP3 creates a separate result label and preserves the original entry label.
All chart-label text uses bold and italic formatting.
━━━━━━━━━━━━━━━━━━━━━━
📍 MACD DISPLAY MODES
━━━━━━━━━━━━━━━━━━━━━━
The indicator operates in a separate MACD pane while selected trade visuals, entry labels, and the dashboard are forced onto the main price chart.
The MACD pane can display:
MACD Line
A white line representing the difference between the selected fast and slow averages.
Signal Line
A red line representing the selected signal smoothing.
Histogram
Color changes communicate momentum condition:
• stronger green for bullish expansion
• softer green for bullish contraction
• stronger red for bearish expansion
• softer red for bearish contraction
Histogram Visual Length
The default multiplier is 1.60.
This changes visual column length only.
It does not affect calculations.
Neon Signal Dots
Qualified LONG setups produce a neon green glow and center dot on the MACD line.
Qualified SHORT setups produce a neon red glow and center dot.
Momentum Background
The pane background changes according to strong or weak bullish and bearish momentum states.
Anti-Chop Background
A neutral gray background can identify conditions blocked by the Anti-Chop Engine.
Each major visual element can be shown or hidden independently.
━━━━━━━━━━━━━━━━━━━━━━
🧹 SETUP INVALIDATION
━━━━━━━━━━━━━━━━━━━━━━
Not every raw MACD event remains eligible.
A setup can be rejected or expire because:
• its momentum score is below the selected threshold
• trend bias does not permit the direction
• the market regime is below the active Anti-Chop threshold
• the Entry Qualification Score is insufficient
• candle direction does not support the setup
• MACD separation is insufficient
• directional persistence is insufficient
• the zero-line filter blocks the direction
• normalized histogram strength is too low
• the signal cooldown is active
• another visual trade is active
• a trade closed on the current candle
• Momentum Confirmed mode does not receive renewed expansion in time
• an opposite raw setup replaces the armed direction
The internal cooldown is eight bars.
Momentum Confirmed mode uses a temporary internal confirmation window.
These background controls are intentionally not exposed as advanced public inputs.
They remain part of the engine’s consistency rules.
A rejected event is not displayed as a permanent entry signal.
━━━━━━━━━━━━━━━━━━━━━━
📟 DASHBOARD
━━━━━━━━━━━━━━━━━━━━━━
The indicator includes a compact dashboard in the bottom-right corner of the main price chart.
The dashboard displays:
Momentum
Possible states include:
• STRONG LONG
• LONG
• STRONG SHORT
• SHORT
• NEUTRAL
Trend
Possible states include:
• BULLISH
• BEARISH
• NEUTRAL
• OFF
Regime
Possible states include:
• TRENDING
• DEVELOPING
• CHOP
• OFF
Trade
Possible states include:
• WAITING
• LONG ACTIVE
• LONG TP1 REACHED
• LONG TP2 REACHED
• SHORT ACTIVE
• SHORT TP1 REACHED
• SHORT TP2 REACHED
Last
Displays the most recent closed model result:
• SL
• CLOSED TP1
• CLOSED TP2
• TP3
Protection
Displays:
• ATR MODE
• XAUUSD VERIFIED
• CHECK SYMBOL
The dashboard is not TradingView Strategy Tester.
It does not display audited brokerage results.
Its states are based on the indicator’s own rule-based calculations.
━━━━━━━━━━━━━━━━━━━━━━
🚨 ALERT SYSTEM
━━━━━━━━━━━━━━━━━━━━━━
MACD Momentum Entry Engine includes static TradingView alert conditions for:
• MACD Momentum LONG
• MACD Momentum SHORT
• TP1
• TP2
• TP3
• Stop Loss
• XAUUSD Mode Warning
The XAUUSD warning condition is limited to a qualified entry bar when Fixed Pips mode is active on a non-XAUUSD symbol.
The script also includes detailed dynamic alert() messages.
Dynamic Entry messages can include:
• direction
• symbol
• timeframe
• setup type
• setup grade
• composite score
• risk model
• Entry
• Stop Loss
• TP1
• TP2
• TP3
• XAUUSD mismatch warning when relevant
Dynamic target messages can include:
• target name
• direction
• symbol
• timeframe
• reached target price
• Entry
• Stop Loss
• TP1
• TP2
• TP3
Dynamic stop messages can include:
• final result
• direction
• symbol
• timeframe
• Entry
• exit price
• Stop Loss
• whether TP1 or TP2 was reached first
Alerts are monitoring tools.
They do not place or manage broker orders.
━━━━━━━━━━━━━━━━━━━━━━
🔔 HOW TO USE ALERTS
━━━━━━━━━━━━━━━━━━━━━━
For static conditions:
1. Add MACD Momentum Entry Engine to the chart.
2. Open TradingView’s Create Alert window.
3. Select the indicator as the condition.
4. Choose LONG, SHORT, TP1, TP2, TP3, SL, or XAUUSD Mode Warning.
5. Select a frequency appropriate for confirmed-candle monitoring.
6. Test the alert before relying on it.
For detailed dynamic messages:
1. Enable Detailed Dynamic Alerts in the indicator settings.
2. Open TradingView’s Create Alert window.
3. Select MACD Momentum Entry Engine .
4. Select Any alert() function call.
5. Configure the delivery method.
6. Test the complete message format.
Alert delivery can depend on:
• TradingView servers
• the selected symbol
• the selected timeframe
• market-data availability
• realtime feed status
• user alert configuration
• webhook or external-service availability
Creating an alert does not guarantee broker execution.
━━━━━━━━━━━━━━━━━━━━━━
🧪 HOW TO USE THE INDICATOR
━━━━━━━━━━━━━━━━━━━━━━
A practical workflow:
1. Add MACD Momentum Entry Engine to a standard candlestick chart.
2. Begin with the default MACD values of 12, 26, and 9.
3. Keep Entry Timing on Early Trigger while learning the setup types.
4. Keep Momentum Quality on Strict for the default selective profile.
5. Keep Anti-Chop on Strict.
6. Keep Entry Qualification on Strict.
7. Observe whether the event is Reversal, Continuation, Zero Reclaim, or Expansion.
8. Review the MACD histogram, line relationship, and neon signal dot.
9. Review the main-chart LONG or SHORT label.
10. Open the label tooltip to inspect the scores and setup type.
11. Review Momentum, Trend, Regime, Trade, Last Result, and Protection in the dashboard.
12. Verify the selected risk model.
13. When using XAUUSD Fixed Pips, confirm XAUUSD VERIFIED.
14. Treat Entry, SL, TP1, TP2, and TP3 as planning references.
15. Use alerts for monitoring rather than blind execution.
16. Compare every setup with personal structure, session, volatility, and risk rules.
17. Test the exact symbol, timeframe, session, and data feed personally used.
The indicator is designed for structured review.
It should not be treated as an automatic decision-maker.
━━━━━━━━━━━━━━━━━━━━━━
⚙️ SETTINGS REFERENCE
━━━━━━━━━━━━━━━━━━━━━━
⚙️ MACD Core
Calculation Source
Selects the price source used by the MACD calculation.
Fast Length
Controls the fast average.
Default: 12.
Slow Length
Controls the slow average.
Default: 26.
Signal Length
Controls signal-line smoothing.
Default: 9.
MACD Average Type
Selects EMA, SMA, RMA, or WMA for the fast and slow averages.
Signal Average Type
Selects EMA, SMA, RMA, or WMA for the signal line.
━━━━━━━━━━━━━━━━━━━━━━
🎯 Entry Engine
Entry Timing
Early Trigger accepts the confirmed setup event directly.
Momentum Confirmed waits for renewed directional histogram expansion and MACD continuation after the setup is armed.
━━━━━━━━━━━━━━━━━━━━━━
🧠 Momentum Quality Engine
Quality Filter
Selects Off, Loose, Balanced, or Strict.
Strict is the default.
The score combines:
• alignment
• histogram strength
• histogram expansion
• MACD slope
• momentum acceleration
━━━━━━━━━━━━━━━━━━━━━━
📈 Trend Bias Engine
Trend Bias Mode
Selects:
• Off
• Chart EMA
• Higher Timeframe EMA
• Combined EMA
Off is the default.
Trend EMA Length
Controls the chart and higher-timeframe EMA.
Default: 200.
Chart EMA Slope Lookback
Controls the chart-bar lookback used to evaluate EMA direction.
Require EMA Slope Confirmation
Requires a rising EMA for LONG and falling EMA for SHORT.
Higher Timeframe
Selects the confirmed higher-timeframe context.
Default: 60 minutes.
Price-to-EMA ATR Buffer
Requires an optional minimum ATR-normalized distance between price and the trend EMA.
Zero disables the distance requirement.
━━━━━━━━━━━━━━━━━━━━━━
🧱 Anti-Chop Engine
Anti-Chop Filter
Selects Off, Loose, Balanced, or Strict.
Strict is the default.
The regime score combines:
• ADX — 35 points
• price efficiency — 30 points
• EMA separation — 20 points
• volatility expansion — 15 points
━━━━━━━━━━━━━━━━━━━━━━
✅ Entry Qualification Engine
Enable Reversal Setups
Allows MACD crossovers on the opposite side of zero.
Enable Continuation Setups
Allows MACD crossovers on the directional side of zero.
Enable Zero-Line Reclaims
Allows confirmed MACD zero-line crossings with aligned histogram and signal-line conditions.
Enable Momentum Expansions
Allows renewed histogram expansion after contraction while MACD alignment remains valid.
Entry Qualification Filter
Selects Off, Loose, Balanced, or Strict.
Strict is the default.
The score combines:
• candle quality
• MACD separation
• persistence
• price impulse
• trigger context
━━━━━━━━━━━━━━━━━━━━━━
💼 Trade Management Engine
Enable Trade Engine
Enables the one-active-trade-at-a-time visual model.
Risk Model
Selects ATR Based or XAUUSD Fixed Pips.
XAUUSD Fixed Pips is the default.
ATR Length
Controls ATR for the adaptive model.
ATR Stop Multiplier
Controls stop distance in ATR mode.
ATR TP1 Risk/Reward
Controls TP1 distance in ATR mode.
ATR TP2 Risk/Reward
Controls TP2 distance in ATR mode.
ATR TP3 Risk/Reward
Controls TP3 distance in ATR mode.
XAUUSD Pip Size
Controls the price-unit value of one selected pip.
XAUUSD Stop-Loss Pips
Controls fixed Stop distance.
XAUUSD TP1 Pips
Controls fixed TP1 distance.
XAUUSD TP2 Pips
Controls fixed TP2 distance.
XAUUSD TP3 Pips
Controls fixed TP3 distance.
Same-Bar Resolution
Selects Stop First or Targets First.
Show Active TP / SL Zones
Shows Entry, targets, Stop, boxes, and lines on the main chart.
Keep Historical TP3 Zones
Preserves completed TP3 models.
Historical TP3 Trade Limit
Limits completed TP3 models retained on the chart.
Trade Result Labels
Enables SL, Closed TP1, Closed TP2, and TP3 result labels.
SL Label Size
Controls SL result size.
Closed TP1 Label Size
Controls Closed TP1 result size.
Closed TP2 Label Size
Controls Closed TP2 result size.
TP3 Label Size
Controls the separate FULL TARGET label size.
━━━━━━━━━━━━━━━━━━━━━━
🛡️ Signal Filters
Zero-Line Filter
Off allows both sides of zero.
Trend Direction requires LONG above zero and SHORT below zero.
Trend Direction is the default.
Use Absolute Strength Filter
Enables ATR-normalized minimum histogram strength.
Normalization ATR Length
Controls normalization.
Minimum Absolute Strength
Controls the required normalized histogram value.
━━━━━━━━━━━━━━━━━━━━━━
🎨 Visual Settings
Show MACD Line
Shows or hides the MACD line.
Show Signal Line
Shows or hides the signal line.
Show Histogram
Shows or hides histogram columns.
Histogram Visual Length
Changes histogram display scale without changing calculations.
Show MACD Neon Signal Dots
Shows qualified LONG and SHORT dots on the MACD line.
Show Momentum Background
Shows directional momentum background states.
Highlight Blocked Chop Conditions
Shows a neutral background when Anti-Chop blocks entries.
Show LONG / SHORT Labels
Shows or hides main-chart entry labels.
Entry Label Content
Selects Direction Only, Grade, or Score + Grade.
LONG Label Size
Controls LONG label size.
SHORT Label Size
Controls SHORT label size.
━━━━━━━━━━━━━━━━━━━━━━
📟 Mini Dashboard
Show Mini Dashboard
Shows or hides the compact bottom-right main-chart dashboard.
━━━━━━━━━━━━━━━━━━━━━━
🔔 Dynamic Alerts
Enable Detailed Dynamic Alerts
Enables runtime alert() messages.
For these messages, create the TradingView alert using:
Any alert() function call.
Input values are hidden from the status line.
MACD plot values are also prevented from creating status-line or price-scale labels, while diagnostic values remain available in the Data Window.
━━━━━━━━━━━━━━━━━━━━━━
🧠 WHAT MAKES THIS SCRIPT ORIGINAL
━━━━━━━━━━━━━━━━━━━━━━
MACD, moving averages, ATR, ADX, and trend filters are familiar technical-analysis concepts.
These concepts are not unique by themselves.
The originality of MACD Momentum Entry Engine lies in the coordinated process applied to a MACD event:
Configurable MACD event
→ setup-type classification
→ adaptive momentum-strength baselines
→ five-component Momentum Quality Score
→ optional confirmed trend-bias layer
→ four-component Anti-Chop Regime Score
→ five-component Entry Qualification Score
→ final composite score and grade
→ zero-line and normalized-strength validation
→ confirmed-close signal
→ one-active multi-target trade lifecycle
→ TP3-only historical preservation
→ non-TP3 visual cleanup
→ dynamic alerts
→ main-chart diagnostic dashboard
→ XAUUSD mode verification
Distinctive implementation features include:
• four separate setup families
• different logic for Reversal and Continuation crossovers
• zero-line reclaim detection
• renewed expansion detection without requiring a fresh crossover
• adaptive baselines for strength, expansion, slope, and acceleration
• separate bullish and bearish scoring
• a Momentum Quality Score independent from Entry Qualification
• an Anti-Chop Score independent from momentum quality
• confirmed previous higher-timeframe EMA values
• a 70/30 final composite structure
• A+, A, B, and C grades
• visual-only histogram scaling
• equal-third multi-target internal accounting
• same-candle processing assumptions
• XAUUSD symbol verification
• separate result behavior for TP3 and non-TP3 outcomes
• detailed Data Window diagnostics
The script is not a simple combination of unrelated indicators.
Every module supports the same objective: determining whether a confirmed MACD event has enough momentum, market, and entry context to become a permanent visual setup.
━━━━━━━━━━━━━━━━━━━━━━
⚠️ IMPORTANT PRACTICAL NOTES
━━━━━━━━━━━━━━━━━━━━━━
Signal frequency depends on:
• fast, slow, and signal lengths
• selected average types
• Entry Timing
• enabled setup families
• Momentum Quality mode
• Trend Bias mode
• EMA length
• higher timeframe
• EMA slope requirement
• price-to-EMA buffer
• Anti-Chop mode
• Entry Qualification mode
• zero-line filter
• absolute-strength threshold
• symbol
• timeframe
• session
• volatility
• available history
• data provider
• active-trade state
Strict modes reduce accepted signals.
They do not guarantee better results.
Trend Bias Off allows the momentum engine to evaluate both directions without EMA permission.
Higher Timeframe EMA and Combined EMA should use a timeframe meaningfully above the chart timeframe.
XAUUSD Fixed Pips is designed around a selectable pip convention.
The default 0.01 value may not match every broker or synthetic symbol.
Momentum Confirmed produces later and potentially fewer signals than Early Trigger.
Histogram Visual Length does not alter logic.
Changing settings recalculates historical signals and trade models.
A setup that looks different after changing the chart range may be affected by available historical data and adaptive baselines.
━━━━━━━━━━━━━━━━━━━━━━
⚠️ LIMITATIONS AND SHORTCOMINGS
━━━━━━━━━━━━━━━━━━━━━━
This script has important limitations:
It does not guarantee profitable trades.
It does not predict future price movement.
It does not execute orders.
It does not place broker stops or targets.
It does not include spread.
It does not include commission.
It does not include slippage.
It does not include latency.
It does not model partial fills.
It does not model financing or swap.
It uses bar-based OHLC data.
Historical candles do not reveal exact intrabar order.
Stop First and Targets First are assumptions.
The setup score is not a win probability.
A+ is not a guaranteed outcome.
The Anti-Chop Score cannot identify every ranging condition.
Trend filters can delay or block valid reversals.
Trend Bias Off can allow countertrend signals.
ATR normalization does not make settings universal.
Fixed-pip conventions can differ between brokers.
XAUUSD symbol detection cannot verify a broker’s contract specification.
The dashboard is not TradingView Strategy Tester.
Data Window counters are not audited account performance.
The internal R model assumes three equal portions.
The internal model does not represent real position sizing.
One-active-trade logic is a visual-management rule.
Alert delivery depends on TradingView and user configuration.
Changing settings changes historical calculations.
Changing symbol, exchange, session, timeframe, or feed can change signals.
Adaptive baselines depend on available chart history.
Confirmed higher-timeframe values reduce unfinished-HTF changes but introduce delay.
Permanent signals wait for candle close and therefore do not capture the earliest intrabar moment.
For these reasons, the indicator should be used as an educational decision-support tool, not as a standalone automated strategy.
━━━━━━━━━━━━━━━━━━━━━━
👤 WHO THIS SCRIPT MAY BE USEFUL FOR
━━━━━━━━━━━━━━━━━━━━━━
This script may be useful for traders who:
• already understand basic MACD behavior
• want more context than a raw crossover
• study momentum expansion and contraction
• distinguish reversal, continuation, zero-line, and expansion events
• want transparent setup scoring
• want an anti-chop layer
• want optional chart and higher-timeframe trend context
• prefer confirmed-close signals
• want Entry, SL, and three target references
• use XAUUSD and want configurable fixed-pip distances
• want symbol-mismatch warnings
• want a compact dashboard
• want detailed alerts
• want diagnostic Data Window values
• prefer one active visual model at a time
It may be less suitable for users who:
• want guaranteed signals
• want a fully automated trading bot
• want every MACD crossover displayed
• expect a score to equal probability
• expect one setting to work on every market
• require exact tick-level execution
• want Strategy Tester results from an indicator
• want the indicator to replace personal judgment
• expect alerts to execute broker orders automatically
━━━━━━━━━━━━━━━━━━━━━━
🧭 BEST PRACTICE SUGGESTIONS
━━━━━━━━━━━━━━━━━━━━━━
For the default selective profile:
• use standard candlesticks
• begin with MACD 12 / 26 / 9
• keep Entry Timing on Early Trigger
• keep Momentum Quality on Strict
• keep Anti-Chop on Strict
• keep Entry Qualification on Strict
• keep the Zero-Line Filter on Trend Direction
• keep Absolute Strength enabled
• keep all four setup families enabled while learning
• use the dashboard to identify blocked regime conditions
• verify the selected risk model before reviewing trade levels
• use Stop First for conservative historical same-bar handling
• confirm XAUUSD VERIFIED when using Fixed Pips
• use alerts for monitoring rather than blind execution
For additional frequency:
• change Momentum Quality from Strict to Balanced
• change Anti-Chop from Strict to Balanced
• change Entry Qualification from Strict to Balanced
• disable the Zero-Line Filter
• disable Absolute Strength
• keep Trend Bias Off
• use Early Trigger
For additional directional restriction:
• use Chart EMA, Higher Timeframe EMA, or Combined EMA
• enable EMA slope confirmation
• add a Price-to-EMA ATR Buffer
• use a higher timeframe above the chart timeframe
• use Momentum Confirmed instead of Early Trigger
Always:
• wait for the setup candle to close
• review the setup type
• review the score components
• verify market structure independently
• review session and volatility
• verify the stop distance
• use personal position sizing
• test the exact symbol and timeframe
• understand the same-bar assumption
• treat all projected levels as analytical references
━━━━━━━━━━━━━━━━━━━━━━
🔓 PUBLICATION NOTE
━━━━━━━━━━━━━━━━━━━━━━
MACD Momentum Entry Engine is published as an educational momentum-analysis and visual trade-model tool.
The purpose of this description is to explain:
• how the configurable MACD core is calculated
• how average types affect the MACD and signal lines
• how setup events are classified
• how Reversal setups work
• how Continuation setups work
• how Zero-Line Reclaim setups work
• how Momentum Expansion setups work
• how Early Trigger and Momentum Confirmed differ
• how the Momentum Quality Score is constructed
• how adaptive momentum baselines work
• how the Anti-Chop Score is constructed
• how the Entry Qualification Score is constructed
• how final composite scores and grades are assigned
• how chart and confirmed higher-timeframe trend filters work
• how zero-line and absolute-strength filters work
• when permanent signals appear
• how the one-active-trade model works
• how Entry and Stop are calculated
• how TP1, TP2, and TP3 are calculated
• how same-candle ambiguity is handled
• how historical TP3 visuals are retained
• how non-TP3 visuals are cleaned
• how result labels behave
• what the dashboard displays
• how XAUUSD protection works
• what static and dynamic alerts contain
• what diagnostic values are available
• what the timing limitations are
• what the model does not simulate
• why familiar MACD concepts are organized into an original workflow
The script is designed to support structured analysis.
It does not promise profitable results.
It does not remove market risk.
It does not execute trades.
It should not be used as a blind LONG/SHORT system.
MAIN CHART SCREENSHOT PLAN
Use one clean standard candlestick chart.
Show the indicator with its default settings.
The screenshot should contain:
• complete symbol and timeframe information
• the indicator name
• visible standard price candles
• one clear LONG or SHORT label
• one active or completed Entry / TP / SL model
• the white Entry line
• green TP1, TP2, and TP3 levels
• the red SL area and solid SL line
• the MACD pane
• the white MACD line
• the red signal line
• the green/red histogram
• one neon MACD signal dot
• the bottom-right main-chart dashboard
• the Protection state
Do not include:
• other indicators
• manual drawings
• unrelated labels
• social-media links
• pricing information
• promotional claims
• account-profit screenshots
• win-rate claims
• non-standard candles
• hidden symbol or timeframe information
• excessive zoom
• decorative graphics unrelated to the script
The screenshot should demonstrate normal default behavior and make the relationship between the MACD event, main-chart signal, trade model, and dashboard easy to understand.
━━━━━━━━━━━━━━━━━━━━━━
🛡️ DISCLAIMER
━━━━━━━━━━━━━━━━━━━━━━
MACD Momentum Entry Engine is provided for educational and informational purposes only.
It does not constitute financial, investment, trading, legal, or tax advice.
No indicator can guarantee future results.
Markets are uncertain.
Momentum changes.
Volatility changes.
Liquidity changes.
Historical chart behavior does not ensure future performance.
Every user is responsible for their own:
• analysis
• validation
• risk management
• position sizing
• alert configuration
• trading decisions
• broker execution
• legal obligations
• tax obligations
The MACD line, signal line, histogram, momentum states, setup types, quality scores, regime scores, entry scores, composite scores, grades, trend states, LONG and SHORT labels, Entry references, Stop Loss levels, take-profit levels, boxes, result labels, Data Window values, dashboard states, internal counters, and alerts are visual analysis tools only.
The displayed Entry is not a guaranteed fill.
The displayed Stop Loss is not a broker order.
The displayed TP1, TP2, and TP3 levels are not guaranteed objectives.
The Momentum Quality Score is not a win probability.
The Entry Qualification Score is not a probability.
The Market Regime Score is not a guarantee that a market is trending.
The A+, A, B, and C grades are not promises of performance.
The internal trade model does not include spread, commissions, slippage, latency, order-book conditions, contract specifications, or partial fills.
Use this script as a structured MACD momentum-review and decision-support framework, not as a promise of profitability or a substitute for independent judgment. อินดิเคเตอร์

BEDROCK Gated Macro Spot Cycle ModelBEDROCK condenses several independent long-term Bitcoin valuation models into a single transparent 0–100 score, then maps that score onto a seven-tier ladder running from deep value to cycle-top risk — with capitulation and euphoria gates that hold back the two most common false signals at each extreme. It is built for spot investors making multi-month and multi-year allocation decisions, not for short-term trading.
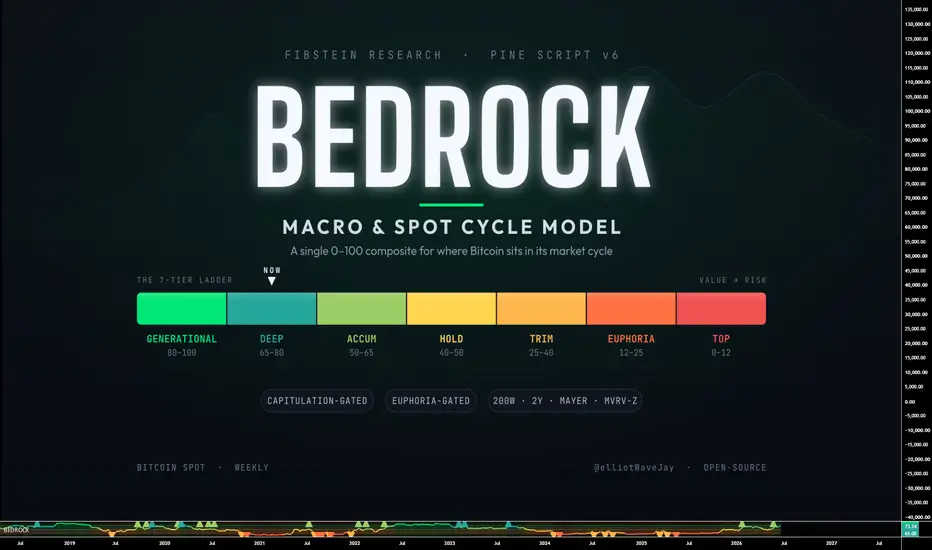
The reference card below shows how to read the model and how each tier behaves:
█ WHAT IT DOES
BEDROCK answers one question: where does price sit inside its macro cycle right now? Rather than a single oscillator, it scores a basket of slow-moving valuation measures, normalizes each to a common 0–100 "cheap → expensive" scale, blends them into a weighted composite, and classifies the result into an actionable tier with a suggested accumulation or distribution size. A higher composite means greater long-term value and lower risk; a lower composite means the market is stretched and risk is rising.
█ HOW IT WORKS
The composite is built from four independent blocs, any of which can be reweighted or disabled:
Trailing cost-basis bloc — price relative to the 200-week SMA, the 2-year SMA, and the 200-day SMA (Mayer Multiple). These three are deliberately collapsed into a single averaged, bounded factor so the moving-average family is represented once and cannot dominate the score through collinearity.
Drawdown from all-time high — how far price has fallen from its peak. The heaviest-weighted leg by default.
Weekly RSI — long-term momentum, as secondary confirmation.
MVRV Z-Score (optional) — an on-chain valuation leg you can enable and feed from an external source.
Each metric is mapped to 0–100 through its own linear calibration between a deep-value anchor and an expensive anchor, so every leg speaks the same language before being combined. Weights are auto-renormalized over whatever blocs are actually available — so the model stays coherent on early history where the 200-week isn't yet populated, or when MVRV is turned off. It simply reweights the parts it has.
█ THE TWO GATES — THE CORE IDEA
A raw valuation score has two classic failure modes: it screams "generational buy" on the first leg down of a bear market, and it screams "top" every time price gets mildly extended. BEDROCK addresses both with directional gates that only ever cap the tier toward the middle — they never fabricate a signal, and they never block the core accumulate or trim reads.
Capitulation gate (bottom) — the two deepest tiers stay locked until the market shows genuine capitulation. Generational requires a large drawdown from the all-time high (or a deeply negative MVRV-Z); Deep Accumulation requires price at or below its 200-week basis. Until then the score is capped at Accumulation, so you keep buying value without prematurely committing everything.
Euphoria gate (top) — the two riskiest tiers stay locked until multiple independent overheating signs agree across the 200-week multiple, weekly RSI, the Mayer Multiple, and MVRV-Z. Euphoria requires at least one confirmation; Cycle Top requires at least two. This is what stops the model from calling a top on every rally.
Because both gates only cap toward neutral, accumulation signals are never suppressed and trim signals are never suppressed. The gates restrain only the extreme calls, and only until the evidence is actually there.
█ READING THE INDICATOR
Composite line — the 0–100 score, colored by its current tier.
Background — shaded by tier for at-a-glance cycle context.
Threshold lines — the tier boundaries.
Markers — gated triangles mark transitions into accumulation tiers (up) and distribution tiers (down).
Data table — live composite, current tier, suggested action, both gate states, and every underlying metric (200W and 2Y multiples, Mayer, drawdown, weekly RSI, MVRV).
█ THE SEVEN TIERS
Generational Value — extremely rare deep value; aggressive accumulation.
Deep Accumulation — excellent value; size up.
Accumulation — good value; keep building.
Neutral / Hold — fairly valued; hold.
Expensive / Trim — above fair value; begin scaling out.
Euphoria / Distribute — high risk; distribute and protect profit.
Cycle Top / Exit — extreme; high-probability macro top.
Each tier also outputs a suggested DCA-in or trim-out multiplier, so the signal is sized rather than binary.
█ HOW TO USE IT
Use it on Bitcoin spot or index charts such as BITSTAMP:BTCUSD or $BINANCE:BTCUSDT.
Weekly is the primary timeframe; daily works as a secondary view.
Accumulate through tiers 1–3, hold in tier 4, scale down in tiers 5–6, and treat tier 7 as exit territory.
Built-in alerts fire on entry into each accumulation and distribution tier (gated).
█ WHAT MAKES IT ORIGINAL
BEDROCK is not a single valuation ratio dressed up as an oscillator. The combination is the point: a transparent additive composite over independent metrics, a deliberate collinearity fix that collapses the moving-average family into one bounded bloc, a dual directional-gate system that suppresses the two most common false signals at both extremes without ever blocking the core reads, and sized accumulate/trim output instead of a bare number. Every metric, weight, calibration anchor, and gate threshold is exposed as an input, so the entire model is auditable and tunable — nothing is hidden.
█ NOTES & LIMITATIONS
BEDROCK is a long-horizon valuation tool, not a precise top/bottom timer and not a short-term trading system. It is designed to keep you positioned in the statistically favorable portion of the cycle, not to nail exact turns. Several display themes are included. This script is for educational purposes only and is not financial advice — size your own risk and do your own research. อินดิเคเตอร์

TW - Dual FlowZone MA Clouds## Dual FlowZone MA Clouds
Dual FlowZone MA Clouds is a trend visualization indicator designed to help traders quickly identify market direction, trend strength, and potential transitions before they become obvious.
Unlike traditional moving average indicators that simply plot one or two averages, Dual FlowZone MA Clouds uses two independent FlowZones to provide both short-term momentum and longer-term trend context in a single, easy-to-read visualization.
FlowZone A is designed to help identify momentum, pullbacks, and trend continuation, while FlowZone B provides higher timeframe directional bias and market context. When both FlowZones align, traders can quickly recognize strong trending conditions. When they diverge, the market may be transitioning or losing participation.
### Flow Status Table
The optional Flow Status table provides an instant summary of current market conditions without requiring traders to interpret multiple moving averages.
The table displays:
* **Primary Flow** – Current direction of FlowZone A (Bullish, Bearish, Neutral, or Weakening)
* **Secondary Flow** – Current direction of FlowZone B
* **Alignment** – Indicates whether both FlowZones are aligned or providing mixed signals
This allows traders to assess overall trend bias with a quick glance before analyzing price action.
### ORB-Style Visual Design
The Flow Status table uses the same visual style as the Traders Workshop ORB Sessions indicator, providing a consistent interface across the indicator suite.
### Chart Labels
When a FlowZone crossover occurs, optional chart labels identify the signal directly on the chart, making it easy to review historical trend changes without searching through moving average crosses.
The indicator also supports optional Flow Dots and subtle background bias to provide additional visual confirmation while keeping the chart clean and uncluttered.
### Features
• Two fully independent Moving Average FlowZones
• Supports SMA, EMA, WMA, RMA, VWMA and HMA
• Configurable MA lengths, colors and line widths
• Dynamic bullish, bearish and transition cloud coloring
• Optional Flow Status dashboard
• Optional crossover markers
• Optional Flow Dots
• Optional background trend bias
• Individual alerts for crossovers, trend changes and FlowZone alignment
Dual FlowZone MA Clouds is designed to complement price action—not replace it. Use it alongside market structure, volume, VWAP, auction concepts, and support/resistance to better understand trend quality and directional bias.
---
**Part of the Traders Workshop indicator collection**
**Real Trading. Real Testing. Real Results.**
อินดิเคเตอร์

อินดิเคเตอร์

อินดิเคเตอร์

Multi-MA Slope, ADX TradingView Script Description
Suggested Title: Advanced Multi-MA Slope, ADX & Cross System v8.0
🚀 Strategy Overview
Welcome to v8.0 of the popular Advanced Moving Average series, completely rewritten and optimized from scratch under the latest Pine Script v6 architecture. This update brings massive speed, memory efficiency, and execution precision to your backtesting and live trading.
Unlike traditional single-indicator setups, this version introduces a highly scalable Dynamic Multi-MA Core Engine. The entire system architecture—including slope calculations, acceleration tracking, and dynamic re-entry logic—automatically adapts its mathematical behavior based on the specific Moving Average type you select from the inputs panel.
🛠️ Key Capabilities & Core Features
Dynamic Multi-MA Selection Pool:
Change the entire backbone of the strategy with a single click. The script natively supports and recalculates its entire logic for:
ALMA (Arnaud Legoux Moving Average): Offering near-zero lag combined with superior Gaussian smoothing.
EMA (Exponential Moving Average): The gold standard for quick reaction to early trend reversals.
VWMA (Volume Weighted Moving Average): Factors in volume data to track institutional order blocks and smart money.
Hull MA (HMA): Provides an ultra-fast, almost lag-free curve engineered for speed.
TSI (True Strength Index - Price Mapped): Exclusive Optimization. Since the standard TSI is a bounded oscillator, it has been mathematically normalized to match the price scale via an EMA baseline. This allows it to work seamlessly with the strategy’s price cross and slope mechanics.
Scope Isolation & v6 Compilation Boost:
By utilizing modular Switch-Case blocks and strict variable scoping, the backend eliminates memory leaks and data-shadowing issues present in older scripts. This structural cleanup guarantees that the TradingView simulator pulls historical bars ( , ) with maximum mathematical precision, preventing micro-delays between intrabar reflexive exits and bar-close entry confirmations. This is the exact reason why this version shows up to a 50% performance increase with identical settings compared to legacy code.
Slope Acceleration Filter:
To combat whipsaws and false breakouts, the strategy requires the selected MA’s slope to not just change direction, but actively "strengthen and accelerate" over a customizable number of consecutive bars (accel_bars).
Bar-Confirmed Smart Re-Entry Engine:
Never get left behind by a strong trend after an early stop-out. Utilizing an intelligent cooling period (reentry_cooldown), the engine tracks the exact slope value of your last exit. If the new trend slope surpasses the exit slope while maintaining acceleration, it dynamically re-enters the position safely.
Adaptive Trailing Stop (ATR Volatility-Adjusted):
An integrated ATR flexibility motor dynamically scales your stop-loss and trailing distances. It tightens risk during low-volatility consolidation phases and widens the safety net during high-volatility expansions.
📊 Recommended Setup Guide
The Trend Follower (Default): Turn on Entry Based on Slope, select ALMA or Hull MA. Keep the ADX filter enabled. This captures major micro and macro trends from the absolute pivot point.
The Institutional Tracker: Select VWMA to trigger entries based on volume-backed momentum, ensuring you only ride trends supported by heavy buying or selling pressure.
The Aggressive Breakout Hunter: Enable Entry Based on Price Cross to trade immediate, reactive breaks of the moving average curve.
📋 Live Performance Dashboard (Heads-Up Display)
The top-right corner features an elegant UI table displaying real-time metrics:
Selected MA Type: Instantly see which core algorithm is running.
Net Profit / Loss: Dynamically updated with green/red color coding.
Win Rate % & Total Trades: Keeps your strategy stats crystal clear at a glance.
Current Position State: Live display of LONG, SHORT, or FLAT status.
Smart TS Multiplier: Shows the real-time volatility multiplier scale.
Disclaimer: This script contains fully customizable technical analysis tools and does not constitute financial or investment advice. กลยุทธ์

อินดิเคเตอร์

อินดิเคเตอร์

SBP Structured Trend Indicator# SBP Structured Trend Indicator
## Overview
SBP Structured Trend Indicator is a trend-following decision support tool designed to evaluate market structure through multiple layers of confirmation instead of relying on a single technical indicator.
Rather than generating signals from one moving average crossover or momentum oscillator, the indicator evaluates the agreement between several independent market characteristics before identifying a potential trading opportunity. The objective is to reduce low-quality signals while remaining responsive to changing market conditions.
The indicator automatically adapts its internal parameters for Scalping, Intraday and Swing trading modes so that the same methodology can be applied across different trading styles.
---
## Methodology
The indicator combines several analytical engines, each measuring a different aspect of market behaviour.
### 1. Structured Trend Engine
The primary trend is determined from a smoothed directional filter that measures both trend direction and trend slope. This establishes the dominant market bias before any trading signals are evaluated.
---
### 2. Adaptive Trend Smoothing
An adaptive moving average is used to smooth price movement while reducing lag during directional trends. The slope of this adaptive average is used as an additional confirmation of market direction instead of relying solely on price crossing a moving average.
---
### 3. Trend Consensus Engine
A fast and slow exponential average are evaluated together to estimate trend agreement. Rather than treating a crossover as a signal by itself, the distance between the averages is used to estimate trend strength.
This helps distinguish established trends from weak directional movement.
---
### 4. Volatility Assessment
Current market volatility is compared with its recent average using the Average True Range (ATR).
This allows the indicator to distinguish between expanding and contracting market conditions so that stronger trends receive greater confidence than periods of low activity.
---
### 5. Momentum Evaluation
Momentum is measured using the rate of price change together with recent candle direction.
Momentum confirmation is evaluated alongside the prevailing trend rather than acting as an independent entry trigger.
---
### 6. Trend Confidence Score
A confidence score is calculated from several independent observations, including:
• Momentum strength
• Trend persistence
• Trend strength
• Relative trading volume
The resulting confidence score allows traders to select Aggressive, Balanced or Conservative filtering depending on their preferred trading style.
---
### 7. Position State Logic
The indicator tracks the current directional state to avoid repeatedly issuing identical signals during the same market move.
A new Buy signal is generated only after market conditions support a new bullish transition, while Sell signals follow the same principle for bearish conditions.
This design aims to reduce repetitive alerts during sustained trends.
---
## Trading Modes
### Scalping
Uses shorter internal lookback periods to respond more quickly to short-term price movement.
### Intraday
Balances responsiveness and stability for session-based trading.
### Swing
Uses longer adaptive calculations intended to identify broader market trends while filtering short-term fluctuations.
---
## Dashboard
The optional dashboard summarizes the current analytical state, including:
• Selected trading mode
• Current trend direction
• Market regime
• Trend confidence score
• Latest signal status
The dashboard is intended as a quick reference and should not replace chart analysis.
---
## Suggested Usage
The indicator is designed to be used alongside price action, support and resistance, market structure and prudent risk management.
It is not intended to predict future prices or guarantee profitable trades. Instead, it provides a structured framework for evaluating trend quality and identifying higher-confidence trading opportunities.
As with any analytical tool, users should evaluate signals within the broader market context and test the indicator on instruments and timeframes appropriate to their trading approach.
อินดิเคเตอร์

อินดิเคเตอร์

Price Action Bands | Trend & Volatility [RadixAlgo]🔶 About the Indicator
Price action often looks simple after the move is complete, but while the market is moving, traders usually need more context to understand whether price is trending, overextended, pulling back, or simply moving inside normal volatility. This price action indicator was built to make this context easier to read directly on the chart.
It combines a dynamic moving average baseline with upper and lower volatility bands, giving traders a structured way to follow trend direction, measure price extension, analyze volatility, and observe how price reacts around key dynamic support and resistance zones.
At the center of the indicator is a customizable trend baseline that can be calculated with different moving average types, including SMA, EMA, HMA, RMA, WMA, SWMA, and VWMA. The baseline changes color based on the current trend state, helping users distinguish bullish and bearish market conditions without adding unnecessary visual noise.
Around this baseline, the indicator plots adaptive volatility bands using either ATR or Standard Deviation. The upper red bands highlight areas where price may be extended to the upside, while the lower green bands show where price may be stretched to the downside.
This isn’t one of those indicators that tries to tell you exactly when to buy or sell. It’s more like a lens that helps you see what the market is actually doing in real time. Sometimes you’ll notice price hugging the bands during a strong trend, other times it drifts back toward the baseline after stretching too far.
That’s where the real insight comes from. You can tweak the moving average type, adjust how wide the bands are, or smooth things out depending on how fast or slow you like to read the chart. Whether you’re watching quick intraday moves or letting a swing trade develop over days, it naturally adapts to your style without forcing a rigid system on you.
🔶 How It Works
The logic behind Price Action Bands | Trend & Volatility starts with a dynamic trend baseline. This baseline is the central reference point of the indicator and acts as the main structure around which price action is interpreted.
Instead of forcing every market into one fixed moving average model, the indicator allows traders to choose between several moving average types, including SMA, EMA, HMA, RMA, WMA, SWMA, and VWMA.
Each one reads the market slightly differently. SMA provides a classic and balanced view of the average price, EMA reacts faster to recent price changes, HMA is smoother while still being responsive, RMA is useful for softer trend tracking, WMA gives more importance to recent candles, SWMA creates a smoother short-term baseline, and VWMA includes volume in the calculation, making it useful when traders want the trend line to reflect both price and trading activity.
After the baseline is calculated, the indicator compares it with a smoothed version of itself. This creates the trend state logic. When the baseline is positioned above its smoothed signal line, the market is treated as being in a bullish trend state, and the trend area is highlighted in blue.
When the baseline moves below the smoothed signal line, the market is treated as being in a bearish trend state, and the trend area is highlighted in orange. This does not mean that the indicator is generating automatic buy or sell signals. Instead, it gives traders a cleaner way to understand whether the current price action is aligned with bullish pressure or bearish pressure.
The second major part of the indicator is the volatility band system. Around the trend baseline, the script builds upper and lower bands that expand and contract based on market conditions. These bands can be calculated using either ATR or Standard Deviation. ATR measures the actual range of price movement and is useful for understanding how much the market is moving from candle to candle.
It is especially helpful in volatile markets, breakout phases, and fast price movements. Standard Deviation, on the other hand, measures how far the baseline or price behavior is spread from its average condition. This makes it useful for identifying statistical price extension, compression, and overextended market areas.
The indicator uses two band levels on each side of the baseline: inner bands and outer bands. The inner bands represent a moderate volatility zone, while the outer bands represent a more extreme price extension area. When price moves into the upper red bands, it shows that price is stretched above the trend baseline.
This can happen during strong bullish continuation, aggressive breakout movement, or an overextended upside condition. When price reaches the lower green bands, it shows that price is stretched below the trend baseline. This can appear during strong bearish continuation, downside volatility expansion, or an overextended sell-side move.
The upper and lower bands should not be read as simple overbought and oversold levels. This is where the indicator becomes more than just a basic band framework. Price can touch an upper band and continue higher if the trend is strong, or it can leave the upper band and return toward the baseline when momentum starts to fade.
The same logic applies to the lower bands. A move into the lower band can signal strong bearish pressure, but if price exits the band and begins moving back toward the baseline, traders may start watching for a possible reaction, correction, or mean-reversion move. The value comes from reading the relationship between price, the baseline, the trend state, and the volatility zones together.
In bullish conditions, traders usually focus on how price behaves around the blue trend baseline, the upper volatility bands, and pullbacks toward the central structure. A bullish market may show price holding above the baseline, reacting from it, or expanding toward the upper bands as volatility increases. In this environment, pullbacks toward the baseline can help traders evaluate whether the trend is still supported, while movement into the upper bands can show momentum expansion or price extension.
In bearish conditions, the logic is reversed. Traders watch how price behaves below the baseline, how it reacts around the orange trend state, and whether downside movement reaches the lower green bands. Pullbacks toward the baseline may act as areas where bearish pressure returns, while movement into the lower bands can show strong downside volatility or stretched price action.
Because the indicator does not place automatic signals on the chart, the trader remains responsible for interpreting the setup. A breakout, pullback, exit from band, or trend continuation condition is not defined by one single line touch. It is read through context: the color of the trend baseline, the position of price relative to the baseline, the distance between price and the bands, and the way candles react after entering or leaving a volatility zone. This makes the tool flexible for different strategies, including trend-following, breakout trading, pullback trading, volatility analysis, and mean-reversion analysis, while still keeping the chart visually clean.
🔶 Input Parameters
🔹Moving Average Type
Selects the moving average used as the main trend baseline. The available options are SMA, EMA, HMA, RMA, WMA, SWMA, and VWMA. Each moving average type reacts differently to price movement, so traders can choose the one that best matches their trading style.
🔹Moving Average Period
Defines the length of the moving average baseline. Higher values create a smoother and slower trend line, while lower values make the baseline react faster to recent price changes.
🔹Trend Smoothing Period
Controls the smoothing of the trend signal line. Lower values make the trend state more sensitive to changes, while higher values create a smoother and more stable trend reading.
🔹Band Method
Determines how the volatility bands are calculated. Traders can choose between ATR and Standard Deviation. ATR measures market range and movement, while Standard Deviation measures price dispersion around the baseline.
🔹ATR Period
Sets the lookback period for the ATR calculation. This option is active when the Band Method is set to ATR. A shorter period reacts faster to volatility changes, while a longer period creates a smoother volatility reading.
🔹Standard Deviation Period
Sets the lookback period for the Standard Deviation calculation. This option is active when the Band Method is set to Standard Deviation. It controls how price dispersion is measured for the volatility bands.
🔹Band Smoothing Period
Smooths the upper and lower bands to reduce short-term fluctuations. Higher values make the bands more stable, while lower values make them more responsive to recent market movement.
🔹Inner Band Multiplier
Controls the distance of the inner bands from the trend baseline. The inner bands represent the closer volatility zone and can help traders observe moderate price extension.
🔹Outer Band Multiplier
Controls the distance of the outer bands from the trend baseline. The outer bands represent a wider volatility zone and can help traders identify stronger price extension or more extreme market movement.
🔶 Summary
Price Action Bands | Trend & Volatility brings trend direction, price action analysis, and volatility bands into one clean chart-based framework. By combining a customizable moving average baseline with adaptive upper and lower bands, the indicator helps traders understand whether price is following the current trend, pulling back toward dynamic support and resistance, expanding with volatility, or moving into an overextended area. The colored trend baseline gives a quick view of bullish or bearish market conditions, while the ATR and Standard Deviation band methods allow the volatility zones to adapt to different market structures, trading styles, and timeframes.
This indicator is not designed to replace trader judgment with automatic buy and sell signals. Instead, it gives users a practical way to interpret trend-following setups, breakout conditions, pullback opportunities, exit-from-band behavior, mean-reversion zones, and volatility expansion directly on the chart. With flexible settings for moving average type, moving average period, trend smoothing, band method, band smoothing, and inner or outer band multipliers, Price Action Bands can be adjusted for scalping, intraday trading, swing trading, and broader market analysis while keeping the chart readable and focused on real price action.
อินดิเคเตอร์
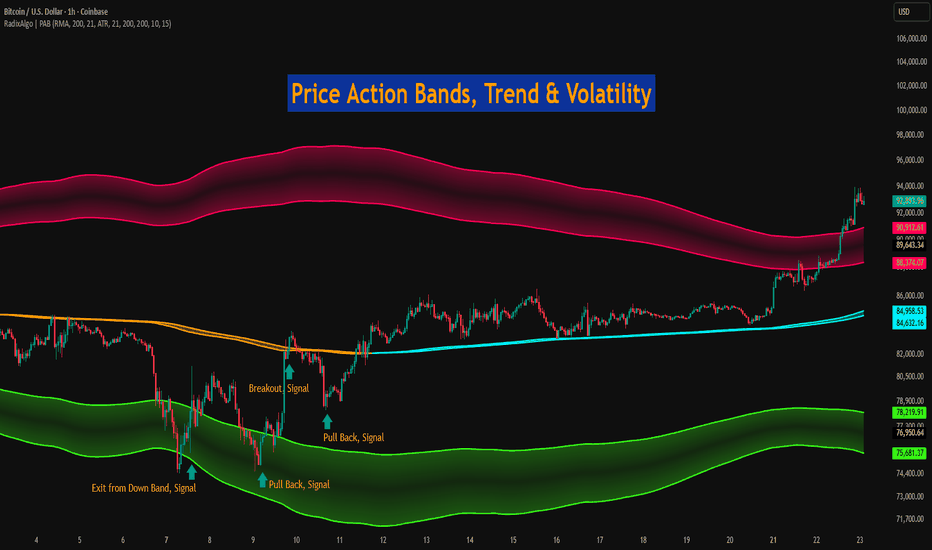
อินดิเคเตอร์
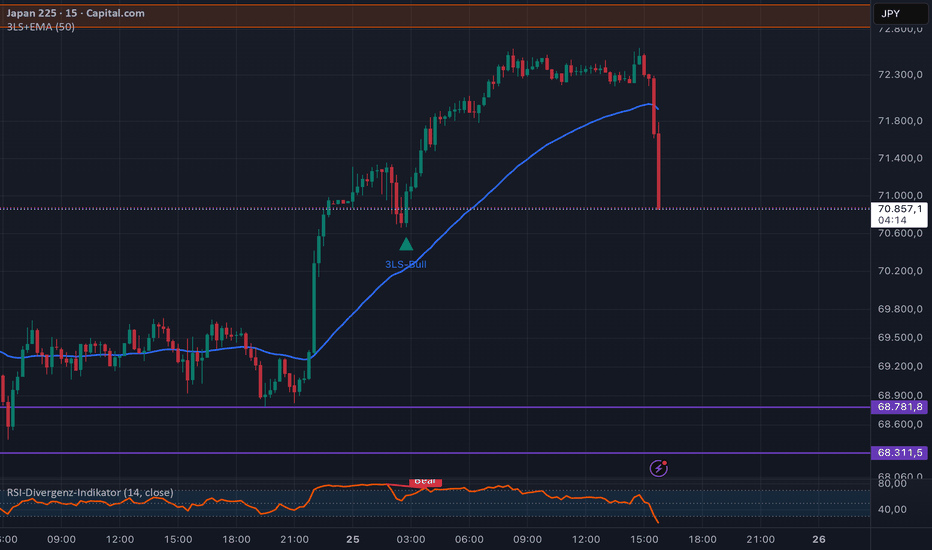
Multi Trend Score OscillatorsOscillators Multi Trend score
Part 1: How the Indicator Works Under the Hood
//The script evaluates the market using three independent concepts: Trend Direction, Momentum, and Market Regime (Volatility). It works on a strict point system that ranges between a maximum bullish score of +2.0 and a maximum bearish score of -2.0.
Trend Filter (Moving Averages): Max +/- 1.0 Point
It checks a fast 15 EMA and a slower 50 EMA.
Bullish (+1.0): If the 15 EMA is above the 50 EMA and the price is trading above the 15 EMA.
Bearish (-1.0): If the 15 EMA is below the 50 EMA and the price is trading below the 15 EMA.
Momentum Filter (MACD): Max +/- 1.0 Point
It analyzes the MACD line, Signal line, and Zero line.
Bullish Points: Gets +0.5 if the MACD line is above the Signal line, and another +0.5 if the MACD line is above the center zero line.
Bearish Points: Loses -0.5 if the MACD line is below the Signal line, and another -0.5 if the MACD line is below zero.
The Gatekeeper (ADX Filter)
Before plotting, it checks the ADX (Average Directional Index). If the ADX is below 20, it means the market is ranging, chopping sideways, or dead.
The Penalty: If ADX < 20, it slashes the final score by 75% (trendScore * 0.25). This flattens the wave near zero, saving traders from getting chopped up in range-bound markets.
Indicator Overview: Multi-Indicator Trend Score (MITS)
MITS is a quantitative dashboard squeezed into a single, clean oscillator pane. It eliminates analysis paralysis by combining Moving Average trends, MACD momentum, and ADX market //regimes into a dynamic Trend Score between -2 and +2.
🔹 Key Features:
//Confluence Scoring: Rather than looking at EMAs and MACD separately, the script calculates their confluence in real time.
ADX Volatility Gatekeeper: When the market enters a low-volume, sideways chop zone (ADX < 20), the script automatically flattens the scoring engine by 75%. This prevents false //breakout signals.
Clean Visuals: Smooth area-gradient fill anchors to a zero-line baseline. Bright Green represents aggregate bullish confluence; Deep Red highlights aggregate bearish confluence.
How to Trade It:
Score > 1.0: Strong Bullish Confluence. Look for long entries or ride the trend.
Score < -1.0: Strong Bearish Confluence. Look for short entries or protect capital.
Flatline / Near Zero: The market is either flipping trends or trapped in a low-volatility chop zone filtered by the ADX. Sit on your hands.
อินดิเคเตอร์

อินดิเคเตอร์

อินดิเคเตอร์

อินดิเคเตอร์