 IREN— HIEQ Model
TQ Analysis | How High Could We Climax on This TS Map Now? 📈
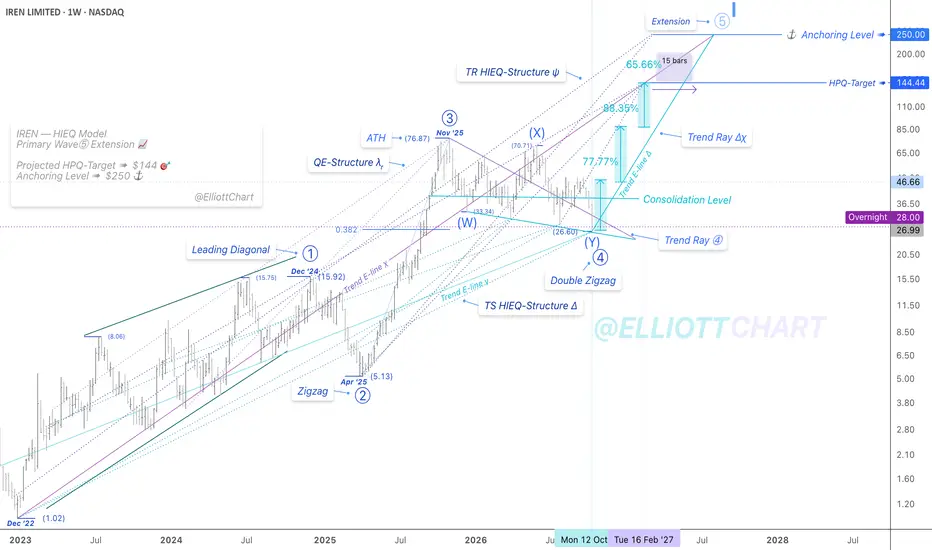
As illustrated on this weekly chart, I’ve refined the evolving HIEQ Model to reflect the recent price reaction, with the pullback now interacting with the Transition-Support Trend Ray ⓸ across the zone of convergence.
The consolidation phase of Primary Wave ⓸ has now unfolded into a Double Zigzag (W)–(X)–(Y), retracing toward the 0.382 Fibonacci level—a common retracement zone for fourth waves within an impulsive sequence.
As you may see on the chart, the Support E-line of the TS Trend Ray ⓸ has now preserved the price structure on four separate occasions, while the broader Cycle-degree Wave I trend remains under evaluation.
I’ve also shifted the Trend Ray Advance to a new timeline to reflect the evolving HIEQ Structures, while the HPQ Target ➤ $144 🎯 remains unchanged.
The projected Primary Wave ⓹ could potentially extend further, with the ultimate climax approaching the defined HP Anchoring Level ➤ $250 ⚓️.
🔖 HIEQ Model ➠ Highly Integrated & Entangling Quantum Model
#StrategicAnalysis #TrendAnalysis #MarketInfrastructures
#FutureVision #TimeSpaceMap #TSMap

İlgili yayınlar
Feragatname
Bilgiler ve yayınlar, TradingView tarafından sağlanan veya onaylanan finansal, yatırım, alım satım veya diğer türden tavsiye veya öneriler anlamına gelmez ve teşkil etmez. Kullanım Koşulları bölümünde daha fazlasını okuyun.
İlgili yayınlar
Feragatname
Bilgiler ve yayınlar, TradingView tarafından sağlanan veya onaylanan finansal, yatırım, alım satım veya diğer türden tavsiye veya öneriler anlamına gelmez ve teşkil etmez. Kullanım Koşulları bölümünde daha fazlasını okuyun.