
Yield Curve Inversion IHS Breakout - Recession Warning
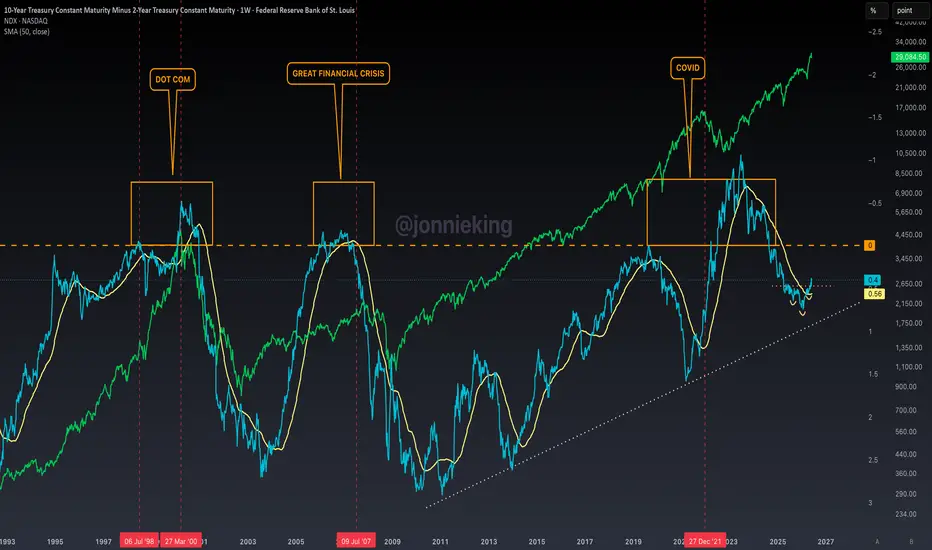
MORE RECESSION INDICATORS FLASHING 🚨
The Yield Curve Inversion chart appears to have broken out of an Inverse Head & Shoulders pattern reclaiming the 50MA.
Note the constant higher lows and higher highs since this trend started making its way back to inversion in 2011.
probably nothing 👀
The Yield Curve Inversion chart appears to have broken out of an Inverse Head & Shoulders pattern reclaiming the 50MA.
Note the constant higher lows and higher highs since this trend started making its way back to inversion in 2011.
probably nothing 👀

İlgili yayınlar
Feragatname
Bilgiler ve yayınlar, TradingView tarafından sağlanan veya onaylanan finansal, yatırım, alım satım veya diğer türden tavsiye veya öneriler anlamına gelmez ve teşkil etmez. Kullanım Koşulları bölümünde daha fazlasını okuyun.
İlgili yayınlar
Feragatname
Bilgiler ve yayınlar, TradingView tarafından sağlanan veya onaylanan finansal, yatırım, alım satım veya diğer türden tavsiye veya öneriler anlamına gelmez ve teşkil etmez. Kullanım Koşulları bölümünde daha fazlasını okuyun.