Tesla Inc. (TSLA) – 15M Analysis
Broader Market Structure
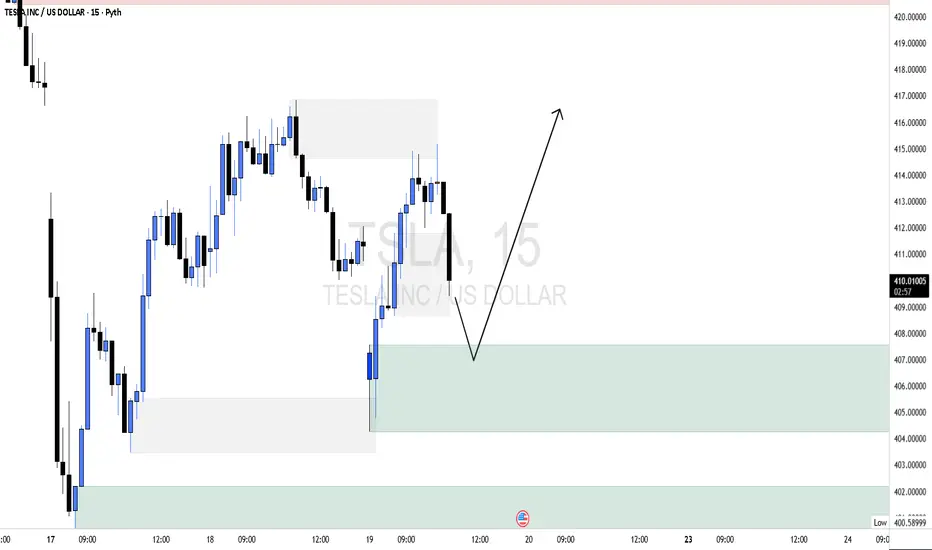
On the 15-minute timeframe, structure is currently short-term bearish within a broader intraday range.
Price previously rallied into the 415–416 region and failed to break higher. From there, we saw a clear impulsive move down that broke minor internal support around 412.00, confirming a Break of Structure (BOS) to the downside on the intraday level. That BOS suggests short-term continuation lower rather than immediate upside expansion.
There has been no confirmed Change of Character (CHoCH) yet because price has not broken above the most recent lower high near 414.50–415.00. Until that level is reclaimed with strength, sellers control the short-term order flow.
Supply and Demand Context
The supply zone around 414–416 is reactive. Price previously dropped sharply from this level, showing clear rejection and strong seller presence. The wicks and bearish follow-through confirm this is a valid supply area and not yet invalidated.
The demand zone between 404–408 is more significant. Buyers stepped in with strength previously, producing strong bullish displacement candles from that region. The reaction was aggressive and clean, which suggests real demand rather than weak consolidation. However, repeated testing will weaken it, so the quality of the next reaction matters.
Price Action in the Marked Region
Price is currently pulling back from the 414 area and moving toward the upper boundary of the marked demand zone around 407–408. The recent bearish candles are relatively strong compared to the prior bullish grind, indicating momentum is shifting back toward sellers short-term.
Your projected path suggests a dip into demand (around 406–407) followed by a strong bounce toward 416–418. Technically, this is valid if demand produces strong bullish displacement and price forms a higher low structure.
If price taps the 404–408 zone and forms a strong bullish engulfing candle or long lower wick rejection, followed by a break above 414.50, that would confirm a CHoCH and shift bias bullish.
However, if price breaks and holds below 404.00, the demand zone fails and downside opens toward 400.50 (recent low). That would invalidate the bullish bounce thesis.
Trade Bias
Current bias: Bearish into demand, conditional bullish at 404–408
Expected move: Pullback into demand, then potential bounce if buyers defend aggressively.
Invalidation level for bullish scenario: Sustained acceptance below 404.00.
Momentum & Confirmation
Momentum currently favors sellers in the immediate term due to the recent BOS and expanding bearish candles. For upside confirmation, we need:
Strong rejection wicks at demand
A bullish engulfing candle
Break above 414.50
Without that structure shift, upside remains corrective.
Broader Market Structure
On the 15-minute timeframe, structure is currently short-term bearish within a broader intraday range.
Price previously rallied into the 415–416 region and failed to break higher. From there, we saw a clear impulsive move down that broke minor internal support around 412.00, confirming a Break of Structure (BOS) to the downside on the intraday level. That BOS suggests short-term continuation lower rather than immediate upside expansion.
There has been no confirmed Change of Character (CHoCH) yet because price has not broken above the most recent lower high near 414.50–415.00. Until that level is reclaimed with strength, sellers control the short-term order flow.
Supply and Demand Context
The supply zone around 414–416 is reactive. Price previously dropped sharply from this level, showing clear rejection and strong seller presence. The wicks and bearish follow-through confirm this is a valid supply area and not yet invalidated.
The demand zone between 404–408 is more significant. Buyers stepped in with strength previously, producing strong bullish displacement candles from that region. The reaction was aggressive and clean, which suggests real demand rather than weak consolidation. However, repeated testing will weaken it, so the quality of the next reaction matters.
Price Action in the Marked Region
Price is currently pulling back from the 414 area and moving toward the upper boundary of the marked demand zone around 407–408. The recent bearish candles are relatively strong compared to the prior bullish grind, indicating momentum is shifting back toward sellers short-term.
Your projected path suggests a dip into demand (around 406–407) followed by a strong bounce toward 416–418. Technically, this is valid if demand produces strong bullish displacement and price forms a higher low structure.
If price taps the 404–408 zone and forms a strong bullish engulfing candle or long lower wick rejection, followed by a break above 414.50, that would confirm a CHoCH and shift bias bullish.
However, if price breaks and holds below 404.00, the demand zone fails and downside opens toward 400.50 (recent low). That would invalidate the bullish bounce thesis.
Trade Bias
Current bias: Bearish into demand, conditional bullish at 404–408
Expected move: Pullback into demand, then potential bounce if buyers defend aggressively.
Invalidation level for bullish scenario: Sustained acceptance below 404.00.
Momentum & Confirmation
Momentum currently favors sellers in the immediate term due to the recent BOS and expanding bearish candles. For upside confirmation, we need:
Strong rejection wicks at demand
A bullish engulfing candle
Break above 414.50
Without that structure shift, upside remains corrective.

"LIVE TRADE" Everyday on youtube.com/@Prosignalai
Feragatname
Bilgiler ve yayınlar, TradingView tarafından sağlanan veya onaylanan finansal, yatırım, alım satım veya diğer türden tavsiye veya öneriler anlamına gelmez ve teşkil etmez. Kullanım Koşulları bölümünde daha fazlasını okuyun.
"LIVE TRADE" Everyday on youtube.com/@Prosignalai
Feragatname
Bilgiler ve yayınlar, TradingView tarafından sağlanan veya onaylanan finansal, yatırım, alım satım veya diğer türden tavsiye veya öneriler anlamına gelmez ve teşkil etmez. Kullanım Koşulları bölümünde daha fazlasını okuyun.