
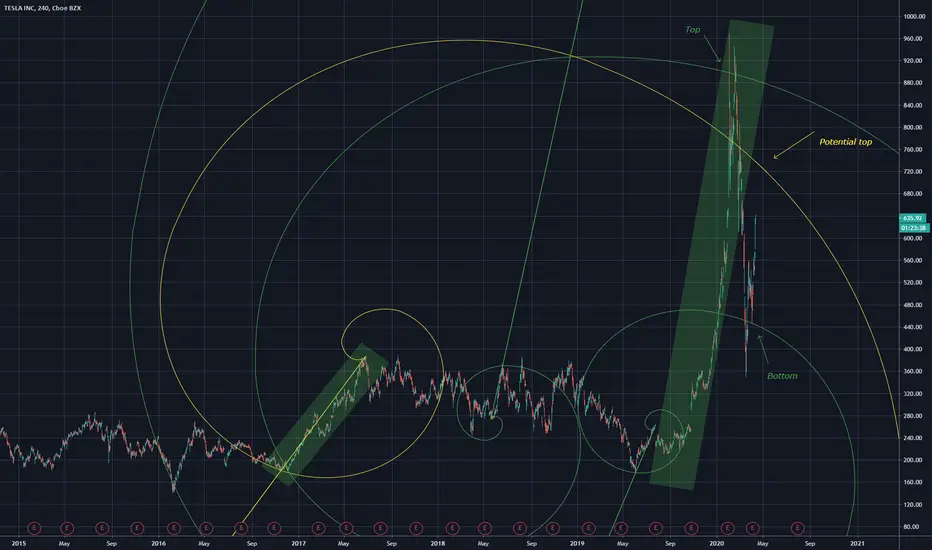
forecasting a potential top using Fibonacci spirals, and outlining how Fibonacci spirals can be used to show tops and bottoms.
For those looking to enter price is currently in a neutral zone, look for a short once the fib line is reached.
Or go long I dont really care.
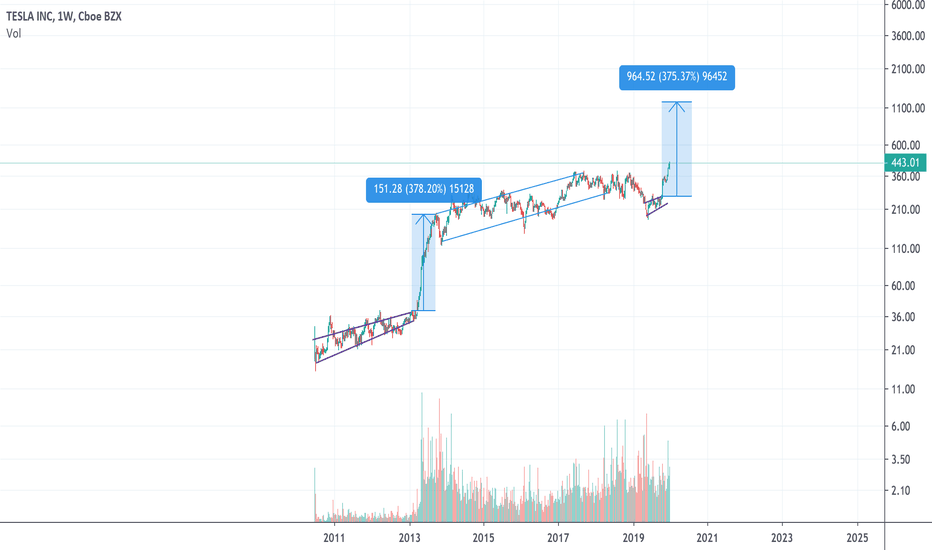
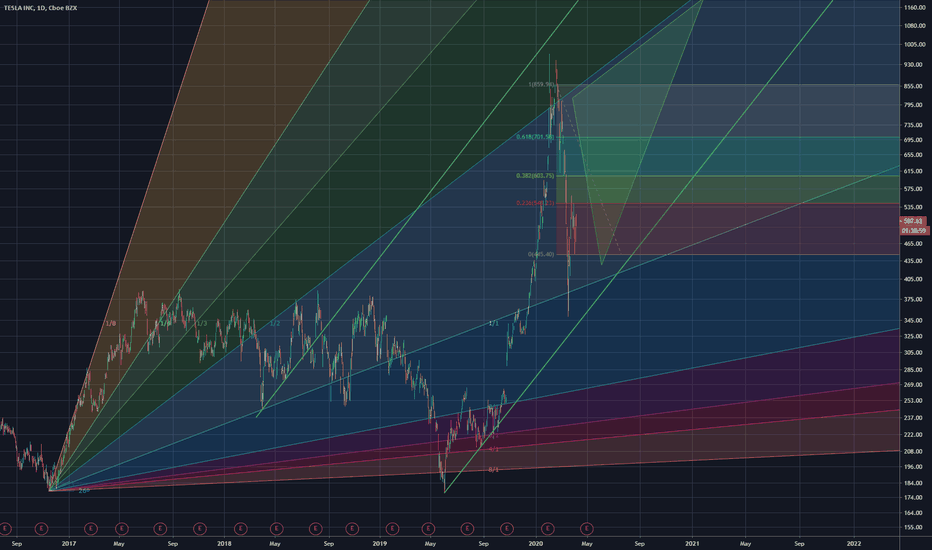
Above chart is a bit iffy, hope someone got some use out of it.
For those looking to enter price is currently in a neutral zone, look for a short once the fib line is reached.
Or go long I dont really care.
Above chart is a bit iffy, hope someone got some use out of it.

Feragatname
Bilgiler ve yayınlar, TradingView tarafından sağlanan veya onaylanan finansal, yatırım, alım satım veya diğer türden tavsiye veya öneriler anlamına gelmez ve teşkil etmez. Kullanım Koşulları bölümünde daha fazlasını okuyun.
Feragatname
Bilgiler ve yayınlar, TradingView tarafından sağlanan veya onaylanan finansal, yatırım, alım satım veya diğer türden tavsiye veya öneriler anlamına gelmez ve teşkil etmez. Kullanım Koşulları bölümünde daha fazlasını okuyun.