
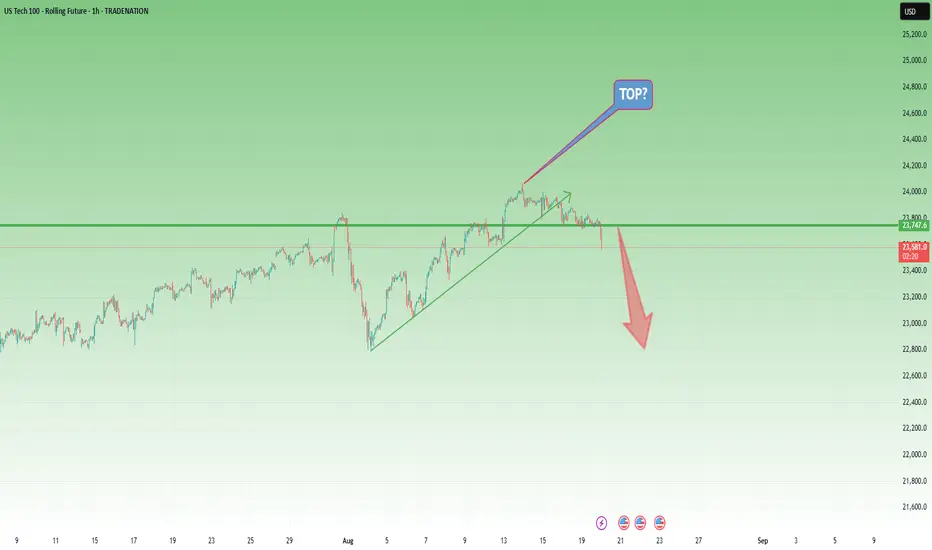
In my past two NAS analyses, I argued that the index was overstretched and vulnerable to a deep correction. Even the fact that from the April bottom to mid-August it surged nearly 50% should have raised big red flags — that kind of move rarely sustains without a meaningful pullback.
At this moment, the technical picture has shifted significantly. The index has broken two critical levels:
1. The ascending trendline drawn from the recent low.
2. The horizontal support defined by the previous all-time high.
Losing both of these supports in quick succession suggests the bullish momentum is fading and a top may already be in place.
If this scenario unfolds as expected, selling pressure could intensify in the coming sessions. My first downside target stands in the 22,700 zone, with further weakness possible if the correction develops into a broader risk-off cycle.
Disclosure: I am part of TradeNation's Influencer program and receive a monthly fee for using their TradingView charts in my analyses and educational articles.

🎯 Want More Trading Ideas?
📈 Join the FREE Forex & Gold Channel
👉 t.me/intradaytradingsignals
💎Get Funded Up to $1 Million with SabioTrade
Use my exclusive link and get 30% OFF your challenge.
👉shorturl.at/b5yyz
📈 Join the FREE Forex & Gold Channel
👉 t.me/intradaytradingsignals
💎Get Funded Up to $1 Million with SabioTrade
Use my exclusive link and get 30% OFF your challenge.
👉shorturl.at/b5yyz
İlgili yayınlar
Feragatname
Bilgiler ve yayınlar, TradingView tarafından sağlanan veya onaylanan finansal, yatırım, alım satım veya diğer türden tavsiye veya öneriler anlamına gelmez ve teşkil etmez. Kullanım Koşulları bölümünde daha fazlasını okuyun.