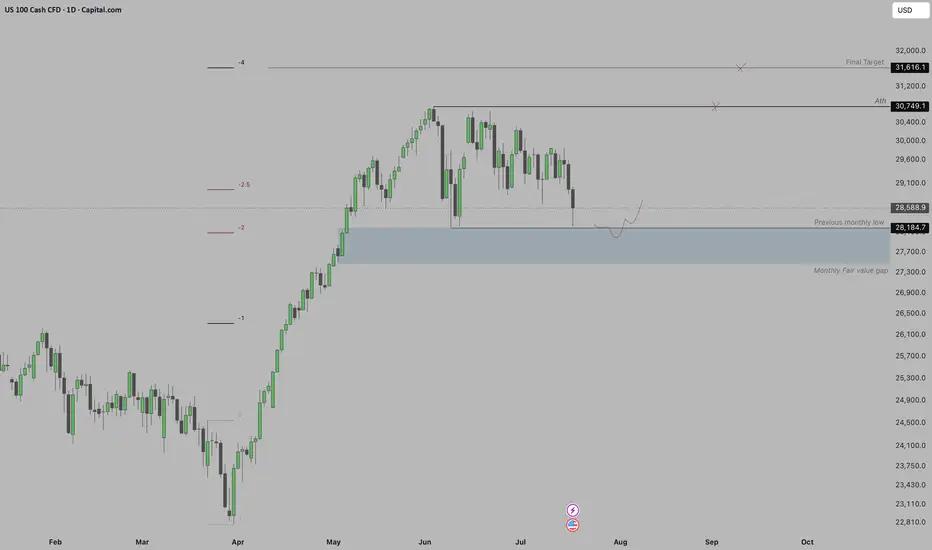
NASDAQ: The Pullback I've Been Waiting For Is HereSometimes the best opportunities come after a healthy pullback, not after chasing a breakout.
NASDAQ has finally reached an area I've been watching for weeks. Price is sitting around the previous monthly low, which also overlaps with an unfilled monthly fair value gap.
In plain English, this is a z
NAS100: Every Bull Market Breathes... But How Deep This Time?NASDAQ has been on a remarkable bull run, successfully achieving multiple targets shared in my previous analysis (attached). But every strong bull market eventually pauses to breathe. Corrections are not a sign of weakness—they are a natural and healthy part of every market cycle.
One of the bigges
US100: Buyers Defend Major Support – Rebound Ahead?US100: Buyers Defend Major Support – Rebound Ahead?
US100 has declined into a major demand zone, an area that has previously attracted strong buying interest. This is the second test of this support, making it a critical level for determining the market's next move.
While the setup offers a poten
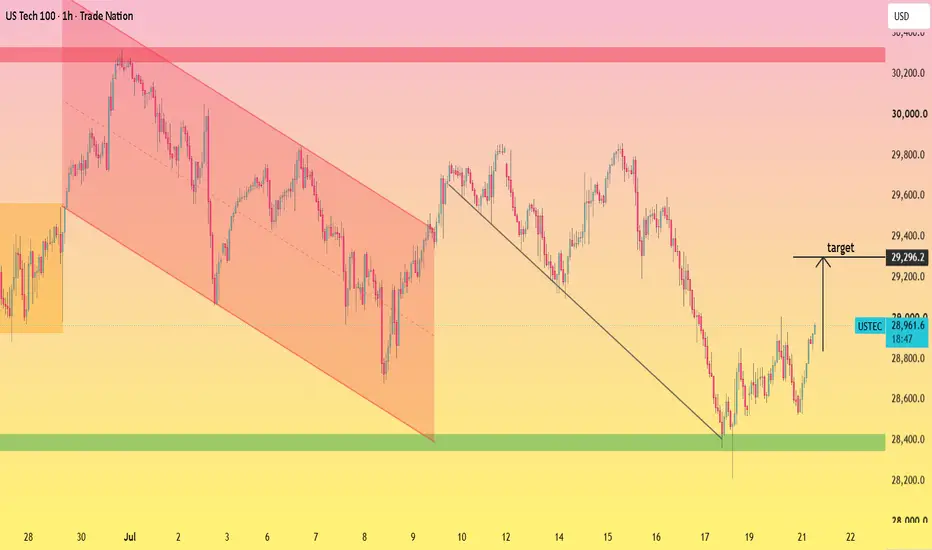
*US TECH 100 BULLISH REVERSAL FROM KEY SUPPORT — TARGET 29,296**
US Tech 100 has formed a strong bullish rebound after testing the **28,400 major support zone**. The price has recovered from the recent sell-off and is now showing increasing buying momentum. A sustained move above the **29,000 psychological level** could open the way toward the marked **29,296 ta
USNAS100 | Decision Zone Before Big Tech EarningsUSNAS100 | Decision Zone Before Big Tech Earnings
Markets are entering one of the most volatile weeks of the quarter, with earnings from major technology companies including Google and several other AI leaders expected to drive sentiment. Their results could determine whether the Nasdaq resumes its
NAS100 — Daily FVG Short Into Monthly DrawStill trading inside a bearish structure — lower highs holding since the June peak.
The daily FVG at 29,061–29,235 is the entry POI. Price retraces into unfilled inefficiency, sellers step back in.
Target is the monthly low at 28,202. That level isn't just external range liquidity — there's a mont
US100 Faces Growing Bearish PressureUS100 remains under strong bearish pressure after failing to break above a long-term descending trendline and repeatedly rejecting major supply zones. The chart continues to print lower highs and lower lows, confirming that sellers remain firmly in control of the broader trend. Recent price action s
NASDAQ Uncanny symmetry with Q1 points to 26800.Nasdaq (NDX) has made three straight 1D candle closings below its 1D MA50 (blue trend-line), confirming that it is on a strong technical medium-term correction course.
The structural base of the pattern since May, resembles that of the beginning of 2026. Megaphone pattern after an initial drop of -
See all ideas
Displays a symbol's value movements over previous years to identify recurring trends.