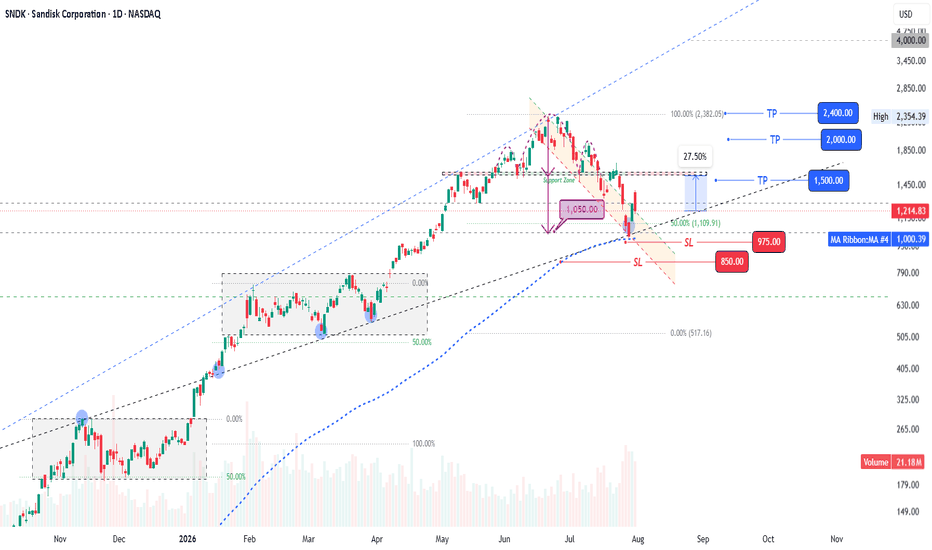
SNDK: Bullish Reversal after 50% correctionSNDK just took heavy correction (50%); Historical correction level for SNDK
However, it has recently reached level of $1050, which has following confluences:
1- Ascending Wedge Bottom Trendline Support
2- Target Completion of HnS pattern
3- A horizontal support level
4- Golden Pocket Fib level
5- 200EMA Support Level
A Powerful confluence zone should be sign of bullish reversal.
Entry now for Short term Trade with target levels of $1500
New Entry for Target Levels of $ 4000 after breakout of $1500 and retest for confirmed breakout.
A tight SL of $975 or a conservative SL of $875 below previous HL ($900)
Keep trailing SL for a complete ride
Ascending Broadening Wedge
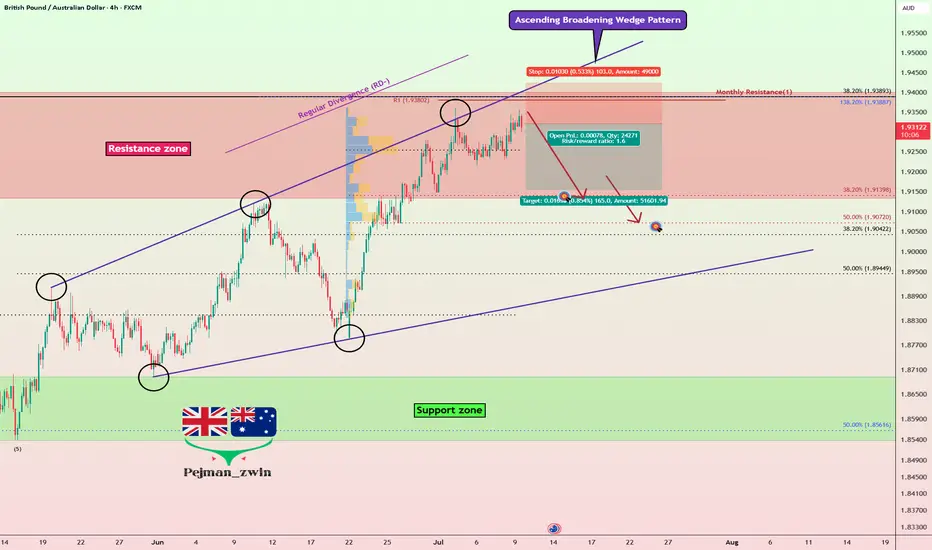
GBPAUD Ascending Broadening Wedge: Is a Short Setup Forming?Today, I want to share a Short opportunity on GBPAUD ( FX:GBPAUD ). Stay with me.
GBPAUD is currently trading around the upper boundary of a resistance zone(1.9400 AUD-1.9133 AUD).
From a classic technical analysis point of view, the chart seems to be forming an Ascending Broadening Wedge pattern. Since the third peak has formed within the resistance zone(1.9400 AUD-1.9133 AUD), we might be facing at least a downward correction.
Also, we can see a negative Regular Divergence(RD-) between two consecutive peaks.
I expect GBPAUD to decline toward at least 1.9155 AUD, and if selling momentum increases, we could see a deeper drop.
First Target: 1.9155 AUD
Second Target: 1.9080 AUD
Stop Loss(SL): 1.9423 AUD
What’s your view on GBPAUD? Do you think it can break above the resistance zone(1.9400 AUD-1.9133 AUD) or not?
💡 Please respect each other's opinions and express agreement or disagreement politely.
📌British Pound/ Australian Dollar Analyze (GBPAUD), 4-hour time frame.
🛑 Always set a Stop Loss(SL) for every position you open.
✅ This is just my idea; I’d love to see your thoughts too!
🔥 If you find it helpful, please BOOST this post and share it with your friends.
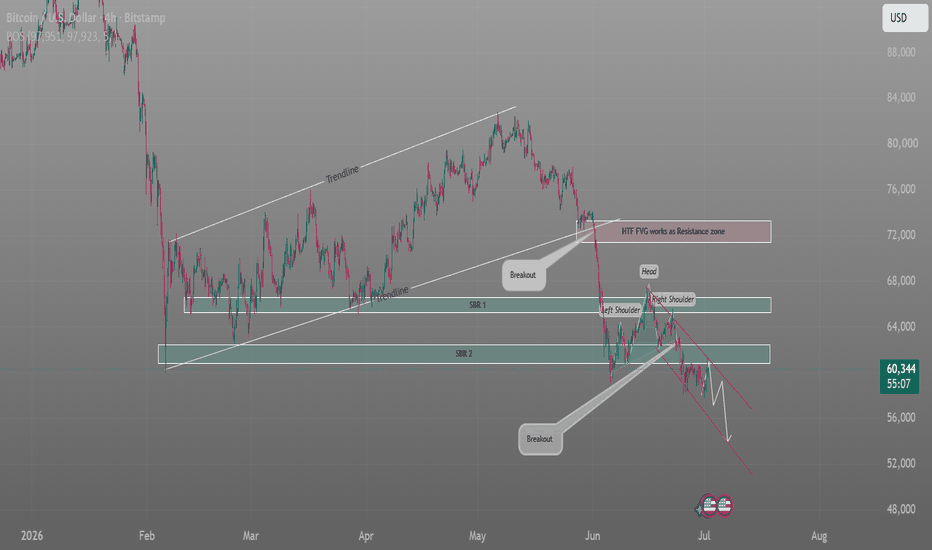
BTCUSD Warning Signs: Multiple Supports Flip to Heavy Resistance 1. The Broad Structure: Trendline Breakout
Ascending Channel / Wedges: From February through May, Bitcoin was trading within an upward-sloping trend channel, forming higher highs and higher lows.
The First Breakout: In early June, the price broke down aggressively below the lower supporting trendline. This marked a major shift in market character from bullish to bearish.
2. Support Turned Resistance (SBR) Zones
The analyst has highlighted two key horizontal price shelves labeled SBR 1 and SBR 2 (Support Become Resistance):
SBR 1 (approx. $65,500 – $66,500): This area acted as a reliable floor during March and April. Once the trendline broke in June, the price fell straight through this level.
SBR 2 (approx. $61,500 – $62,500): A secondary support zone that previously held the lows in February and April.
3. The Bearish Continuation: Head & Shoulders
Following the initial crash in June, the market attempted a relief rally, which formed a textbook Head & Shoulders (H&S) distribution pattern right under the old support zones:
Left Shoulder & Head: Formed as the price tried to reclaim the SBR 1 zone but failed, validating it as strong overhead resistance.
Right Shoulder: A lower peak that ran directly into the HTF FVG (Higher Time Frame Fair Value Gap) resistance zone around $72,000 before reversing.
The Second Breakout: The "neckline" of this H&S pattern aligned closely with SBR 2. The chart points out a second major Breakout where the price snapped below this line.
4. Current Market Position & Outlook
Descending Channel: Bitcoin is currently trapped in a steep, downward-sloping red channel.
Current Price: The price is hovering around $60,328, trading below both major SBR zones.
Projected Path: The white projection line suggests further downside momentum within the red channel, targeting the mid-to-low $50,000s before a potential bottom or deeper consolidation.
Summary
The chart paints a strictly bearish narrative. The bulls failed to hold major historical support zones, and the market has validated those old floors as new ceilings. Until BTC can break out of the descending red channel and reclaim SBR 2, the path of least resistance remains down.
USD/JPY : Ascending Wedge Breakout & Support retestTechnical Breakdown & Observations
1. Historical Price Action & Range
Range Bound Phase: Between March and May, the price consolidated within a horizontal box structure labeled "Range bound" roughly between the 157.000 and 160.500 levels.
Resistance Zone: A prominent pink horizontal banner marks a historical resistance area labeled "STF RBS" (Resistance Become Support).
2. Chart Patterns & Breakout
Ascending Channel/Wedge: Following the range-bound phase, the price formed an aggressive upward trajectory bounded by two parallel white dashed lines. The chart notes label this structure as an "Ascending wedge" (or an ascending channel).
The Breakout: The price has cleanly broken out above the upper boundary of this ascending structure and the main blue macro-trendline. This event is highlighted by a callout bubble labeled "Breakout".
Support Retest: A small horizontal teal box labeled "Support" highlights that the old resistance line is currently being tested as new support. The drawn purple projection arrow anticipates a minor consolidation/retest at this support level before pushing higher.
3. Target Projection
Target Level: 162.880
Rationale: As indicated by the text overlay on the chart, the upside target is determined by projecting the width/height structure of the ascending channel upward. The purple path predicts a continuation toward this horizontal target line.
Summary of the Market Sentiment
The chart depicts a strongly bullish outlook for USD/JPY. The successful breakout above both a major historical resistance zone and the top of a steep ascending channel suggests strong buying momentum, with technical indicators pointing toward an immediate target of 162.880 once the current support retest is secured.
Kotak Bank at Key Short-Term Support ZoneKotak Bank: Trading Near Key Support Zone
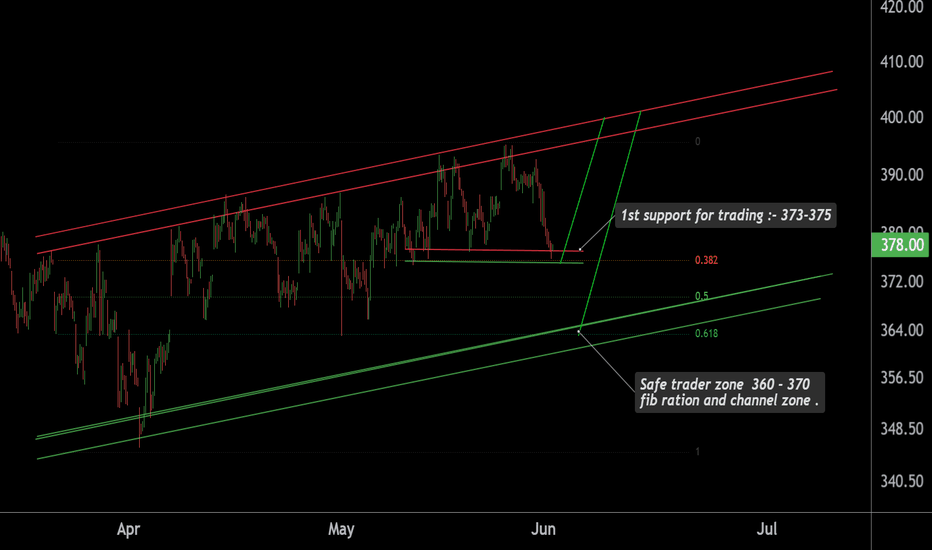
This is the 1-hour timeframe chart of Kotak Bank. The stock is moving within a well-defined parallel channel, with strong support levels aligned with key Fibonacci retracement zones.
Support Zones:
Aggressive Traders: ₹372 – ₹375
Safe Traders: ₹360 – ₹365 (Parallel Channel Support + Fibonacci Golden Ratio)
Upside Targets:
Target 1: ₹400
Target 2: ₹405
As long as the stock remains within the channel structure, the overall setup stays positive. The upper boundary of the channel may act as a resistance zone near the target range.
Trade with proper risk management and wait for confirmation around support levels.
Thank You.
is HYPE (hyperliquid) overbought? -SHORT-🙋♀️🙋♂️😃🌍🐮 Hello all 🙋♀️🙋♂️😃🌍🐮
I would like to say I am overall still bearish 🐻🐻❄️🐨🐼 on the market for now as bitcoin fell below a key price of 77k and has continued to fall, I have had my eyes set on 59k BTC price for a couple of months now to finish out the perfect bear market (see previous ideas for more information)
HYPE reached a new ATH of 67 dollars during the crashing market today which is impressive and perpetual futures trades have seen billions of dollars worth of volume. That being said, I believe it is extremely overpriced in a bearish market and is due for a correction.
My target is on .618 fib retracement of its most recent bullish impulse (around 49 dollars as a target) this also market the spot of a longstanding trendline support.
On the 4 hour chart the price has created a broadening ascending wedge , with large wicks near the top of the structure,
Lets see ⏰🤸♂️🐳 this has potential to be a nice short but remember
👇👇👇👇👇
Always have a stop loss ✋🛑💲 set🆗
This is not financial advice
Any thoughts 💭💡, questions 🙋♀️🙋♂️❓, good 👍, bad👎, happy 😄 or sad 😥, in the comments always welcome.😄
Thank you so much ⭐
Jazerbay ☯️
Taking Profit on BTC Shorts; Looking to Get Tiny Long ExposureOriginally Posted: 02/05/2026
Reposted For Compliance: 02/13/2026
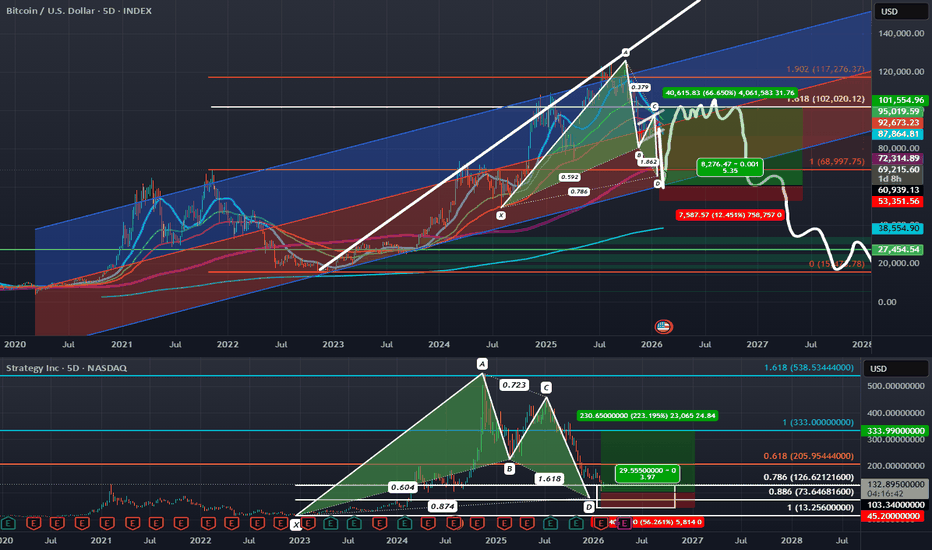
BTC and MSTR are at potential PCZs of Bullish Gartley; The two assets moved down leading to MSTR earnings and negative unrealized losses expectations. I do think that BTC will ultimately move back down, but from where it is now, looking at all of the downside short leverage that has been building at these lower levels, I think there is a high chance of it short squeezing to the upside and for it to be fast and violent move up to around 90-106k before then confirming a lower high and going back down to even lower lows in a fashion similar to the green projection I have drawn out. Meanwhile we could see MSTR pump back to around $200. In this scenario I would see these pumps as nothing more than Bear Cat Bounces and would be looking to reenter my shorts on these bounces where we could then continue the main bearish trade. Here is a link to a chart of the original underlying bearish trade :
The short squeeze we could be set up for is something similar to what we got near the end of 2019 where BTC was in a bear trend but rallied 40% in 2 days within that bear trend before continuing much lower into 2020. Here is the chart focused around that time period:
At the time it was the greatest BTC short squeeze in the history of the asset yet despite how great it was it still ultimately went lower later so I will be on the lookout for this kind of movement once more as short positions accelerate not only at the bullish trendline but also at the PCZ of Bullish Gartleys on both MSTR and BTC.
I suspect MSTR could pump 20-40% from the PCZ and in terms of BTC I think we will get price action similar to what I have projected in the white brush marker.
I actually posted this last week but it was taken down by a mod so this is a repost which should now be compliant enough for them; Since then, BTC pumped 15% and MSTR is up over 20% but we have since pulled back decently towards the entry zone so there may be way more upside to go from here. However; I have mainly reposted this for archival purposes.
On a side note CLSK, another crypto miner looks like it could be set to rise from it's 0.886 PCZ of a Bullish Bat around 10 dollars all the way back up to around 18 dollars.
Bitcoin simple bullish harmonics/trend lines/corrections~1W VIEWHello all!
🙋♀️🙋♂️🌍☯️🗻
Thanks for coming today. This post is just simple TA and we see here a long term ASCENDING channel for bitcoin. Inside the wedge are 2 bullish harmonics formed over months along with post bear 🐻 market 💹 correction descending channels.
🌊🤸🤸♂️
Our current situation looks a lot like 2022 after the bear market we correct for a month or two.
No big deal. We can look to aim at a new ATH if past trends continue possibly bullish 🐂🎯 by April.
This is just an idea.
This is not financial advice
🐶
Always have a stop loss ✋🛑💲 set🆗
Any thoughts 💭💡, questions 🙋♀️🙋♂️❓, good 👍, bad👎, happy 😄 or sad 😥, in the comments always welcome.😄
Jazerbay ☯️
TMPV – Pattern Formation on ChartThis is the 1-hour timeframe chart of TMPV.
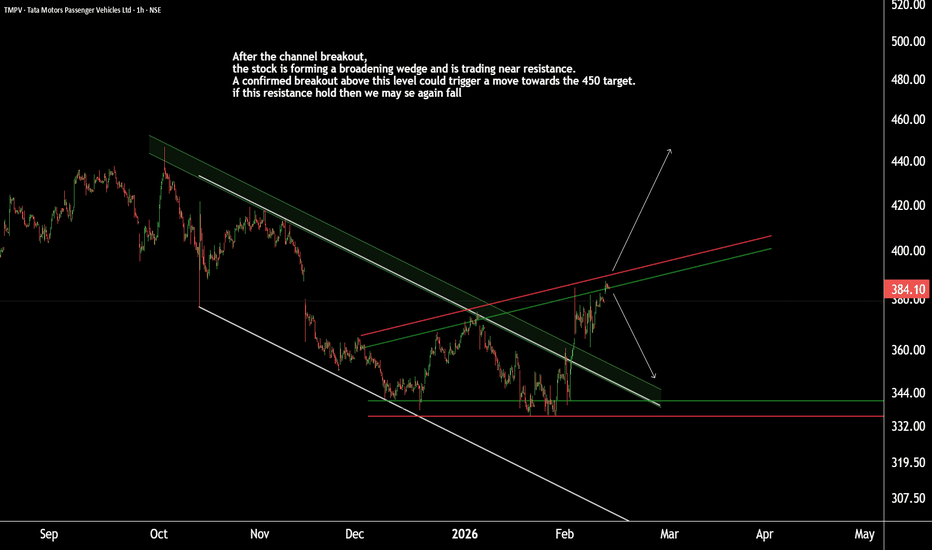
After the channel breakout, the stock is forming a broadening wedge and is currently trading near resistance.
A confirmed breakout above this level ( 390 ) could trigger an upside move towards the 450 target. However, if the resistance holds, the stock may witness another corrective decline.
Major support is placed near the 335 level.
Thank You ..
Breaking: Broadcom Inc. (AVGO) Surged 11% Yesterday Eyeing $500 Broadcom Inc. (NASDAQ; NASDAQ:AVGO ) shares saw a noteworthy uptick of 11% in extended market trading further extending the gains to todays premarket session up by 2.34%.
Should the stock break the ceiling of the $388 resistant zone, coupled with the RSI at 61, a bullish move to the $500 resistant is feasible and possibly $700 before the year runs out.
Similarly, failure to pull that stunt from NASDAQ:AVGO might resort to a move to the $250 support point.
With earnings slated for December 11th, 2025, In 2024, Broadcom's revenue was $51.57 billion, an increase of 43.99% compared to the previous year's $35.82 billion. Earnings were $5.90 billion, a decrease of -58.14%.
Analyst Summary
According to 28 analysts, the average rating for AVGO stock is "Strong Buy." The 12-month stock price target is $353.86, which is a decrease of -6.38% from the latest price.
About AVGO
Broadcom Inc. designs, develops, and supplies various semiconductor devices and infrastructure software solutions worldwide. The company operates in two segments, Semiconductor Solutions and Infrastructure Software. It provides Ethernet switching and routing custom silicon solutions, optical and copper physical layer devices, and fiber optic transmitter and receiver components; set-top box system-on-chips (SoCs), data over cable service interface specifications cable modem and networking infrastructure.
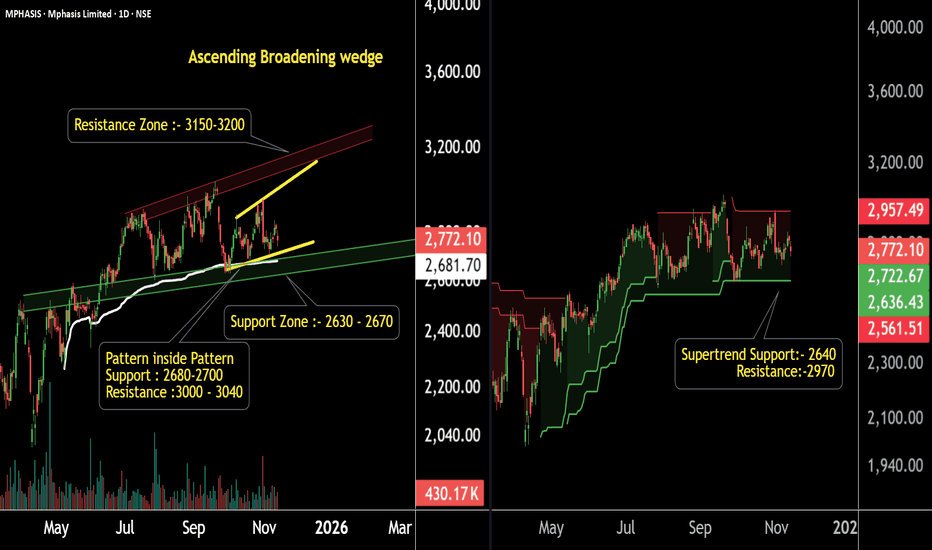
Mphasis Technical Levels for Smart TradingThis is the daily timeframe chart of Mphasis.
Mphasis is moving within a well-defined market structure and is forming a pattern inside a pattern.
The major support zone lies between ₹2630–₹2670, while the smaller internal pattern is taking support near ₹2670–₹2700.
The Supertrend indicator is also positive, with Supertrend support positioned around ₹2640.
If these levels sustain, we may witness higher prices in Mphasis.
Thank you !!
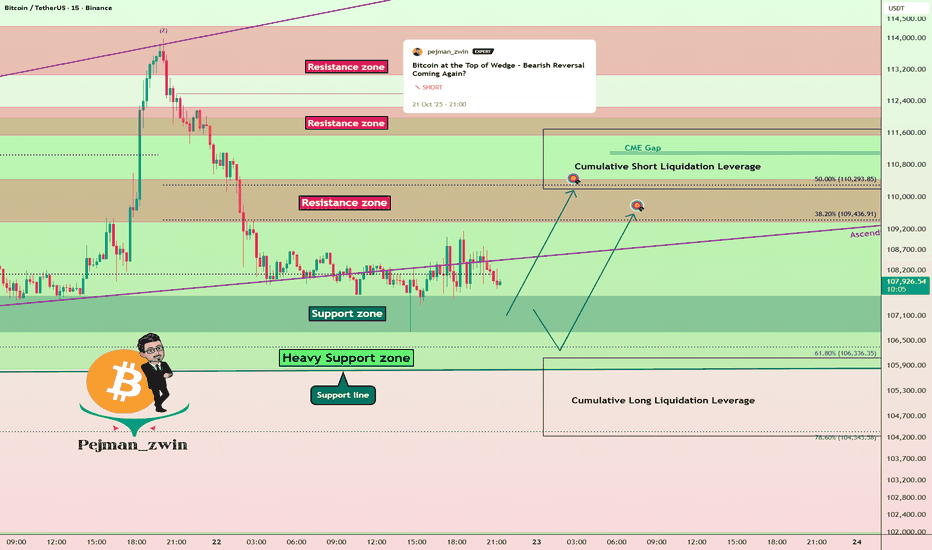
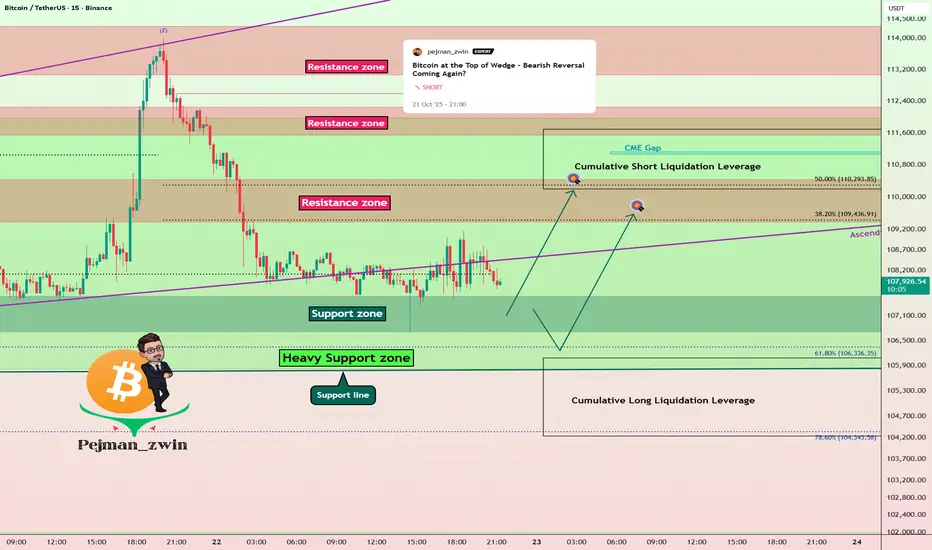
Bitcoin Short Term Setup – One More Push Before Fall?As I expected in yesterday’s idea , Bitcoin( BINANCE:BTCUSDT ) dropped down into the lower ranges of the Heavy Support zone($111,980-$105,820) .
Today, I want to share a quick 15-minute timeframe analysis with you.
Currently, Bitcoin is moving near that Support zone($107,580-$106,700) , but it hasn’t managed to break the lower line of the ascending broadening wedge pattern with strong momentum .
So I expect Bitcoin might at least make another move up to the Resistance zone($110,430-$109,380) . If BTC finds a Short Trigger near the Resistance zone and Cumulative Short Liquidation Leverage($111,687-$110,198) , it could drop sharply afterward, potentially breaking the Heavy Support zone eventually.
Cumulative Long Liquidation Leverage: $106,090-$104,234
Stop Loss(SL): $104,077
Please respect each other's ideas and express them politely if you agree or disagree.
Bitcoin Analysis (BTCUSDT), 15-minute time frame.
Be sure to follow the updated ideas.
Do not forget to put a Stop loss for your positions (For every position you want to open).
Please follow your strategy and updates; this is just my Idea, and I will gladly see your ideas in this post.
Please do not forget the ✅' like '✅ button 🙏😊 & Share it with your friends; thanks, and Trade safe.
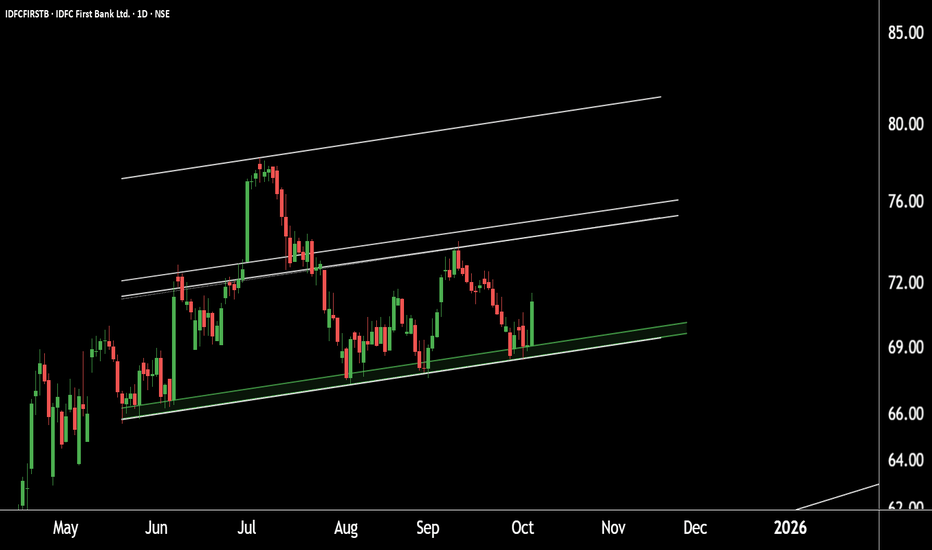
IDFC First Bank Holding Firm — Buyers Defending Key LevelsIDFC First Bank – Daily Chart Analysis
Timeframe: Daily chart observation.
Price Structure: The stock is trading within a well-defined parallel channel.
Support Zone: Strong support identified near the ₹67–₹69 range.
Upside Target: If the support zone holds, the next potential upside target lies around ₹81–₹82.
Outlook: Sustaining above the support levels may lead to higher prices in the upcoming sessions.
Thank you.
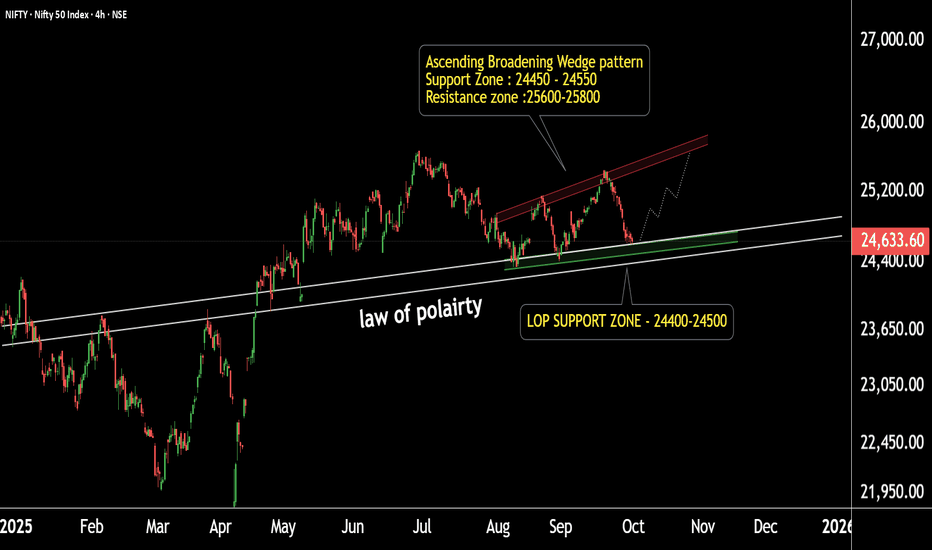
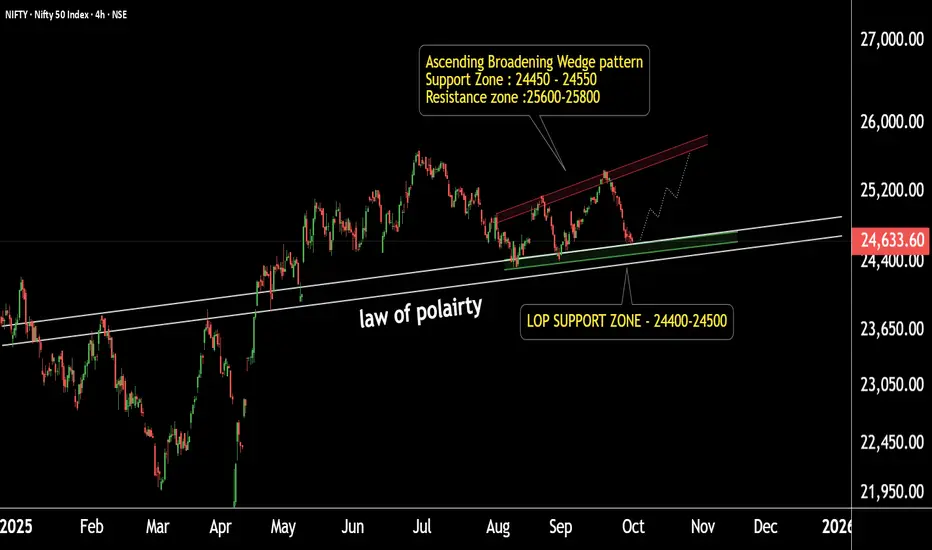
Strong Base Formed ! Nifty Positioned for Explosive Move This is the daily timeframe chart of Nifty 50.
Nifty 50 is sustaining above the LOP support zone around 24,400–24,500. The index has formed an ascending broadening wedge pattern at this support and appears to be completing the last leg of the structure.
Support Zone: 24,500–24,550
Resistance Zone: 25,600–25,800
If the support zone holds, we may see higher prices in Nifty 50 in the coming sessions.
Thank you.
NZDUSD Hits Strong Resistances – Bearish Reversal Ahead?NZDUSD ( OANDA:NZDUSD ) is currently trading near the Resistance zone($0.6000-$0.5958) , Potential Reversal Zone(PRZ) , and Resistance lines .
From a classical technical analysis perspective, NZDUSD seems to be completing the Ascending Broadening Wedge Pattern .
From an Elliott wave theory perspective, NZDUSD seems to have completed the microwave C of the microwave Y of the main wave B . So we should wait for the next bearish waves .
Also, we can see the Regular Divergence(RD-) between Consecutive Peaks .
I expect NZDUSD to drop to at least $0.5890(First Target) .
Second Target: $0.5865
Third Target: $0.5828
Stop Loss(SL): $0.5983
Note: Today's US data release could cause a shock to NZDUSD, but ultimately, NZDUSD will continue its downward trend (at least to the first target).
Please respect each other's ideas and express them politely if you agree or disagree.
New Zealand Dollar/ U.S. Dollar Analyze (NZDUSD), 1-hour time frame.
Be sure to follow the updated ideas.
Do not forget to put a Stop loss for your positions (For every position you want to open).
Please follow your strategy and updates; this is just my Idea, and I will gladly see your ideas in this post.
Please do not forget the ✅' like '✅ button 🙏😊 & Share it with your friends; thanks, and Trade safe.
GSFC chart showing a hidden setup… Is this the breakout moment?GSFC Chart Update (4H Timeframe)
Chart 1:
Stock has formed a symmetrical broadening wedge.
If the stock respects the resistance, there is a possibility of a Head & Shoulders pattern.
Key support zone: 202 – 204.
Chart 2:
GSFC is forming an ascending broadening wedge pattern.
Support lies in the 192 – 195 range.
If this level sustains, potential pattern target is around 240.
Thank You !!
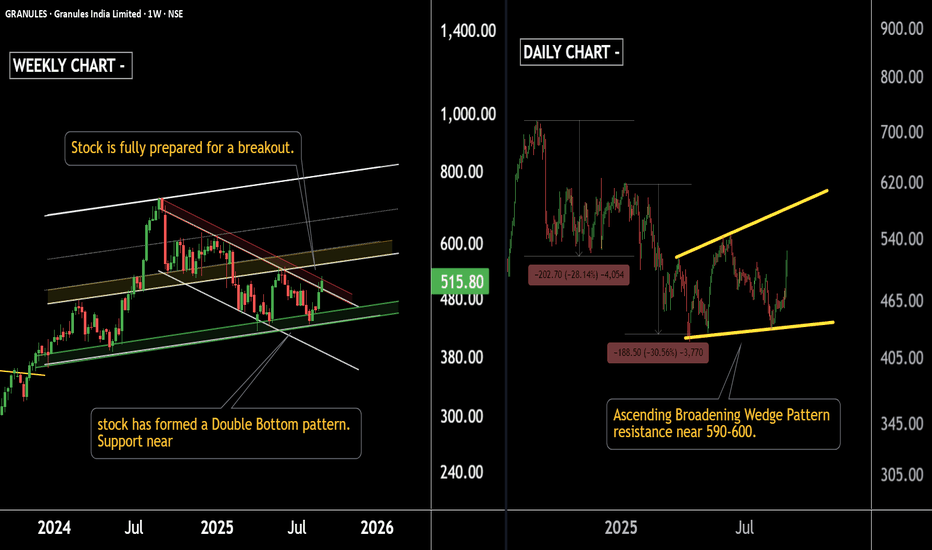
Breakout Alert!Granules India is ready to shine—watch this spaceGranules India Limited – Technical Outlook
Weekly Timeframe
Granules India is moving within a well-defined parallel channel. The stock is currently approaching its middle boundary resistance near 560–590 levels and support near 430-450
On the daily chart, the stock has formed a descending parallel channel, and this time, the chances of a breakout are higher as the price action has developed a double bottom formation.
Daily Timeframe
Additionally, Granules India is forming an ascending broadening wedge pattern, with key resistance near 590 and support around 430, which was successfully tested before making a new high.
Overall, the technical structure indicates strong breakout potential in the near term.
Thank You !!
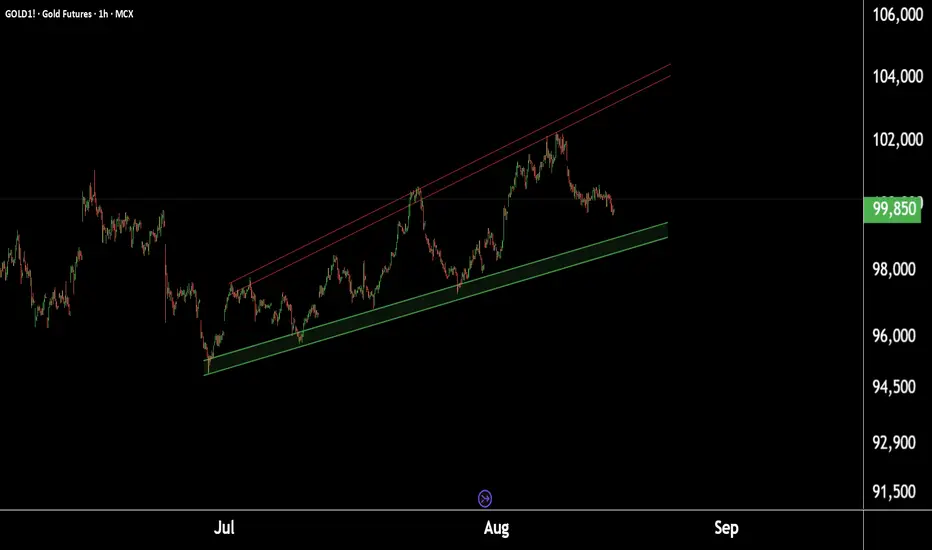
Gold at Crucial Levels – Buy or Sell? Watch These Key Price ZoneDaily Gold Update:
This is the daily timeframe chart of Gold1!.
Gold1! is forming an ascending broadening wedge pattern with support in the ₹98,500–₹98,800 range.
If this support holds, we may see higher prices.
However, if it breaks, Gold1! could decline towards its pattern target near ₹95,000.
Thank You !!
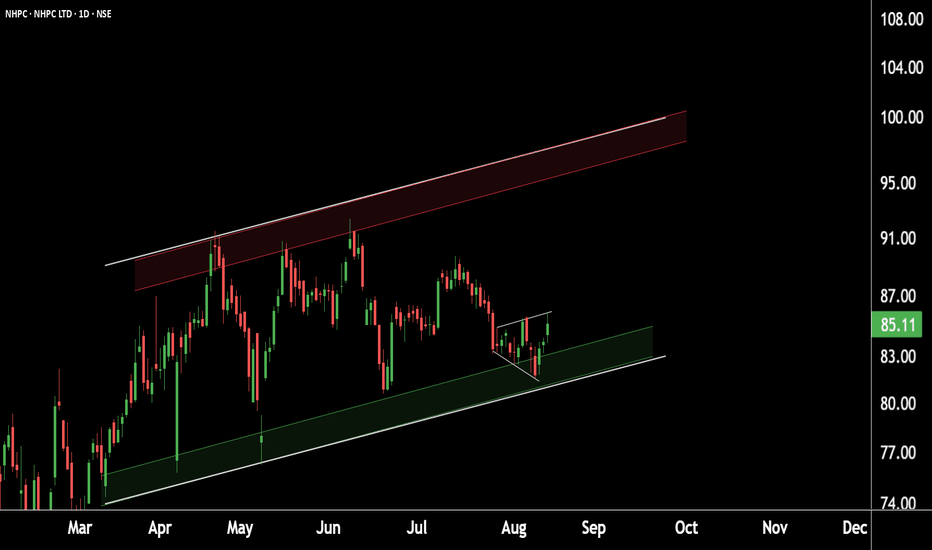
Energizing gains – Initiating NHPC buy.Chart timeframe: Daily chart of NHPC.
Pattern formation: Broadening pattern observed.
Support zone: Currently taking support along the parallel channel in the ₹80–₹83 range.
Price outlook: Sustaining this support zone could lead to higher price levels.
Note: Continue monitoring price action for confirmation.
Thank You !!
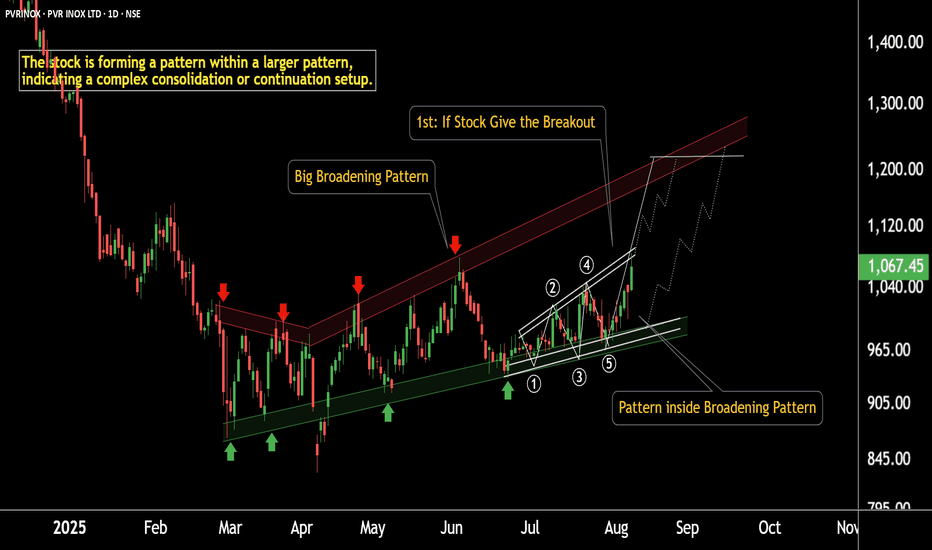
Breakout Alert: PVR Gearing Up for a Strong MoveThis is the daily chart of PVR INOX.
PVRINOX is forming a broadening pattern within a larger broadening structure.
The smaller pattern has a breakout target of ₹1200, which coincides with the major resistance level of the larger pattern.
PVRINOX having a strong support zone near at 970-990 zone.
If this level is sustain then we may see higher prices in PVRINOX.
Thank You !!
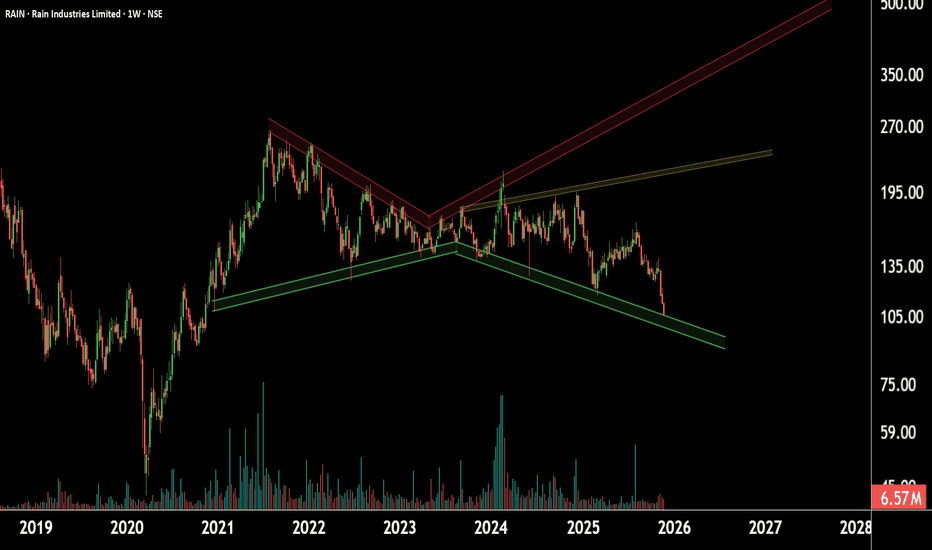
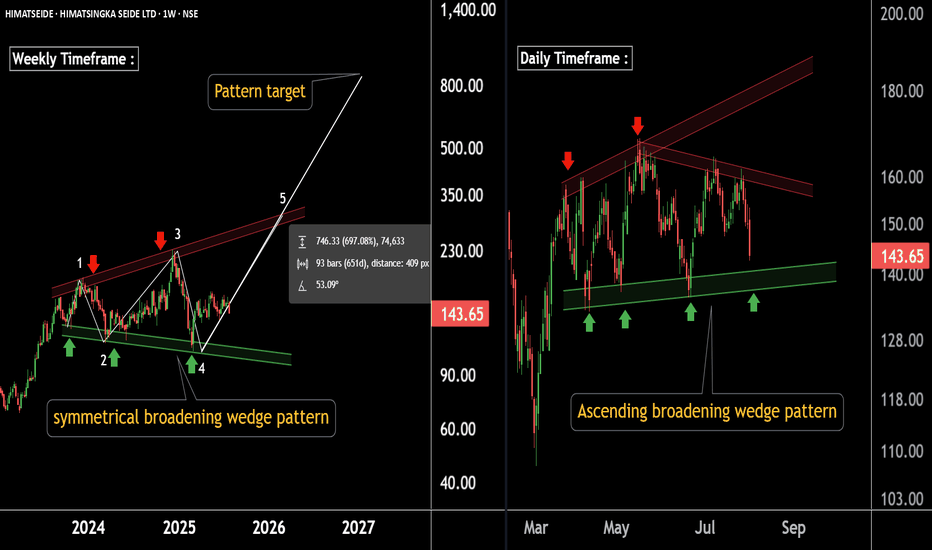
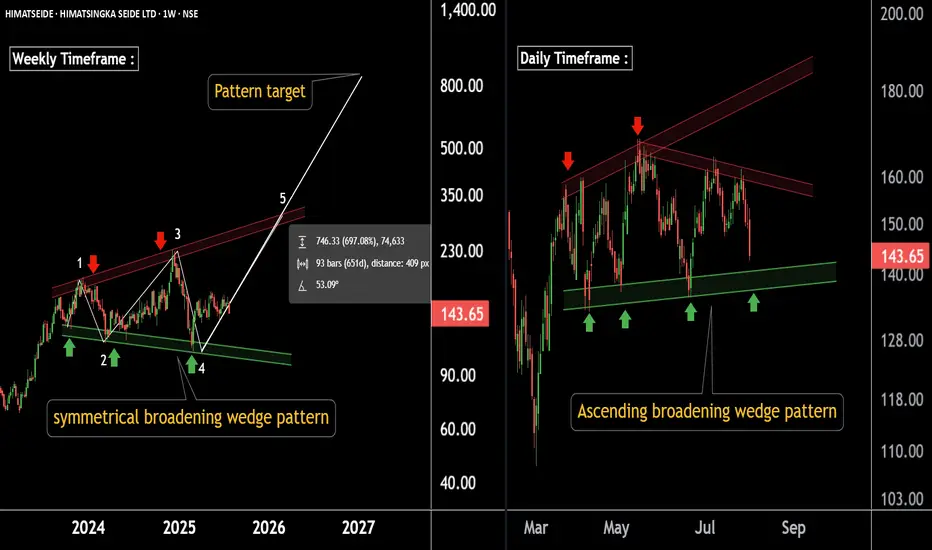
Massive Base Formation on Charts – Potential Multibagger LoadingThere are two Chart of HIMATSINGKA SEIDE.
Himatsingka Seide is forming a symmetrical broadening wedge pattern on the weekly timeframe, with a strong support zone near ₹100.
On the daily timeframe, Himatsingka Seide is forming an ascending broadening wedge pattern, with a crucial support level near ₹135.
If this level is Sustain then we may see higher prices in Himatsingka Seide.
Thank You !!