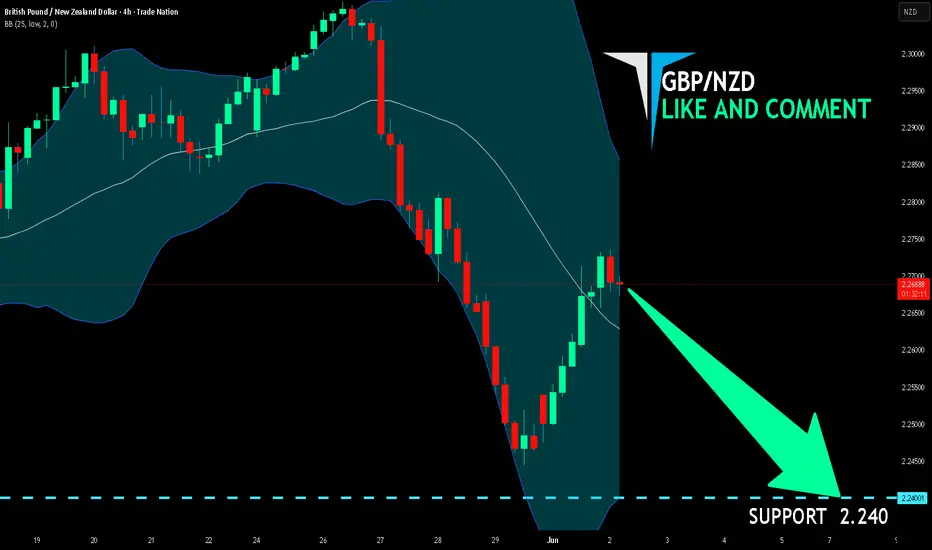
GBP/NZD SELLERS WILL DOMINATE THE MARKET|SHORT
Hello, Friends!
We are now examining the GBP/NZD pair and we can see that the pair is going up locally while also being in a uptrend on the 1W TF. But there is also a powerful signal from the BB upper band being nearby, indicating that the pair is overbought so we can go short from the resistance line above and a target at 2.240 level.
Disclosure: I am part of Trade Nation's Influencer program and receive a monthly fee for using their TradingView charts in my analysis.
✅LIKE AND COMMENT MY IDEAS✅
Bearish Patterns
USDCHF – Bearish Pressure Building at Resistance?USDCHF is approaching a strong confluence zone where the upper bound of its falling wedge pattern intersects with a major resistance zone marked in red. 🔴
This area has already proven its importance multiple times in the past, making it a key decision point for the pair.
As long as this resistance intersection holds, we will be looking for shorts, anticipating another bearish leg lower within the overall corrective structure. 📊
The falling wedge remains intact for now, and sellers continue to defend the upper boundary of the pattern.
A clear rejection from this zone could provide the trigger for the next bearish impulse. ⚡
Will the bears defend resistance once again? 🤔
⚠️ Disclaimer: This is not financial advice. Always do your own research and manage risk properly.
📚 Stick to your trading plan regarding entries, risk, and management.
Good luck! 🍀
All Strategies Are Good; If Managed Properly!
~Richard Nasr
EUR/JPY BEST PLACE TO SELL FROM|SHORT
Hello, Friends!
The BB upper band is nearby so EUR-JPY is in the overbought territory. Thus, despite the uptrend on the 1W timeframe I think that we will see a bearish reaction from the resistance line above and a move down towards the target at around 185.348.
Disclosure: I am part of Trade Nation's Influencer program and receive a monthly fee for using their TradingView charts in my analysis.
✅LIKE AND COMMENT MY IDEAS✅
01/06/26 Weekly OutlookLast weeks high: $78,080.00
Last weeks low: $72,512.49
Midpoint: $75,296.25
Last week was a clean distribution week. Price opened near the weekly high (~$78,080), spent the early week grinding down through the midpoint ($75,296), and printing a triple low to mark the bottom for the week after a large capitulation candle through the 0.25 line.
Critically, the candles we're seeing at the weekly low are not showing a convincing base. There's no wide spread reversal bar, no absorption of supply. Price arrived at the low with momentum still pointing down.
May closed with $2.43 billion in net Bitcoin ETF outflows — the largest monthly outflow of 2026, and the last week alone saw $1.42 billion exit, marking three consecutive weeks of over $1 billion in withdrawals.
The ongoing US-Iran conflict and a higher-than-expected CPI print of 3.8% YoY have sharply reduced Fed rate cut odds, with market pricing now showing a 67% probability of no rate cuts in 2026 at all. That's a brutal environment for Bitcoin, which tends to thrive on easy liquidity.
Bitcoin needs to reclaim 0.25 ($73,869) on a 3-day close to neutralize the bearish setup. A reclaim opens the path to midpoint and then weekly high. Failure to reclaim $73,869 puts the lower channel trendline at $70,342 in play.
The bear case involves a weekly close below the current low ($72,512) and a grind toward $70K. The bull case requires a swift reclaim of $73,904 and a hold there. ETF flow data or geopolitical de-escalation (Iran ceasefire progress) as the catalyst. Until one of those happens, the path of least resistance remains down.
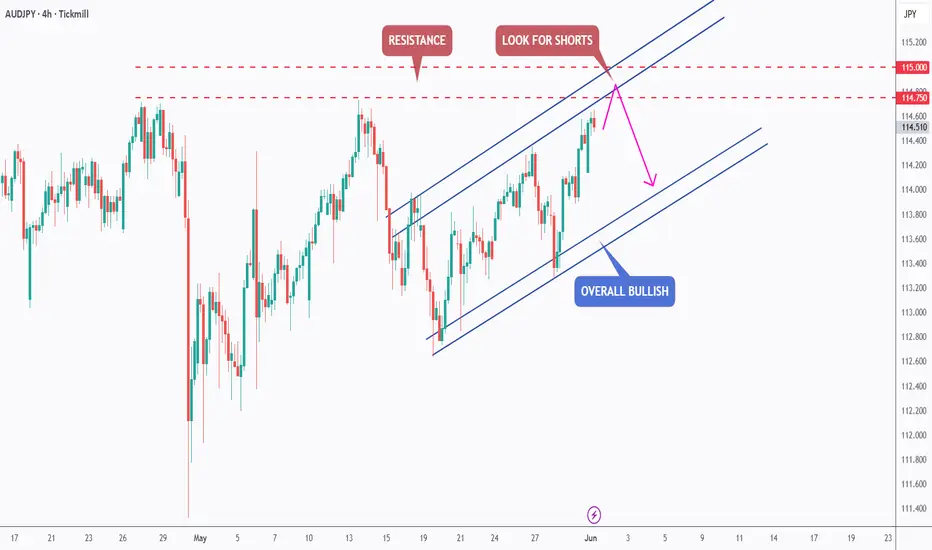
AUDJPY – Overbought at Major Resistance?AUDJPY remains overall bullish, but it is now retesting a strong confluence zone where multiple bearish factors align ⚠️
Price is currently testing the intersection of the resistance zone marked in red and the upper bound of its rising channel, creating what I consider a strong overbought area.
As long as this intersection holds, we will be looking for shorts 📊
A bearish rejection from this zone could trigger a healthy correction toward the middle or lower bounds of the channel before the next major move develops.
Until a confirmed breakout above this resistance cluster occurs, the risk-to-reward favors waiting for bearish setups rather than chasing the rally. 🔍
Will the bears finally force a correction from this overbought zone? 🤔
⚠️ Disclaimer: This is not financial advice. Always do your own research and manage risk properly.
📚 Stick to your trading plan regarding entries, risk, and management.
Good luck! 🍀
All Strategies Are Good; If Managed Properly!
~Richard Nasr
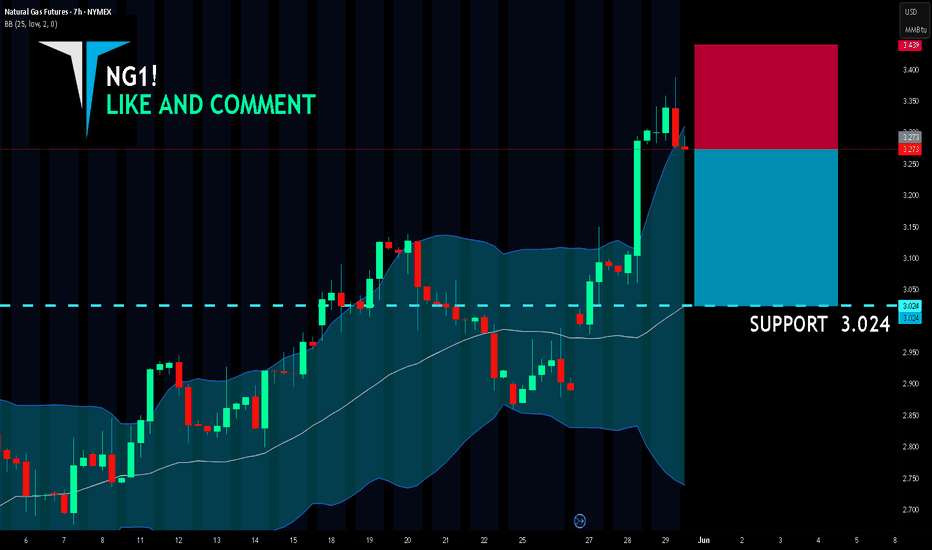
NG1! SENDS CLEAR BEARISH SIGNALS|SHORT
NG1! SIGNAL
Trade Direction: short
Entry Level: 3.273
Target Level: 3.024
Stop Loss: 3.439
RISK PROFILE
Risk level: medium
Suggested risk: 1%
Timeframe: 7h
Disclosure: I am part of Trade Nation's Influencer program and receive a monthly fee for using their TradingView charts in my analysis.
✅LIKE AND COMMENT MY IDEAS✅
AUD/CHF BEARS ARE GAINING STRENGTH|SHORT
Hello, Friends!
AUD-CHF uptrend evident from the last 1W green candle makes short trades more risky, but the current set-up targeting 0.558 area still presents a good opportunity for us to sell the pair because the resistance line is nearby and the BB upper band is close which indicates the overbought state of the AUD/CHF pair.
Disclosure: I am part of Trade Nation's Influencer program and receive a monthly fee for using their TradingView charts in my analysis.
✅LIKE AND COMMENT MY IDEAS✅
EURUSD Bearish on Strong USD and Rising Oil Prices!Hey Traders, in today's trading session we are monitoring EURUSD for a selling opportunity around the 1.17300 zone. EURUSD is trading in a downtrend and currently is in a correction phase, with price approaching the trendline resistance around the 1.17300 support and resistance area.
From the macro side, the US Dollar remains supported as renewed geopolitical tensions in the Middle East continue to reinforce demand for safe-haven assets. Following fresh strikes and retaliatory actions involving Iran, markets have shifted back into a defensive tone, supporting USD strength while increasing inflation concerns through higher energy prices.
At the same time, rising oil prices are reviving higher-for-longer rate expectations, keeping Treasury yields elevated and reinforcing bullish momentum in the dollar. This combination continues to pressure EURUSD, especially as the Euro remains vulnerable to slowing growth sentiment and energy-related risks.
With EURUSD correcting into a key resistance zone within a broader bearish structure, rallies continue to look attractive for sellers. As long as price remains below the 1.17300 resistance zone, the bearish trend remains intact, and we anticipate continuation toward lower support levels.
Trade safe, Joe.
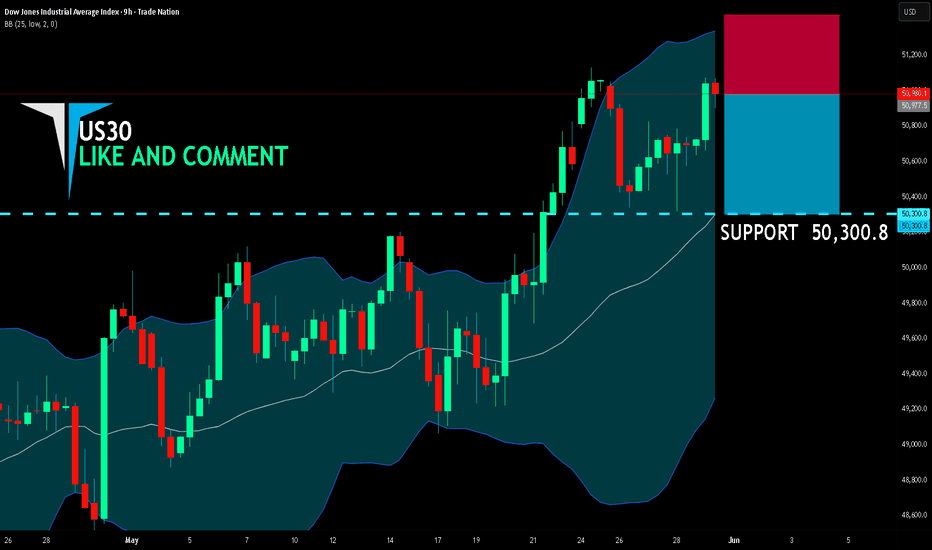
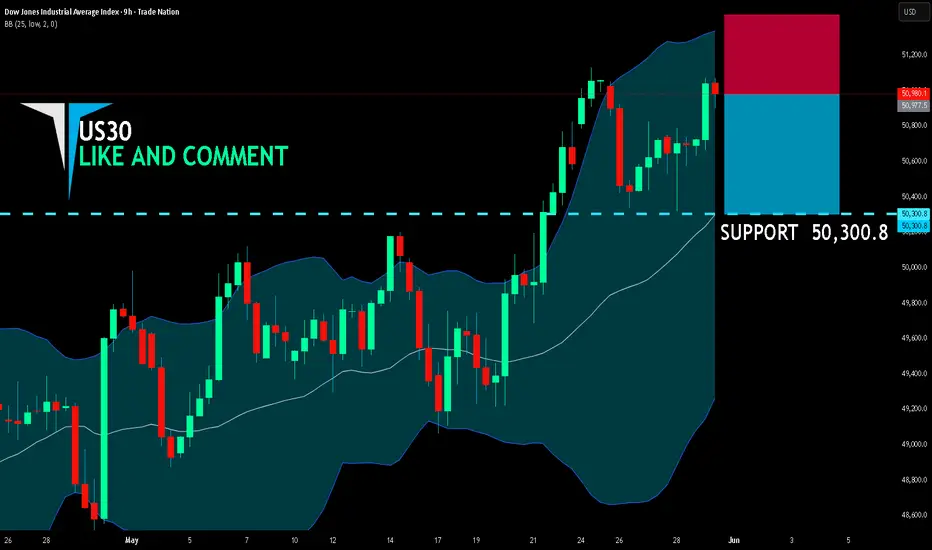
US30 SELLERS WILL DOMINATE THE MARKET|SHORT
US30SIGNAL
Trade Direction: short
Entry Level: 50,977.5
Target Level: 50,300.8
Stop Loss: 51,427.3
RISK PROFILE
Risk level: medium
Suggested risk: 1%
Timeframe: 9h
Disclosure: I am part of Trade Nation's Influencer program and receive a monthly fee for using their TradingView charts in my analysis.
✅LIKE AND COMMENT MY IDEAS✅
NZD/CAD BEST PLACE TO SELL FROM|SHORT
Hello, Friends!
NZD/CAD pair is trading in a local downtrend which know by looking at the previous 1W candle which is red. On the 1H timeframe the pair is going up. The pair is overbought because the price is close to the upper band of the BB indicator. So we are looking to sell the pair with the upper BB line acting as resistance. The next target is 0.821 area.
Disclosure: I am part of Trade Nation's Influencer program and receive a monthly fee for using their TradingView charts in my analysis.
✅LIKE AND COMMENT MY IDEAS✅
USD/JPY BEST PLACE TO SELL FROM|SHORT
USD/JPY SIGNAL
Trade Direction: short
Entry Level: 159.485
Target Level: 159.257
Stop Loss: 159.636
RISK PROFILE
Risk level: medium
Suggested risk: 1%
Timeframe: 1h
Disclosure: I am part of Trade Nation's Influencer program and receive a monthly fee for using their TradingView charts in my analysis.
✅LIKE AND COMMENT MY IDEAS✅
USD/CHF BEARISH BIAS RIGHT NOW| SHORT
Hello, Friends!
Previous week’s green candle means that for us the USD/CHF pair is in the uptrend. And the current movement leg was also up but the resistance line will be hit soon and upper BB band proximity will signal an overbought condition so we will go for a counter-trend short trade with the target being at 0.784.
Disclosure: I am part of Trade Nation's Influencer program and receive a monthly fee for using their TradingView charts in my analysis.
✅LIKE AND COMMENT MY IDEAS✅
EUR/CHF BEARS ARE GAINING STRENGTH|SHORT
Hello, Friends!
The BB upper band is nearby so EUR-CHF is in the overbought territory. Thus, despite the uptrend on the 1W timeframe I think that we will see a bearish reaction from the resistance line above and a move down towards the target at around 0.912.
Disclosure: I am part of Trade Nation's Influencer program and receive a monthly fee for using their TradingView charts in my analysis.
✅LIKE AND COMMENT MY IDEAS✅
NZDUSD Breakout and Potential Retrace!Hey Traders, in today's trading session we are monitoring NZDUSD for a selling opportunity around 0.59800 zone, NZDUSD was trading in an uptrend and successfully managed to break it out. Currently is in a correction phase in which it is approaching the retrace area at 0.59800 support and resistance area.
Trade safe, Joe.
EURUSD Breakout and Potential Retrace!Hey Traders, in today's trading session we are monitoring EURUSD for a selling opportunity around 1.16700 zone, EURUSD was trading in an uptrend and currently is in a correction phase in which it is approaching the retrace area at 1.16700 support and resistance area.
Trade safe, Joe.
CHF/JPY BEARS ARE STRONG HERE|SHORT
Hello, Friends!
We are going short on the CHF/JPY with the target of 202.692 level, because the pair is overbought and will soon hit the resistance line above. We deduced the overbought condition from the price being near to the upper BB band. However, we should use low risk here because the 1W TF is green and gives us a counter-signal.
Disclosure: I am part of Trade Nation's Influencer program and receive a monthly fee for using their TradingView charts in my analysis.
✅LIKE AND COMMENT MY IDEAS✅
BITCOIN SHORT FROM RESISTANCE
BITCOIN SIGNAL
Trade Direction: short
Entry Level: 73,647.40
Target Level: 72,728.54
Stop Loss: 74,253.17
RISK PROFILE
Risk level: medium
Suggested risk: 1%
Timeframe: 1h
Disclosure: I am part of Trade Nation's Influencer program and receive a monthly fee for using their TradingView charts in my analysis.
✅LIKE AND COMMENT MY IDEAS✅
GBPNZD – Bears Defending the Upper Bound?GBPNZD has been overall bearish, trading within the falling wedge pattern marked in red 🔴
Currently, price is retesting the intersection of the upper bound of the wedge and the resistance zone marked in red, creating a strong confluence area for the bears.
As long as this intersection holds, we will be looking for shorts 📊
A bearish rejection from this zone could trigger the next impulsive movement lower, in line with the overall bearish trend.
However, a confirmed breakout above the wedge would be the first signal that the bearish pressure is fading. ⚠️
Will the bears defend this resistance once again? 🤔
⚠️ Disclaimer: This is not financial advice. Always do your own research and manage risk properly.
📚 Stick to your trading plan regarding entries, risk, and management.
Good luck! 🍀
All Strategies Are Good; If Managed Properly!
~Richard Nasr
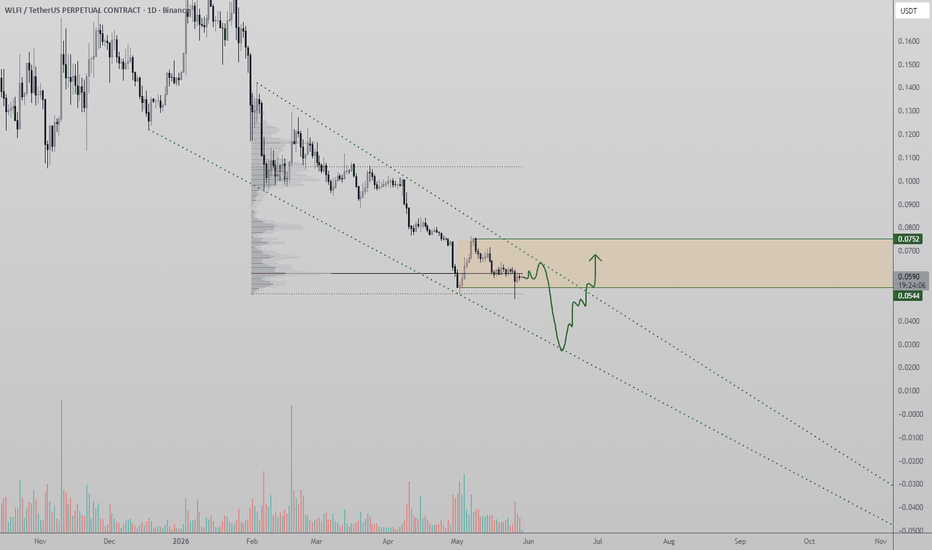
WLFI Price Bearish Structure Continues World Liberty Financial (WLFI) continues to display a clear bearish market structure on the daily timeframe, with price action consistently forming lower highs and lower lows. This ongoing trend confirms that sellers remain in control, while bullish momentum continues to weaken across the broader structure. Recent attempts at recovery have struggled to sustain momentum, reinforcing the overall downtrend currently visible on the chart.
One notable development is the reclaim of a key daily support region following a swing failure pattern (SFP), which briefly pushed price below support before reversing back above it. While this reclaim provided short-term relief and created a temporary reaction from buyers, the broader bearish structure remains intact. The Value Area Above also sits overhead within the current trading range, creating additional resistance pressure that could limit upside continuation if buyers fail to regain stronger positioning.
Price is currently trading beneath the Point of Control (POC), which remains a critical level for directional bias. As long as WLFI remains below this region, the probability favors continuation of the existing downtrend and the establishment of another lower high before further downside expansion occurs.
From a higher timeframe perspective, the chart remains bearish until market structure is decisively broken and buyers reclaim key resistance levels with strong momentum confirmation.
BTC Short Setup: Complex Three BuddhaBias: Strongly Bearish (Failed Auction & Buyer Exhaustion)
Pattern: Three Buddha / Modified Head & Shoulders (Asymmetric Double Top + Lower Right Peak) above Q4 2025 VAL (the ATH Value Area ).
Market Context & Logic
Failed Auction: Price pushed above Key Value Level but failed to find acceptance in the premium zone.
Liquidity Hunt: The second peak created an asymmetric trap, cleaning out early short stops.
Buyer Exhaustion: The third, smaller peak confirms that demand is depleting, creating a textbook structural shift (Lower High).
This is only confirmed below the Neckline!
Target
I would like to see this trend downwards to the Q1 VAH which is our most recent auction. There it will decide if we find support or trend further down to Q1's POC.
Not Financial Advice: The information, analysis, and charts provided in this post are for educational and informational purposes only. Nothing contained here constitutes investment advice, a recommendation, or a solicitation to buy or sell any financial instrument.
Risk Warning: Trading financial markets involves a high degree of risk and can result in the loss of your capital. Past performance is not indicative of future results. Double top and Head & Shoulders patterns can fail. Always apply strict risk management and never risk money you cannot afford to lose.
Do Your Own Research (DYOR): You are fully responsible for your own trading decisions. The author assumes no liability for any financial losses incurred from acting on this setup.
GBPUSD Breakout and Potential Retrace!Hey Traders, in the coming week we are monitoring GBPUSD for a selling opportunity around 1.35000 zone, GBPUSD was trading in an uptrend and successfully managed to break it out. Currently is in a correction phase in which it is approaching the retrace area at 1.35000 support and resistance area.
Trade safe, Joe.
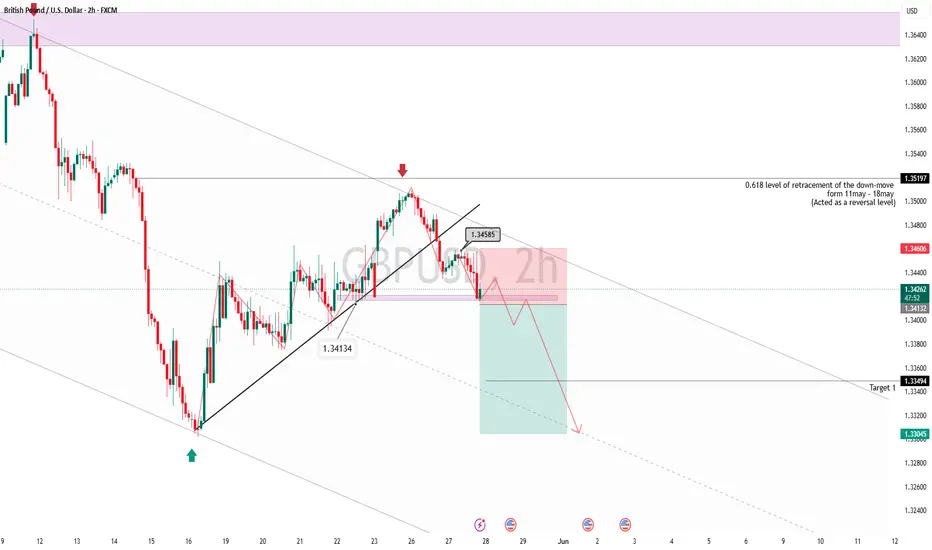
GBP/USD, Continued down-move Short Setup.Price is moving in a descending channel taking resistance from the upper band, a down-move till the lower band is expected.
channel is heading towards the major support zone of the broad range (1.3657 - 1.3172).
After getting rejected form major resistance zone, price has shown a nice down-move after, which was followed by a pullback, that was halted at 0.618 level of retracement as market on the chart.
To capture the continued down-move after a pullback.
This is a short trade setup
Sell: 1.3409
SL : 1.3461
TP1: 1.3349
TP2: 1.3304
Strict Risk management should be applied and Position should be sized according to individuals risk appetite.
For Educational Purposes only, Not an Investment Advice
NZD/USD BEARS ARE STRONG HERE|SHORT
Hello, Friends!
NZD/USD is trending down which is evident from the red colour of the previous weekly candle. However, the price has locally surged into the overbought territory. Which can be told from its proximity to the BB upper band. Which presents a beautiful trend following opportunity for a short trade from the resistance line above towards the demand level of 0.582.
Disclosure: I am part of Trade Nation's Influencer program and receive a monthly fee for using their TradingView charts in my analysis.
✅LIKE AND COMMENT MY IDEAS✅