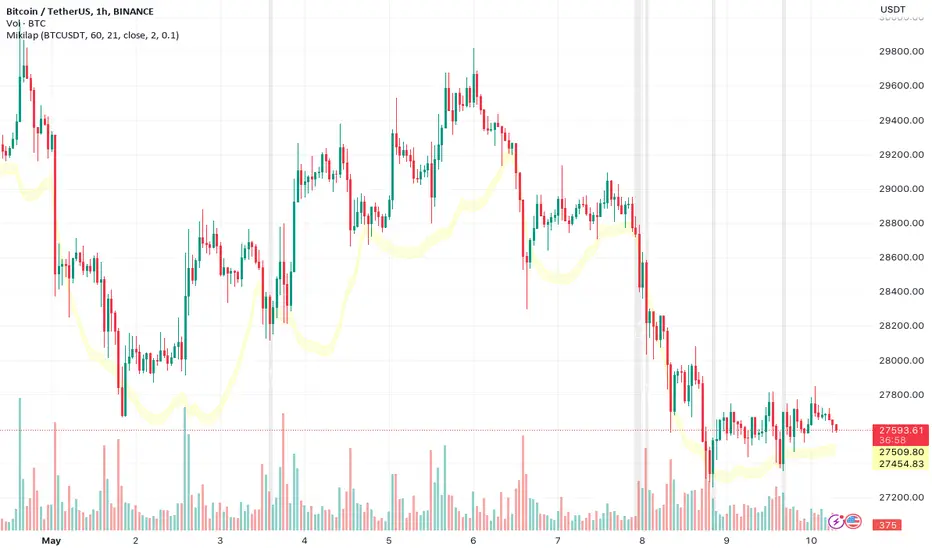
📉 Bitcoin's Bear Pennant Breakout: Measured Move to $59200 withAbstract:
🐻 Bitcoin is poised to break from a 4-hour bear pennant pattern, signaling a potential move to the $59200 area. 📈 This analysis explores the implications of this breakout, which aligns with the Shibunacci indicator, offering additional confirmation. 🔄
Introduction:
Bitcoin's imminent breakout from a 4-hour bear pennant suggests a shift in market dynamics. 📉 Traders are anticipating a measured move towards the $59200 region, reinforced by confluence with the Shibunacci indicator. 🔍
Be
Bearish Pennant
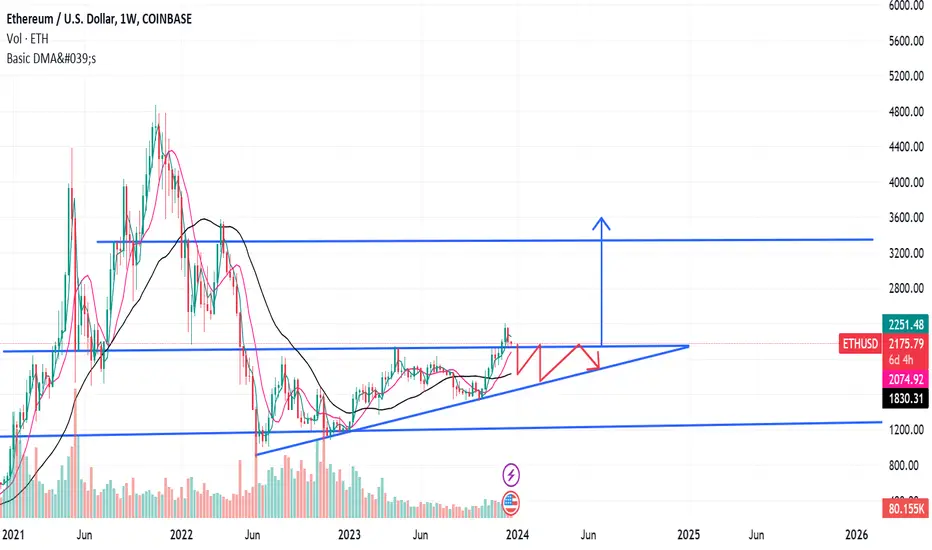
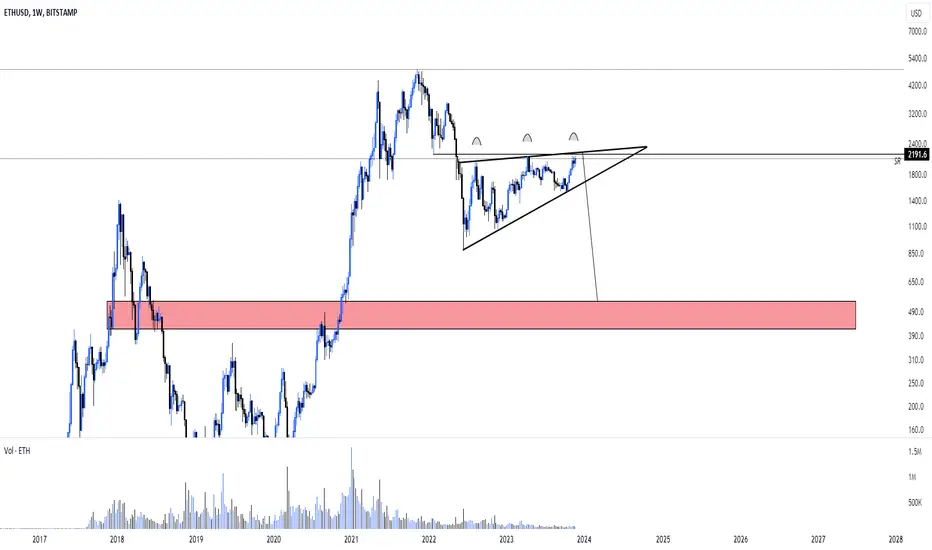
Ascending Triangle or Bearish Pennant for Ethereum....It appears as though Ethereum has broken the horizontal resistance of an Ascending Triangle or Bearish Pennant....
ideally we want to see the old resistance turn into new support, I do not expect that to happen.
A re-test of the upward sloping support of the pattern is like to occur.
ETH Macro AnalysisEth is currenty making Bearish pennat Pattern as you all know about me that i m still bearish on BTC on Macro level.
But I trade BTC,ETH & ALts level by level regardless of beaish senerio
as you have seen my previous ideas regarding RUNE SOL APE and many more which i tell you to buy on dip with complete analysis & I also tell you about mini bull run in march .you can visit my wall to see that.
But i know that this not a real bull run, bull run will start in the end of 2025 or 2026 even if btc g
How not to trade Gold. Really.Double Top preceded by a 50% Fibonacci was a bad trade idea. Lost 1K on this for trying someone else idea. Also lifted the SL to 1779-1782 area to act as the biggest risk I would take in this position. Even thought I knew the risks. I normally do not trade Gold since I do not have enough money. I could have taken gains at 1770 instead 📞 I'm such a noob.
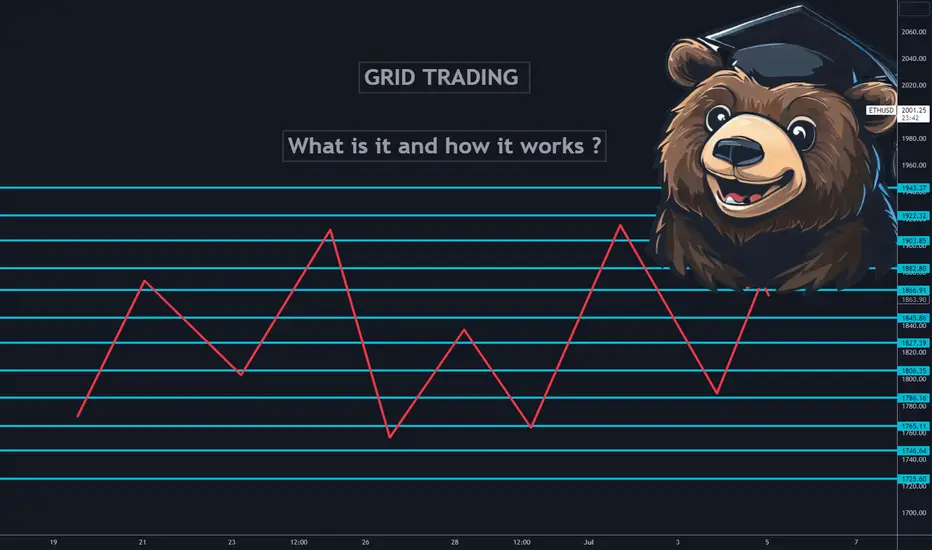
Educational: Grid Trading, What is it? How it works?Grid trading is often marketed as a way to win every trade. People usually get away with this type of marketing of the trading style due to the fact that grid trading does not care for market execution in the sense of market direction because you will close profitable trades if the market goes up or down. But it's not as simple as that.
What is Grid trading?
Grid trading is a type of trading strategy that makes use of market price variations by placing buy and sell orders at regular inte
BTC UPDATE! DUMP INCOMING!!Hello everyone, if you like the idea, do not forget to support it with a like and follow.
Welcome to the new BTC update. BTC is currently trading around the $30.2k level.
As you see in the chart, it is forming a bearish pennant in 1hr time frame. It already breaks down this pennant and a retest is also done. According to this pattern, we might see a big sell-off today.
If this pattern plays out accordingly, then we see a dump up to the FWB:29K level from here.
Invalidation:- If the hourly
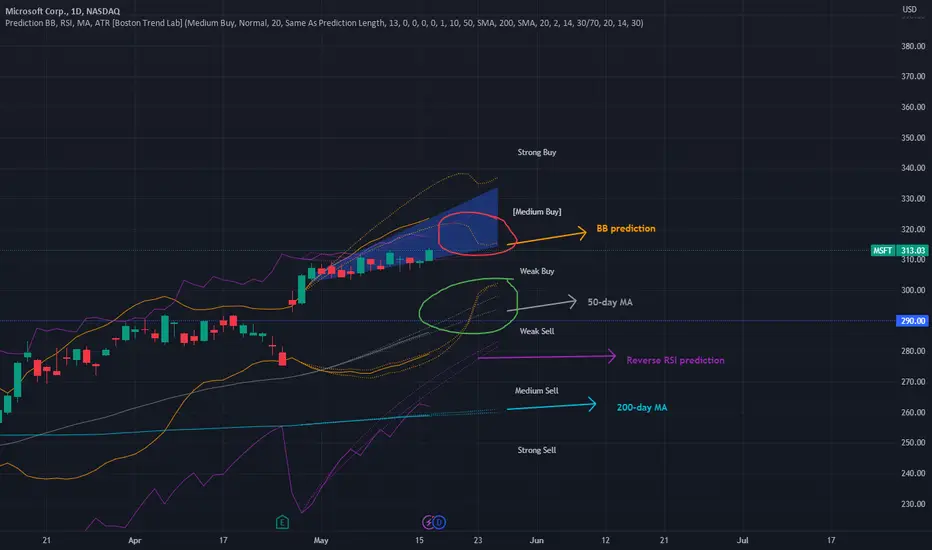
Small fall for growthThe stock's growth has been impressive in recent times; however, the prediction indicates that if the next breakout does not occur by May 19th, the upper band of the 20-day Bollinger Band will decrease, which may hinder sustained attainment of levels above 320. (Red circle)
To facilitate further growth, it would be beneficial to reinforce the resistance level at 290 - 295 at the intersection of the 50-day moving average. (Green circle)
Additionally, the RSI's 70 level limits further growth poten
Bitcoin price action update : Bearish pennantThis is another update about the bitcoin as the price action has been developing in another consolidation factor. During the development of the price action, we also see that the price is now forming another bearish scenario as the liquidation factor involved in this analysis.
2nd Pine Script Lesson: Coding the Entry Logic - Bollinger BandWelcome back to our Trading View tutorial series! In this second lesson, be learning how to code the entry logic for a Bollinger Band indicator using Pine Script.
If you're new here and missed the first lesson, we highly recommend starting there as it provides a solid foundation for understanding the concepts we'll be covering today:
In this hands-on lesson, we'll guide you through every step of coding the entry logic for your own Bollinger Band indicator using Pine Script. By the end of thi
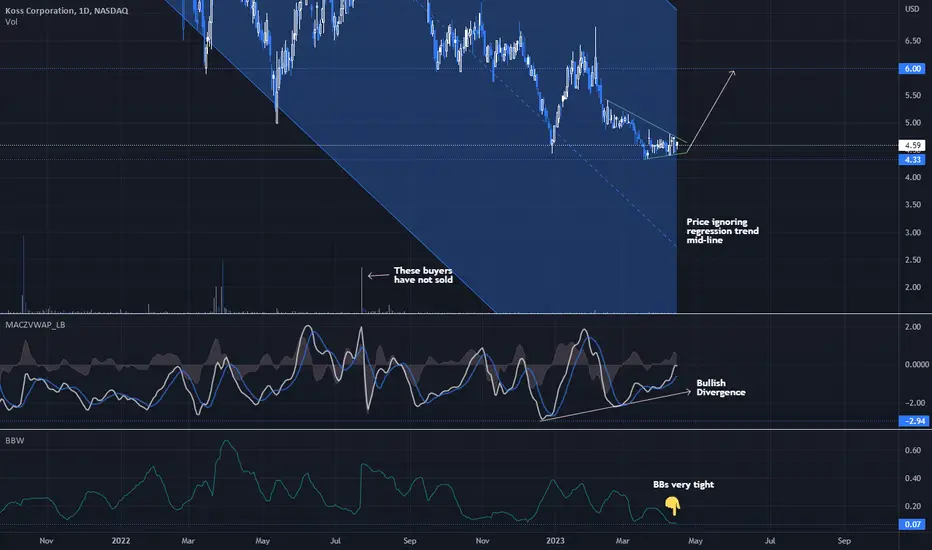
KOSS - ready to moveKOSS daily showing bullish diversion on a number of indicators and is resting on strong historic support levels at the current price. Further the price has been drifting away from the longer term regression trend midline, suggesting a change in direction is occurring.
Per the OBV buyers have generally held onto their shares since the run up that occurred last July. With the Bollinger's getting and staying tight, I expect KOSS will make a move to the upside fairly soon. Trade target is $6.
📊Bollinger Bands In A Trending MarketBollinger Bands are a widely used chart indicator for technical analysis created by John Bollinger in the 1980s. They offer insights into price and volatility and are used in many markets, including stocks, futures, and currencies. Bollinger Bands have multiple uses, such as determining overbought and oversold levels, as a trend following tool, and for monitoring for breakouts.
📍 Strategy
Bollinger Bands measure deviation and can be helpful in diagnosing trends. By generating two sets of ban
Bitcoin BTCUSD 6W To Tag Upper Bollinger Band Within 120 DaysBitcoin 6W Bollinger Bands - Each time, after the bottom was put in, within 7 bars BTC hit the upper Bollinger Band. In 2019, it did it in only 5 bars. In 2023, our 5th bar just opened. If BTC were to once again follow this trajectory of hitting the upper BB within 7 bars, this would suggest that we'll see BTC at $64K or higher within 3-4 months or ~120 days. I'm publishing this to see if the idea is valid.
Bitcoin - No one talks about this trendline, last wave up!
Bitcoin is appraoching an extremely strong resistance at around 30k. The chance of crash from this level is extremely high!
We can see that the uptrend from 20k to almost 30k in March is steep and without any major corrections.
From the Elliott Wave perspective I expect last fifth wave to the upside to complete an impulse wave. We can find a resistance at the major trendline that you can see on the chart, or you can call it a broadening wedge.
If you open a short position slightly below 30
BEARISH PENNANT FORMATION BTC/USD SHORTDear followers and viewers,
*We have a bearish pennate formation along with a death cross on the REX indicator. There were also no signs of bullish divergence on RSI meaning BTC should trade lower, especially if the pennate does not break currently.
*There will be a continuation of the trend, tread lightly if you are bullish better off thinking of a bearish scenario.
*My target for this short is near 20.5k
~MC
Ethereum - Final 24% drop before a new all time high!
Ethereum is now in an extremely difficult situation because the price is at the resistance of this symmetrical triangle and also inside the bearish rising wedge pattern on the daily chart! These patterns are bearish, so the probability of breaking down is higher at this point. Of course, we can breakout bullish, but do you really want to bet on it?
What's more, it looks like the first impulse Elliott wave has been completed, and we should take a look for a potential buying level on the next b
Bitcoin to 18k. The big crash is coming!
It looks like Bitcoin has completed the first bullish impulse wave, which is a very positive sign for the future, but right now the correction is in progress.
As you know, from the Elliott Wave perspective, wave 2 corrections are usually deeper, especially in crypto. 0.618 FIB or even lower is a classic retracement, and because we have a huge unfilled GAP, this is going to happen!
0.618 FIB is at 18658 (LOG), and the start of the gap + POC of the previous consolidation structure is at 16830.
The Bollinger Bands are Squeezing the Juice out of GrainsSoybean short swing trade:
The Bollinger Bands width has narrowed to 2.56% of price which is a level not seen in over a year. A new 6-month or greater low in bandwidth indicates that a volatility squeeze breakout is likely upon us. Similar volatility squeeze situations exist in wheat and corn but they both broke to the downside significantly last week. Wheat was -6.42% on the week, corn -4.21%, and soybeans lagged at -0.20%.
Soybean price reached the lower parabolic SAR which is a signal to s
SPX reading the 1D chartS&P500, SPX is assumingly in a downtrend with some bearish symptoms, however it might be good to wait for confirmation.
Symptoms:
bottom of b band
receding volume & HoD
MACD
U
Bitcoin - Buy here if you feel FOMO!
The new bull market on Bitcoin started with a strong impulsive structure, which is definitely a positive sign. We have an unfilled CME GAP at 20,000 - 20,450, and there is a very high chance that the market will fill the GAP; I would say 90%. We can fill this gap next week, next month, or next year, believe it or not. It happened during the COVID flash crash.
If we fill this gap, you want to buy as much bitcoin as possible for the long term investment! I expect this bull market to end in Sept
LABU - Break-out & bullish signalsLABU daily chart showing a recent break-out and successful back-test of the longer-term down trend.
Optimism present due to a recent Bullish Cross on the MACD, price closing above the VWAP on Friday, price now above the 50-day MA, and buyers appear to be coming back.
BBs staying tight on the daily suggesting a significant move may occur soon. Last time the BBW was this low the price move was +20%. Targeting a similar rise in price on this trade to the $8.30s or $8.40s.
NFA.