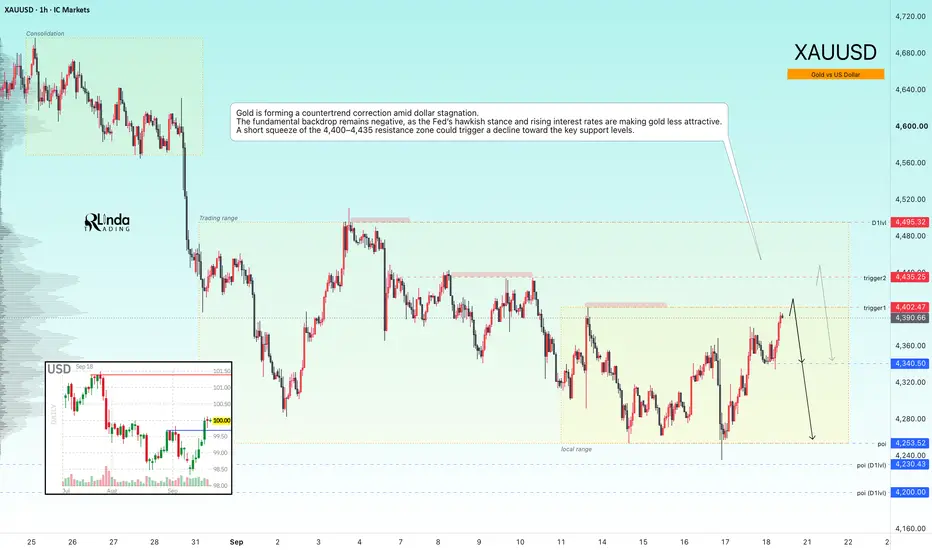
GOLD - Consolidation could trigger a distribution downwardsICMARKETS:XAUUSD is bouncing off the 4,380 resistance and consolidating within a local range ahead of a potential decline driven by the negative fundamental backdrop
The dollar is stagnating but preparing for further upside, while rising interest rates and the weak fundamental backdrop are putting pressure on the gold market. The probability of further downside toward the range support remains in place.
Gold is likely to remain range-bound as long as the conflict in the Middle East does no
Descending Channel
XAUUSD — Wave 5 Lower Toward 4,280
From Kelly’s view, gold is still trading inside a broader bearish structure. Price is currently around 4,352, while the recent rebound remains below the previous lower-high area near 4,380–4,395.
The key idea is simple: the current move may be completing a corrective Wave (4) around resistance, while the main structure still favors another bearish leg toward 4,320, 4,305, and potentially the 4,280 Wave (5) target zone.
⟡ Market structure
Gold continues to show a sequence of lower highs after
BTCUSD Daily: Base Built, Now Testing the 83K Wallwww.tradingview.com
This is the Bitcoin / USD daily chart (Bitstamp, 19 Sep 2026). Price is currently around 81,469. After a roughly 55% fall from the Oct 2025 peak, Bitcoin swept the sell-side liquidity, built a base, and broke out. It has pulled back into a fair value gap (FVG) and bounced, and it is now pressing against the first major resistance. All levels below are my approximate readings from the chart, so small deviations are possible.
1. Big picture (Sep 2025 to now)
Oct 2025: Bitco
GOLD - The Hunt for Liquidity Ahead of a Decline ICMARKETS:XAUUSD continues to form a countertrend correction, driven by the decline in oil prices. The fundamental backdrop remains weak...
The dollar is stagnating after a strong rally triggered by the Fed’s hawkish stance and rising interest rates. However, the Dollar Index remains strong, which continues to put pressure on gold. At the same time, the decline in oil prices has given the metal some room to recover. The market remains highly dependent on geopolitical developments.
There is
XAUUSD Daily: Post-Range Breakout, Now at the Pullback Decisionwww.tradingview.com
This is the Gold Spot / USD daily chart (19 Sep 2026). Price is currently around 4,378. The core idea is that Gold fell for a long stretch, built a range, swept sell-side liquidity, broke the HTF trendline, and has now pulled back and bounced. It is approaching a decision point for the next move. All levels below are my approximate readings from the chart, so small deviations are possible.
1. Big picture (Nov 2025 to now)
Gold started rising in Nov 2025 from around 4,000
GOLD - A countertrend correction aimed at liquidity huntingICMARKETS:XAUUSD has been forming a countertrend correction toward the 4,400–4,430 liquidity zone since the session opened. The fundamental backdrop remains weak, and the market is still in a bearish trend
The dollar is stagnating after breaking through local resistance levels. The Fed’s hawkish stance and rising rates are supporting the Dollar Index, which is putting medium-term pressure on the metals market. However, the correction in oil prices is giving gold some room to recover as it
GOLD - A countertrend correction ahead of the news ICMARKETS:XAUUSD is bouncing from support ahead of the news and forming a countertrend correction amid the dollar’s stagnation following a five-day rally. The FOMC meeting and comments from the regulator are ahead...
Technically, most of the hawkish risks have already been priced in, but gold will remain vulnerable if the Fed signals that it intends to keep rates elevated for an extended period. Geopolitical risks and high energy prices are providing support. Gold is caught between expecta
AUD/USD 30Mins Channel Pattern (USD Strong)AUD/USD remains within a clear descending channel on the 30-minute chart, with price struggling below the channel’s upper boundary and the marked resistance zone. A rejection from this area could keep the bearish structure active, while a sustained breakout above resistance would weaken the setup.
Key resistance zone: 0.7135 – 0.7145
Current price area: around 0.7127
First support: 0.7080
Major support: 0.7063
✔️ Price remains below the major resistance zone.
✔️ A rejection near 0.7135–0.7145
GOLD: 4.340–4.350 — BREAKOUT OR REJECTION?Today is FOMC day. Gold is approaching the descending trendline again, with 4.340–4.350 as the key short-term resistance zone.
🔴 Resistance:
4.340–4.350 │ 4.390–4.400 │ 4.420–4.435
🟢 Support:
4.300 │ 4.270 │ 4.225 │ 4.200 │ 4.160
🎯 TRADING SCENARIOS
Break above 4.340–4.350 → potential move toward 4.390–4.400 → 4.420–4.435.
Rejection at 4.340–4.350 → watch for a pullback toward 4.300 → 4.270 → 4.225.
Below 4.200 → next area to watch: 4.160.
🧠 PERSONAL VIEW
I still favor BUY at support and
BTCUSDT: Price Downward, Bears in ControlBTCUSDT is trading around 77,300 USDT and remains firmly within a descending channel.
Despite multiple attempts to rebound, the price has failed to break the structure of lower highs and continues to fluctuate below the EMA89 (near 77,830), indicating that buying pressure is insufficient to reverse the short-term trend.
The 77,500–78,000 range is the area I am watching most closely. It serves as a "Sell Zone" and represents a confluence of the EMA and the upper boundary of the descending chann
GOLD - A bounce off support before falling to 4,200 ICMARKETS:XAUUSD remains under pressure from the Fed’s hawkish stance and a strengthening dollar. In the medium term, the market may maintain its bearish trend; however, this week, all attention is focused on the Fed’s rate decision and the regulator’s comments
The dollar is forming a countertrend correction but remains locally bearish. The dollar’s rise is putting additional pressure on the metals market. Gold is maintaining its bearish market structure amid the Fed’s hawkish stance, whil
GOLD: SHORT-TERM BUY BEFORE FOMC?Gold is still moving within a downtrend channel. Yesterday’s daily candle closed below 4,300, but with a deep rejection wick, showing that buyers are still defending the market. Ahead of FOMC, I favor short-term BUYs at support and will wait for price confirmation.
🔴 Resistance: 4.316 │ 4.340–4.345 │ 4.390–4.400 │ 4.440
🟢 Support: 4.280 │ 4.250 │ 4.225 │ 4.200 │ 4.160
🎯 SCENARIO
Break above 4.316 → 4.340–4.345 → 4.390–4.400 → 4.440.
Above 4.440: stop SELLing, as gold could resume its uptrend.
GOLD - A countertrend correction to 4,400 ahead of the newsICMARKETS:XAUUSD remains under pressure from a strengthening dollar and a weak fundamental backdrop. The market is making new intermediate lows within the 4,290–4,500 trading range. Key news is ahead…
The dollar is bouncing from support and returning to its bullish momentum, putting further pressure on the market. Gold is trading near its weekly lows, around $4,310, on Friday following a sharp decline triggered by hotter-than-expected PPI data and rising oil prices.
According to TD Securit
AVAX: Round Trip, Not Done YetNine days ago AVAX/USDT put in a parabolic run on the 90-minute chart, tagging highs near 8.20 before the move ran out of buyers. What's followed since isn't a crash — it's a controlled bleed. Each bounce has topped out lower than the last: 7.868, then 7.839 on the retest, and price is now pressing into support carved out by two touches, 7.523 and 7.279.
The bounce attempt in the middle of the decline is worth studying on its own. A single 90-minute candle ripped from 7.276 to 7.839 on a volume
GOLD: RANGE COMPRESSION – WAITING FOR FOMC?Gold is still moving within a downtrend channel, while the H4 chart is consolidating inside the 4.285–4.400 range. For Monday–Tuesday, I will mainly watch price action within this range and pay close attention to deep sweeps and liquidity grabs toward the support zones.
🔴 Resistance: 4.400 │ 4.408 │ 4.445 │ 4.500 │ 4.570–4.600
🟢 Support: 4.285 │ 4.250 │ 4.220 │ 4.150 │ 4.115
🎯 TRADING PLAN
Break above 4.400–4.445 → favor BUY on the breakout, targeting 4.500 → 4.570 → 4.580 → 4.600.
Break bel
GOLD - A Hunt for Liquidity Ahead of Further DeclinesICMARKETS:XAUUSD has been forming a countertrend correction since the session opened. The fundamental backdrop remains unstable, and this correction could end with another move lower
Gold remains exposed to two-sided risks ahead of the release of U.S. CPI data. The sell-the-bounce strategy remains in place, especially against the backdrop of higher-than-expected inflation in China. TD Securities expects core inflation to remain under control in August but warns of upside risks
Drivers:
Ups
GOLD - The market is under pressure from a bearish trend ICMARKETS:XAUUSD remains in a local bearish trend, while consolidation below the 4,435 liquidity zone is becoming a technical catalyst for further downside
The dollar is stagnating, but at the same time, it is weakening due to interventions by the Bank of Japan. Gold looks weak against this backdrop, especially given the Fed’s medium-term hawkish stance. Geopolitical risks and inflation expectations that could limit further upside remain in place. The key event of the week will be the U.S.
BNB is above the channel & jsut goldencrossed; $900 seems likelyIf alts are finally having the beginning of a real alt season(which is debateable after so many alt season fakeouts) then the $900 target for the descending channel it is currently closing multiple consecutive daily candles above seems quite probable. It is also the perfect target zone for BNB to then begin forming the right shoulder of an invh&s pattern. If it were to do that and then also breakout of that pattern and head to its full target as well, bnb could revisit its current ath after only
Nifty daily: below every average, inside a falling channelThis is the same structure as the lower timeframes, but the daily adds the averages, and the averages tell you why nothing bullish has stuck all year.
The long term average rolled over in March and has been declining ever since. Price has been under it for six straight months. Not one rally has closed above it. The August push at 24,650 got right to it, touched it, and turned. That is the third rejection off the triangle line and the first touch of the long term average in months, both at the s
GOLD - Correction and retest of the 4460 resistance levelICMARKETS:XAUUSD continues its rebound after the false breakdown of the 4,300 support level. The fundamental backdrop remains mixed, but selling pressure is still present
The dollar is stagnating, potentially due to intervention from the Bank of Japan. The correction in the Dollar Index is giving gold room to recover. The key event is Friday’s NFP report. A weak report could support a further recovery in gold, while a strong report could bring selling pressure back. The 4,460 level remains
JPN225: 3% yields, a descending triangle,Here Is the Trade!The video has a detailed analysis of the Japan 225 and the trade setup that I have created as of 3 September 2026, the day when Japan's 10 year bond yield topped 3% for the first time since 1996 as US-Iran airstrikes increase oil prices, global inflation expectations rise, yen strengthens amid BOJ rate hike check speculation and the index falls 2.85% to four-week lows at 64,325. Nikkei index currently trades 12% down from its June peak of 73,007. Descending triangle has been developing quietly s
Bitcoin Trapped in a Descending Channel — Can Bulls Reclaim $78KBitcoin ( BINANCE:BTCUSDT ) has been trading inside a Descending Channel over the past 4–5 days, while renewed tensions in the Middle East have added pressure to Bitcoin and other risk assets.
BTC is now attempting to break above the key trading levels of $77,400 and $77,630.
Can Bitcoin reclaim these levels and push toward $78,770, or is another decline toward $75,000 still possible?
Macro Outlook
Renewed geopolitical tensions in the Middle East have pressured Bitcoin alongside U.S. stocks