EURUSD Long Opportunity in Bullish ReversalBullish Divergence Double Bottom Reversal Pattern Buy Stop at 20 pips above breakout SL at double bottom TP at RR 1Longby jawadravian1
HCL Technologies — 61.8% Fib Breakout Setup💻 HCL Technologies — 61.8% Fib Breakout Setup CMP: ₹1,668 Stop Loss: ₹1,580 Targets: ₹1,747 / ₹2,002 🔍 Price Action View Amid ongoing tariff-related news flow and elevated volatility, HCL Tech is emerging as one of the stronger names within the IT pack. Key technical highlights: Formation of a clear double bottom structure ₹1,747 is the critical level — it marks both the neckline of the pattern and the 61.8% Fibonacci retracement A decisive breakout above ₹1,747 can trigger fast upside exLongby satyam15Updated 2
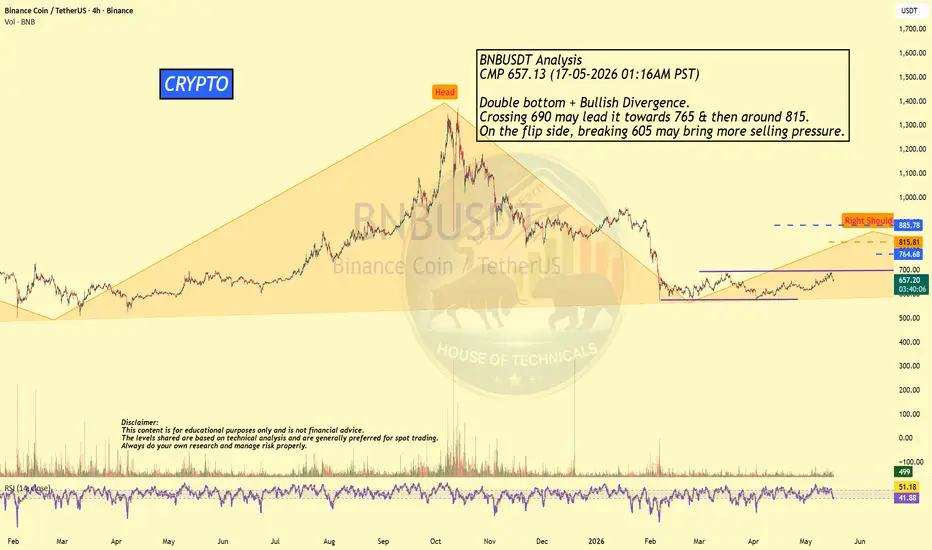
Beautiful Setup!BNBUSDT Analysis CMP 657.13 (17-05-2026 01:16AM PST) Double bottom + Bullish Divergence. Crossing 690 may lead it towards 765 & then around 815. On the flip side, breaking 605 may bring more selling pressure.by House-of-Technicals2
Just Make It SimpleHere is a double bottom for you. Aptos in daily time frame. Confirmed Change of Character. Enjoy. Skyress.Longby vs_sayin150
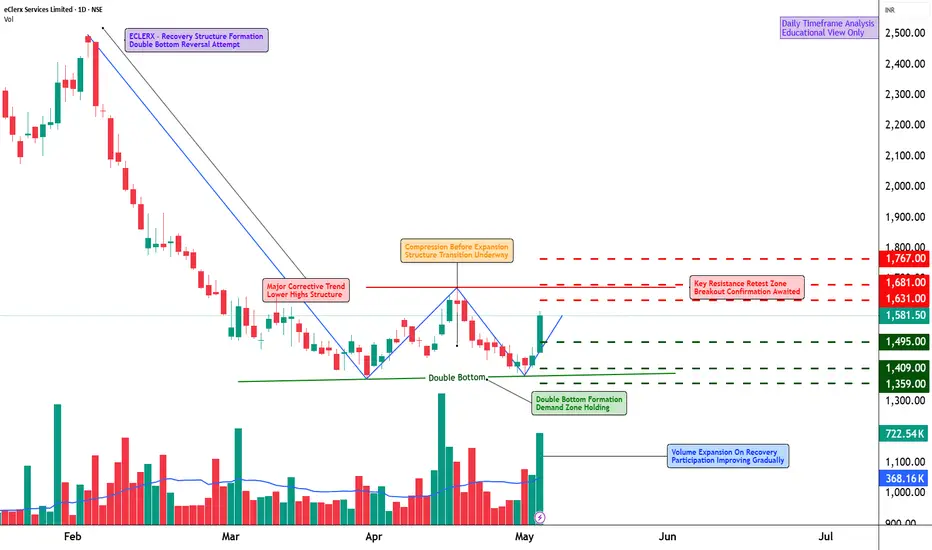
ECLERX - Is a Fresh Uptrend Developing?📊 ECLERX – Technical & Educational Snapshot Ticker: NSE: ECLERX Sector: 💻 IT / Digital Operations & Analytics CMP: 1,581.50 ▲ (+9.16% | 06 May 2026) Learning Rating: ⭐⭐⭐⭐☆ (Recovery Continuation Structure) Chart Pattern Observed: 📊 Base Formation → Recovery Bounce → Consolidation Candlestick Pattern Observed: Three Outside Up Pattern | Double Bottom Pattern 📊 Technical Snapshot ECLERX is showing signs of recovery after a prolonged corrective phase, with price attempting to stabilise above recenLongby simpletradewithpatience3
Stock is getting momentum Now.2222 - Saudi Arabian Oil Co. CMP 25.26 (27-01-2026) Stock is getting momentum Now. Also Beautiful Double bottom with Bullish Divergence. Crossing & Sustaining 26 will lead it to 28 - 29. It should not break 23 now. The upside momentum will continue once it sustains 29.by House-of-TechnicalsUpdated 18
Multibagger of the year Finolex Cables Ltd. is the leading manufacturers of electrical and telecommunication cables and related electrical products. Founded in 1958, with a market cap of 12400 cr, It has shown a sign of reversal after a correction of 58.82% from it's high. It has formed a double bottom chart pattern and finally gave a breakout on 10/02/2026 at around 813 level. It has also released it's Q3 results with a strong growth in revenue by 35% YOY and 9.7% in PAT YOY Some Fundamentals : 1> PE = 18 2>Longby shubham_saliUpdated 4
GBPAUD Long Opportunity in Bullish ReversalDouble Bottom Reversal Pattern Bullish divergence Entry 20 pips above last LH SL at LL TP at RR 1Longby jawadravian1
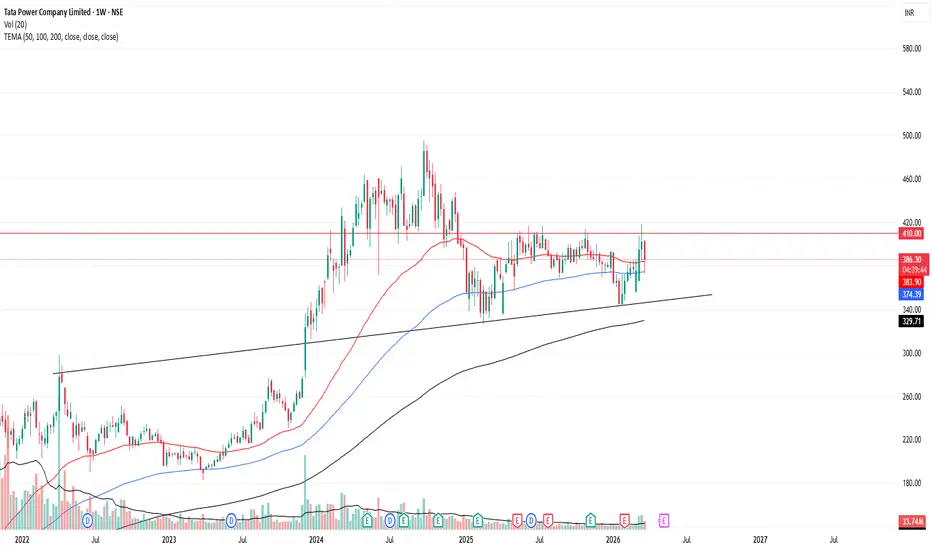
Tata Power - Weekly structure + strong demand tailwindChart View (Weekly Timeframe) Price is consolidating between ₹370–₹410 Strong resistance around ₹410–₹420 Support zone near ₹350–₹360 Price is trading: Around 50 EMA (short-term control) Above 100 & 200 EMA → long-term uptrend intact Forming a Double Bottom formation Structure: Big rally → Distribution → Now range accumulation 👉 This looks like a base-building phase after a strong uptrend Bullish Scenario (High Probability if breakout comes) Weekly close above ₹410 Target zones: ₹450 (preLongby jeet20Updated 3
GBPUSD | Long 22/04/2026Going long on GBPUSD, following the pullback to the internal low. Seems like the bottom has been set Longby BeaucoupPipsUpdated 22
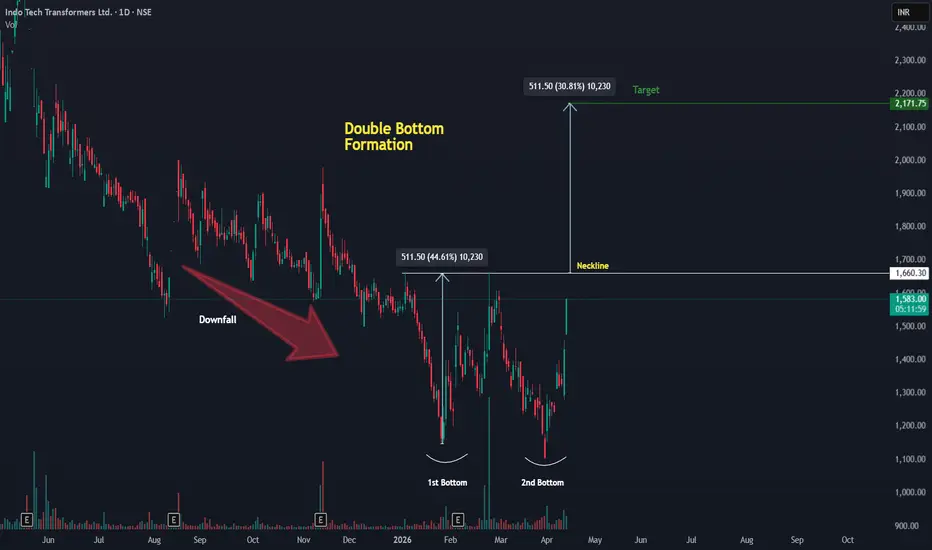
INDOTECH : DOUBLE BOTTOM FORMATIONThe stock NSE:INDOTECH has witnessed a significant downfall over the past sessions, indicating sustained bearish pressure. However, price action now suggests that it is nearing the completion of a Double Bottom pattern — a classic bullish reversal structure. The formation of two consecutive lows around a similar price zone indicates strong support and potential exhaustion of selling momentum. Currently, the price is approaching the neckline, and a decisive breakout above this level would conby VanshikaUdeshiUpdated 4
USDCHF Long Opportunity upon reversal from Bear TrendCurrent Bear Trend on 4H Double Bottom Reversal Pattern Bullish Divergence Buy Stop entry on breakout from last LH SL on last LL TP on RR 1Longby jawadravian0
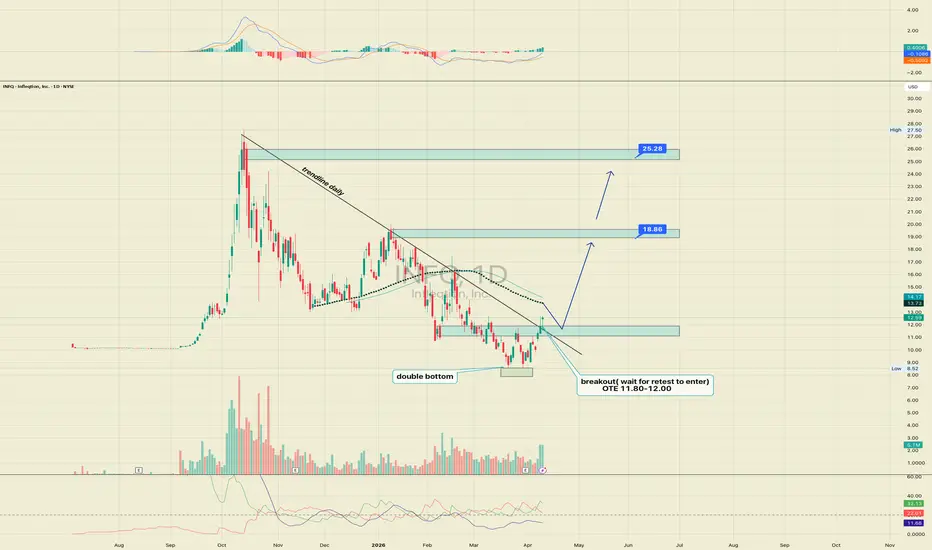
INFQ: Quantum BreakthroughInfleqtion builds neutral atom quantum computers so governments, banks and defense corporations worldwide can access next generation computing. The company trades on NYSE and everyone who understands quantum technology is watching because this is no longer about futurology but about real contracts with NASA, Lockheed Martin and the DoD today. Fundamentals On April 8 2026 the company presented full year 2025 results. Q4 revenue reached 10.79 million dollars with last twelve months revenue atLongby TotoshkaTradesUpdated 716
3 patterns on TASI Chart.TASI Analysis Closed at 10488.910 (02-03-2026) I found 3 patterns on TASI Chart. 1. Bullish Flag Pattern (Bullish Pattern) - Breakout above 13700 with Good Volumes may target 19000 - 19700. 2. Falling Wedge with Double Bottom (Bullish Pattern) - Important to Cross 11800 to start printing HH HL. 3. Head & Shoulders Pattern (Reversal Pattern) - if 10500 is not sustained, we may witness 7200 - 7800; with immediate support around 9200 - 9900 A Very Important Support Zone is the Golden Pocket by House-of-TechnicalsUpdated 7
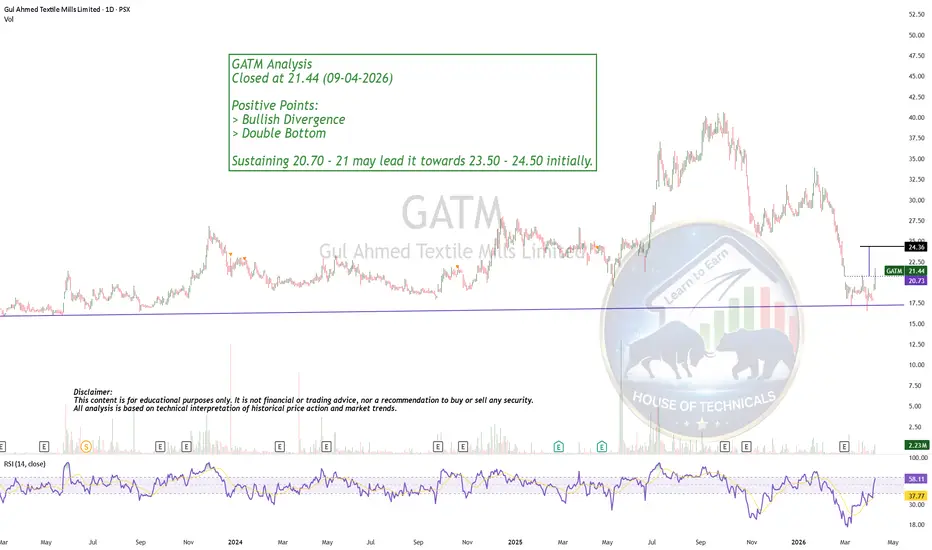
Double Bottom!GATM Analysis Closed at 21.44 (09-04-2026) Positive Points: > Bullish Divergence > Double Bottom Sustaining 20.70 - 21 may lead it towards 23.50 - 24.50 initially.by House-of-TechnicalsUpdated 7
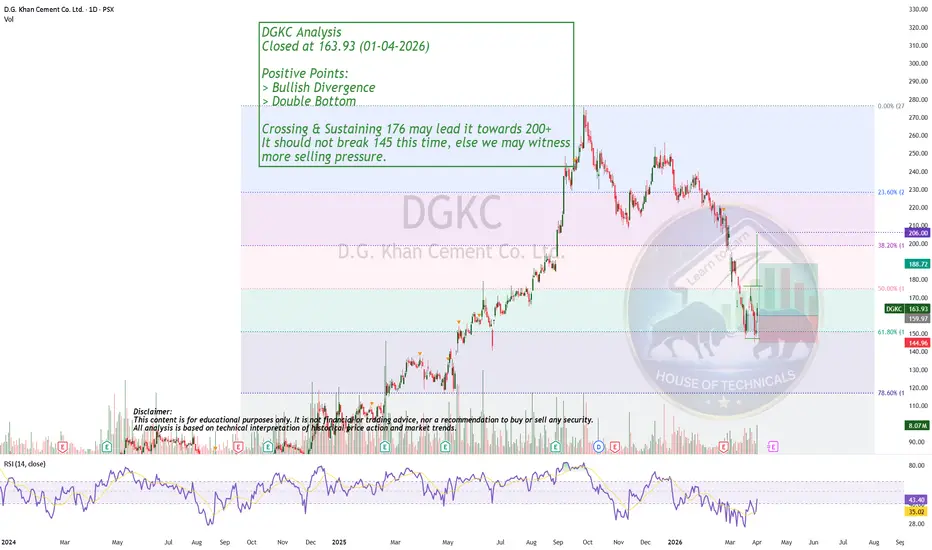
Double Bottom!DGKC Analysis Closed at 163.93 (01-04-2026) Positive Points: > Bullish Divergence > Double Bottom Crossing & Sustaining 176 may lead it towards 200+ It should not break 145 this time, else we may witness more selling pressure.by House-of-TechnicalsUpdated 5
Technical Analysis – PayPal Holdings Inc (PYPL)After reaching the $300 area, PayPal formed a double top pattern, which triggered a long-term bearish phase resulting in an overall decline of approximately -87%. Long-term bearish structure: Market Structure & Volume Analysis The downtrend found support at the major POC (Point of Control based on the full historical volume profile), a key equilibrium level. Following this: a short-term double bottom was formed price reacted with a bounce the move stalled around the midpoint of thLongby Giovanni_Bandini4
Double Bottom with Bullish Divergence1320 Analysis Closed at 40.74 (25-03-2026) Bullish Divergence on bigger tf. Double Bottom Spotted. Crossing & Sustaining 43 - 43.50 may lead it towards 48 - 50.by House-of-TechnicalsUpdated 3
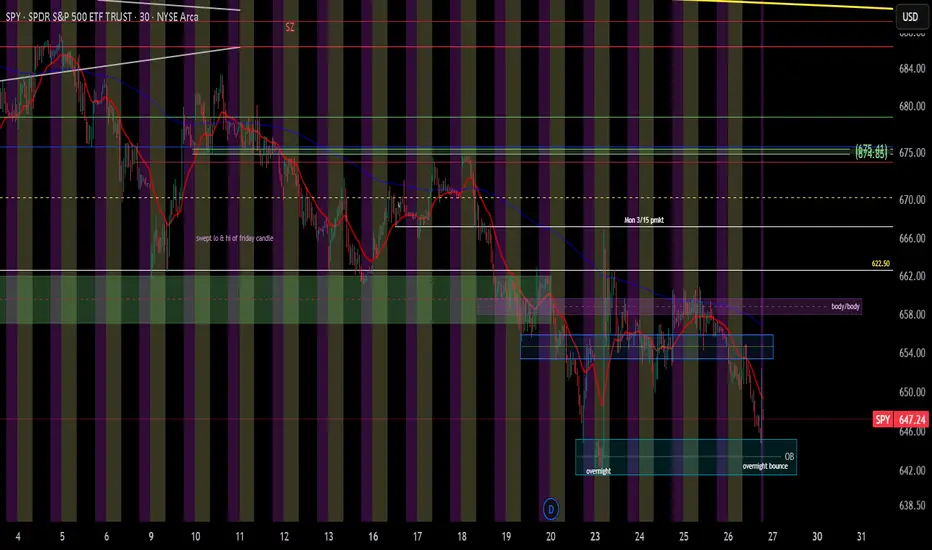
pre/post mkt activityseems to be the state of the market. manipulation happens and you have to use pre & post market to navigate. so what do we think? range since Q4 & knee jerk reactions at key levels. anyway... double bottom? will we rally friday? next week... EOM (end of month) & new month begins. carefulby mommymiles11
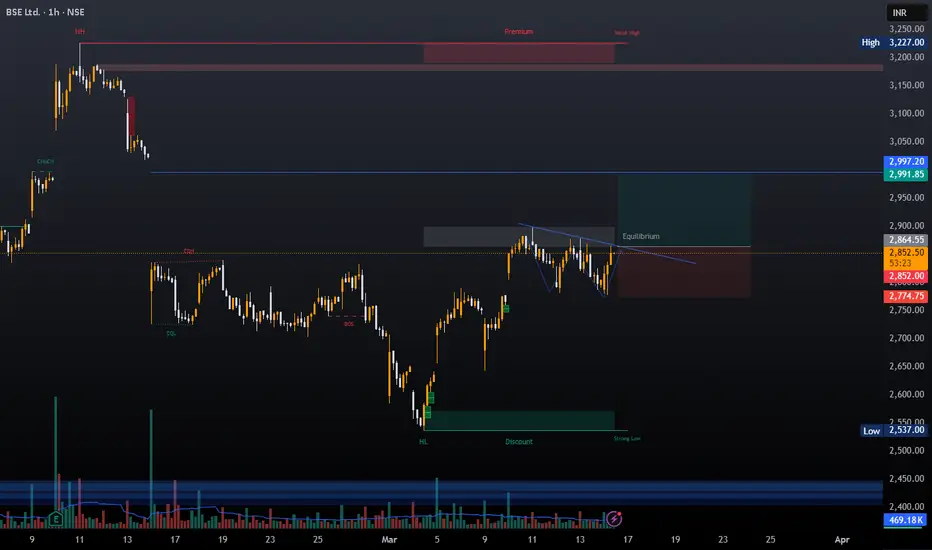
BSE LONGIn such negative sentiment market, BSE has been showing continues strength. Look at the chart if the trendline is broken and a close above this trendline is given. BSE may show more upside to fill the gap. Hence this can be a double bottom buy with a gap fill trade. Entry- After a close above trendline, look for an entry for at levels 2858 to 2864. SL- 2775. Target- 2950, 2980, 3000. Disclaimer- This is just for educational purpose. Remember only a close above the trendline will validate thLongby Sanatan_TraderUpdated 10
BTC Bullish Short term trendBullish 1H double bottom case: Recent dip formed twin lows near 74,000–74,100 (classic W-pattern), neckline breakout already occurred with green candles confirming reversal. Volume likely increased on second bottom test + bounce. Targets neckline projection to ~76,000–76,400 (measured move from pattern height). 4H retest of 76,400: Strong momentum from lower support (green bars dominating recent candles), holding above rising trendline / 71,100–70,800 demand zone. Bullish continuation targets 7Longby Lylebud2
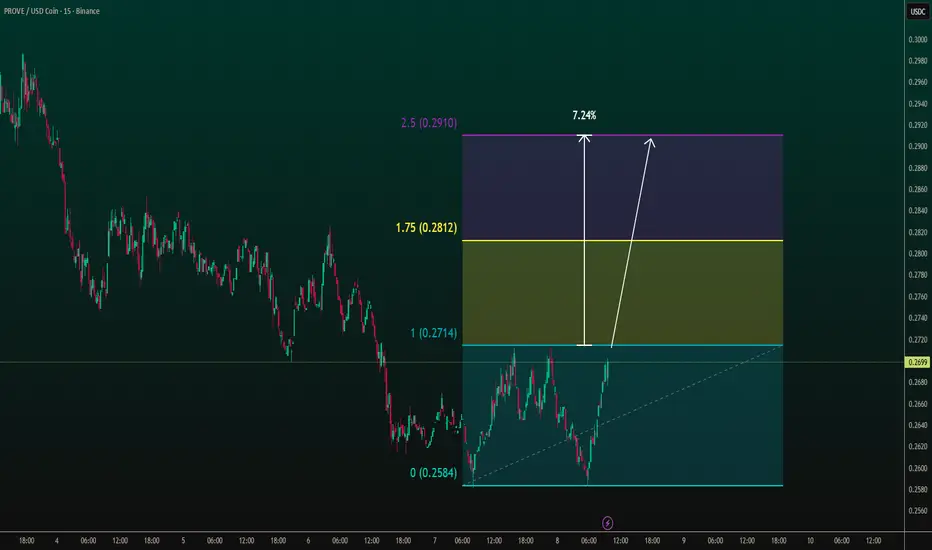
PROVE/USDC – Potential Reversal & Short-Term Upside ScenarioAfter a prolonged downward move, price may be stabilizing and forming a short-term higher-low structure. If bullish momentum continues and price holds above the current support area, a move toward nearby resistance zones is possible, with further upside potential. Invalidation remains below recent lows.Longby larix0
#UKOIL — Cycle Update: Double Bottom Holds, $95 Target ReinforceHi guys! 👋 🔔 Since the original double bottom analysis, price action has continued to develop within the same broader technical framework — recent developments have not altered the primary thesis but have materially strengthened it on both technical and fundamental grounds. 🔔 The critical static support zone at $68.4 – $69.2 was directly tested on February 24, 2026. Despite sustained dynamic resistance from the upper band of the parallel channel capping price since February 20, buyers respondeLongby azizelliott3
Mastering double tops and bottoms: avoid the falling knife trap!Every beginner wants to catch reversals, but most end up catching falling knives and top-ticking altcoins right before they rug your soul. So let's talk about one of the cleanest, most classic reversal tools we have: the double top and double bottom - and what actually confirms them on crypto. Because two bumps on the chart is not a pattern yet. It's just chaos with confidence. What is a double bottom / double top in normal human language? Double bottom Picture a W at the end of a downtreEducationby Trade_Logic_AI3

 LongLong
 Long

 Long
 Long

 Long

 Long
 LongLong

 Long
 Long


 Long


 Long
 Long
 Long
 Long
 Education