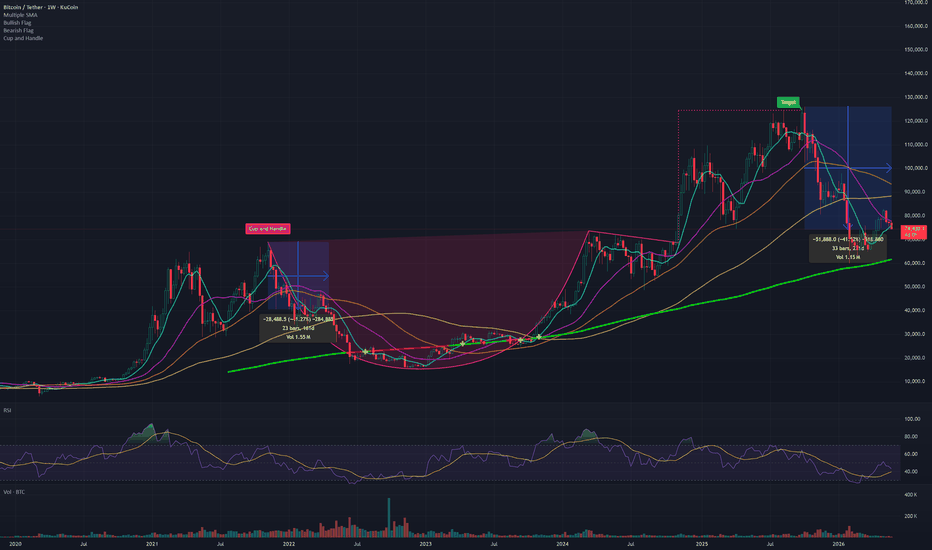
Bitcoin Cycle Analysis: Estimating the Bottom using RegressionIn our previous post, we used a straightforward cycle analysis based on weekly EMAs to estimate the next Bitcoin cycle bottom. You can read that analysis here .
In this post, we take a more advanced approach by applying polynomial regression. The full regression model can be found here . First we briefly outline how the model is constructed.
Model Construction:
For the bottom estimation, we use a cubic polynomial regression, defined by the function:
ax³ + bx² + cx + d
In this model x represents the weekly bar index, adjusted with an offset to account for the time between the genesis block and the first charted bar. y represents the Bitcoin weekly closing price. the a, b, c, and d parameters are coefficients derived through regression analysis
To construct the model, we use the cycle bottom values from the last four market cycles as input data. Input Data (Bottom Regression)
The (x, y) values used are:
(103, 2.5)
(267, 211)
(471, 3193)
(676, 16255)
The best-fitting curve is determined using standard statistical measures such as R², residual error analysis, and visual inspection. While the full methodology is beyond the scope of this post, these calculations can easily be performed using online regression tools.
Using this approach, the following parameters were obtained:
a: 0.000138314
b: -0.0768236
c: 13.90555
d: -765.8892
This results in the final regression function:
y = 0.000138314x³ - 0.0768236x² + 13.90555x - 765.8892
Estimating the Next Cycle Bottom:
With the bottom line regression curve established, we can now use extrapolation to estimate the next Bitcoin cycle bottom.
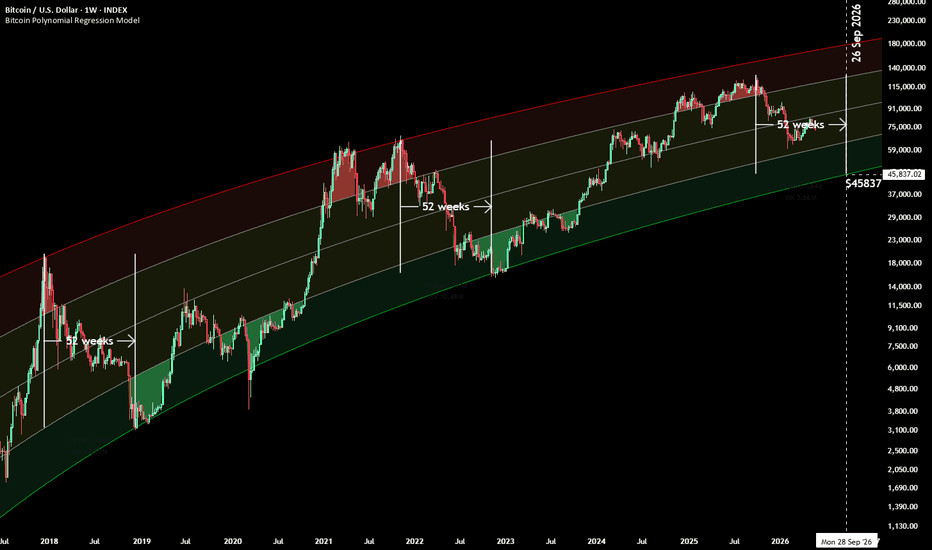
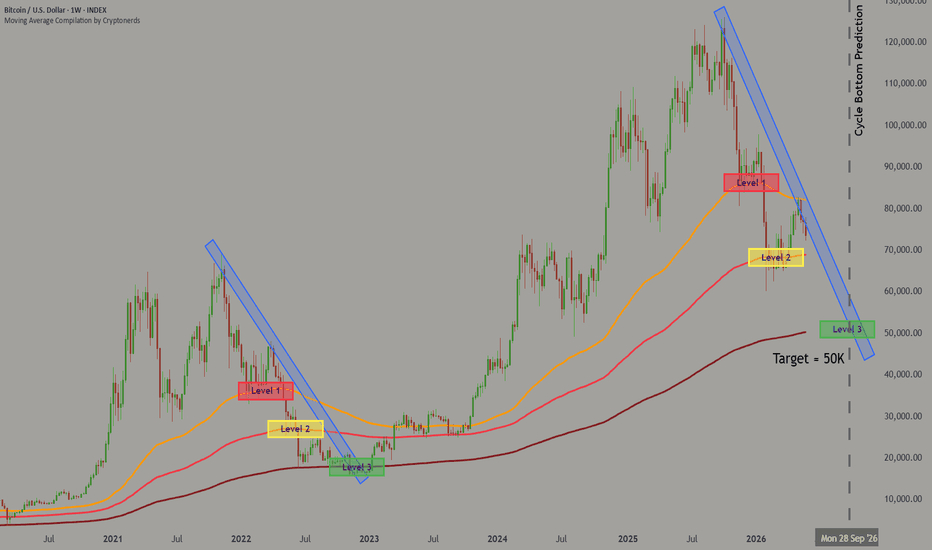
First, we estimate the likely timing. Based on the last two cycles, the transition from cycle top to bottom took approximately 52 weeks (one year). Applying this pattern to the current cycle suggests a potential bottom around September 28, 2026
Next, we look up the corresponding value on the regression line at this point in time which is $45,837.
Conclusion:
Using polynomial regression, the model estimates that the next Bitcoin cycle bottom could occur around September 28, 2026 , with a projected price of approximately $45,837 .
Economic Cycles
Bitcoin Cycle Analysis: Estimating the Next Bottom using EMA'sIn this post, we take a straightforward approach to estimating the potential cycle bottom for Bitcoin using the 100, 200, and 400 weekly moving averages. There is no need to always overcomplicate the analysis when simple historical patterns can also provide valuable insights.
Historical Observations
Looking at previous cycles, several consistent patterns emerge:
The 100, 200, and 400-week moving averages have historically acted as key levels of support and resistance.
In the past two cycles, the cycle bottom occurred approximately 52 weeks after the cycle top.
The magnitude of drawdowns each cycle has shown a trend of diminishing severity: 2017–2018 cycle approximately -84% and 2021–2022 cycle approximately -77%.
Current Market Context
Turning to the current cycle:
The maximum drawdown so far is only around -52%, which is notably shallower than previous cycles.
The 400-week EMA corresponds to roughly a -60% drawdown, still perfectly aligning with the concept of diminishing returns.
Outlook
Based on historical drawdown trends, the behavior of long-term moving averages, and the typical ~52-week bear market duration, we anticipate that the next cycle bottom may occur toward the end of September 2026 . This level is expected to coincide with a retest of the 400-week moving average, with a projected price range around $50,000 , and the potential for temporary downside extensions toward $45,000 .
Good luck, and trade safely! 🙏
MP Material | Wyckoff logicMarket Outlook: "At a Crossroads"
Current Bias: Slightly Bullish (60% Bullish / 40% Bearish)
1. Wyckoff Perspective (Accumulation)
- Structure: We have successfully completed the SC → AR → ST → Spring sequence.
- Status: A clear accumulation structure is in place. Following the Spring, we are currently seeing active demand entering the market, positioning us in the LPS (Last Point of Support) / SOS (Sign of Strength) phase.
- Takeaway: Smart money has likely initiated accumulation.
2. Technical Structure & Trend
- Progress: Higher Low established post-Spring; Downtrend line successfully broken.
- Bottlenecks: Price remains capped by key overhead resistance and supply zones.
- Trend Status: Shifted from Downtrend to Sideways-Up. (Not yet confirmed as a full-blown Uptrend).
3. Volume & Momentum
- Volume: Lacks the explosive volume typically seen in an aggressive markup phase.
- Momentum: Neutral, with a slight bullish tilt.
- Takeaway: Momentum is building, but we are waiting for confirmation volume to validate the move.
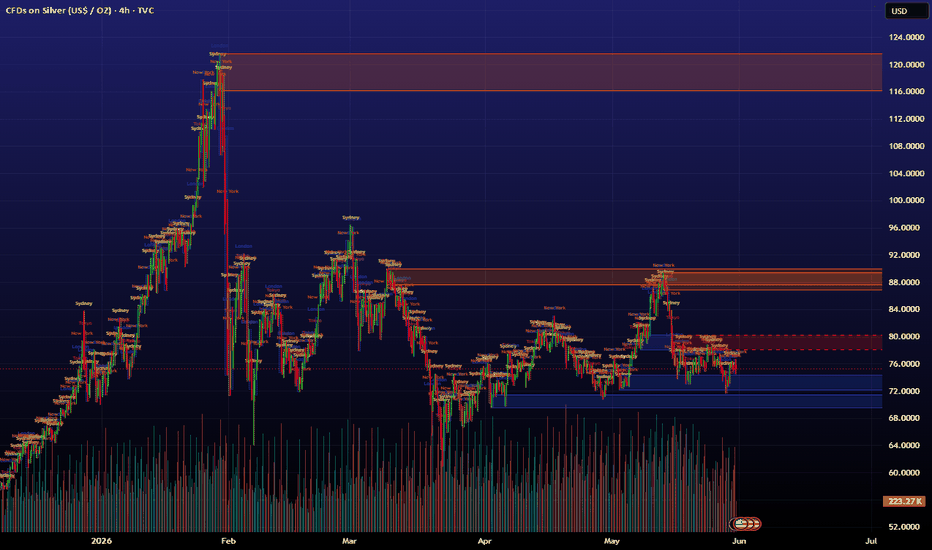
Scared of a Market Crash? Answer: SILVER, $SLV $AGQTVC:SILVER AMEX:AGQ AMEX:SLV Just like Gold exploded higher in late 2025 through early 2026 — delivering one of its strongest performances in decades with massive gains, repeated all-time highs, and prices surging well over $5,000/oz at peaks — TVC:SILVER , AMEX:SLV , AMEX:AGQ is perfectly positioned to follow the same pattern and potentially outperform it significantly.
While gold captured the safe-haven spotlight, silver combines monetary demand with powerful industrial leverage (solar, EVs, AI/electronics). This dual driver often leads to sharper, more explosive moves once momentum kicks in.
Silver Market Fundamentals & Outlook (as of late May 2026):
Current Price: Trading around $74–$77/oz
2025 Performance: Up over 140–160% in one of the strongest years on record
Market Structure: Sixth consecutive annual supply deficit expected in 2026 (~46–67 million ounces)
Heavy Buying from China: Record imports in 2026 — China imported ~836 tons in March alone (highest monthly total ever, 173% above 10-year seasonal average), with Q1 imports exceeding 1,600 tons driven by both industrial and investment demand.
Key Demand Drivers: Surging industrial use (solar panels, EVs, AI/electronics) + rising investment demand (bars, coins, ETFs).
Supply Constraints: Mine production largely flat; recycling unable to keep up with demand
Gold/Silver Ratio: Currently around 55–62:1 (still room for further compression in a bull market)
Analyst Outlook 2026: Many forecasts $90–$120+, with bullish targets as high as $135–$300+ in extreme squeeze scenarios. Michael Oliver, a financial analyst and founder of Momentum Structural Analysis, who predicted Silver going past $100 before the Metals Bull Run, suggests that if gold reaches the $8,000 to $10,000 range, the historical gold-to-silver ratio implies that silver's catch-up move could rapidly push it into the $300-$500/oz range.
AGQ 2x Leveraged Silver: Sitting at around $120/share, these could easily surge past $1,000-$1,200 if Silver breaks $300/oz.
Impact of Rate Cuts Under Kevin Warsh:
Kevin Warsh, who just took over as Fed Chair in mid-May 2026, is generally viewed as more market-friendly and growth-oriented than Powell. Markets are pricing in the possibility of 1–3 rate cuts in the second half of 2026 (especially if inflation cools or economic data softens post-SpaceX IPO volatility).
Lower rates reduce the opportunity cost of holding non-yielding assets like silver.
Weaker USD and lower real yields historically drive strong precious metals rallies.
Silver benefits even more than gold due to its industrial leverage.
Silver could be the perfect safe haven asset in case of a major market correction or profit-taking rotation following the highly anticipated SpaceX IPO (expected mid-June 2026). After the summer hype or toward September–October, any broad market selling could drive strong flows back into silver as investors seek protection — just like we saw with gold during previous periods of volatility.
Why Silver is Primed for More Upside:
Persistent global supply deficits draining inventories for the 6th straight year.
Record heavy buying from China — pulling physical silver from global markets at unprecedented levels.
Explosive industrial demand from green energy and tech sectors
Strong investment flows into physical silver and ETFs.
Potential for further gold/silver ratio compression, following gold’s massive 2025–2026 move
Macro support from Fed policy, geopolitics, and dollar weakness.
BTC Cycle PivotsBottom Expected in Early July with a Potential Top in Mid-Late August
Another Bottom Expected in Mid Oct
Inversions should be considered so if Price Rallies into Early July Pivot (it will be a Top which should bottom in Oct)
Deviation should be allowed (+- 1 week)
Once this Ratio chart tests 6250 - 6640 Area, I expect that to be the Bear Bottom for 2026
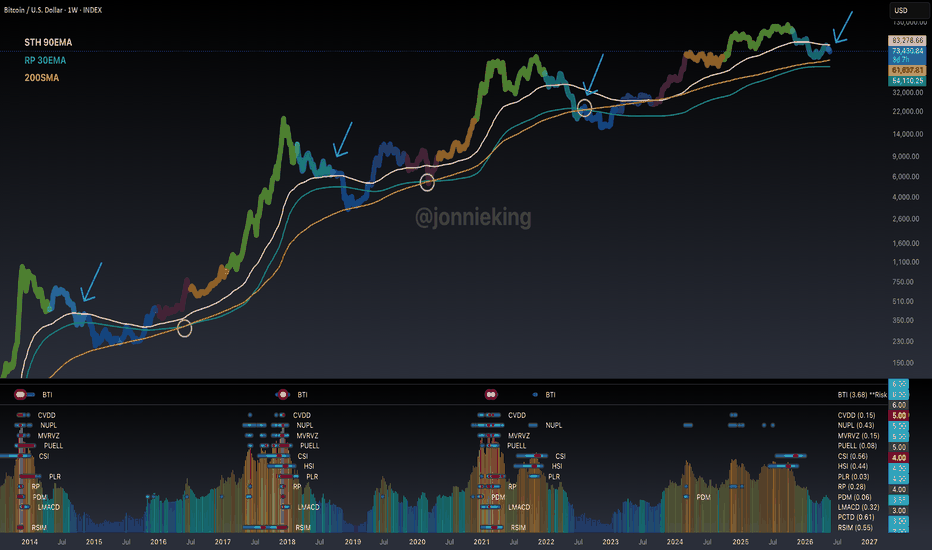
$BTC Rainbow Chart Analysis & Buy Signals: STH / RP / 200W SMAFirst blue dot of the cycle has appeared on the ₿itcoin Rainbow chart after PA got rejected from the STH 90EMA (short-term holder realized price of 155 days).
Now CRYPTOCAP:BTC makes its way down to inevitably test the 200SMA and RP 30EMA (Realized Price of ALL coins).
BUY SIGNALS will come when we get blue dots on the rainbow chart touching the 200SMA and RP.
Note: confluence comes when the 200SMA crosses above the RP, albeit it may be slightly early or late, but still gives plenty of signal for massive upside growth.
We want to see this in conjunction with the BTI (Bitcoin Top Indicator) and have dark blue bars with an aggregate risk score < 2.00
Bookmark this post and I’ll update you when the next signals come in 💯
P.S. Notice on the BTI, the ONLY top signals that printed red this cycle were the CSI (Calendar Seasonality Index) and HSI (Halving Seasonality Index) aka 4-year cycle time based top 🤓
I wonder if everyone’s favorite armchair analysts / spaces hosts are still gonna say the 4-year cycle is dead when BTC bottoms in Q4 🥸
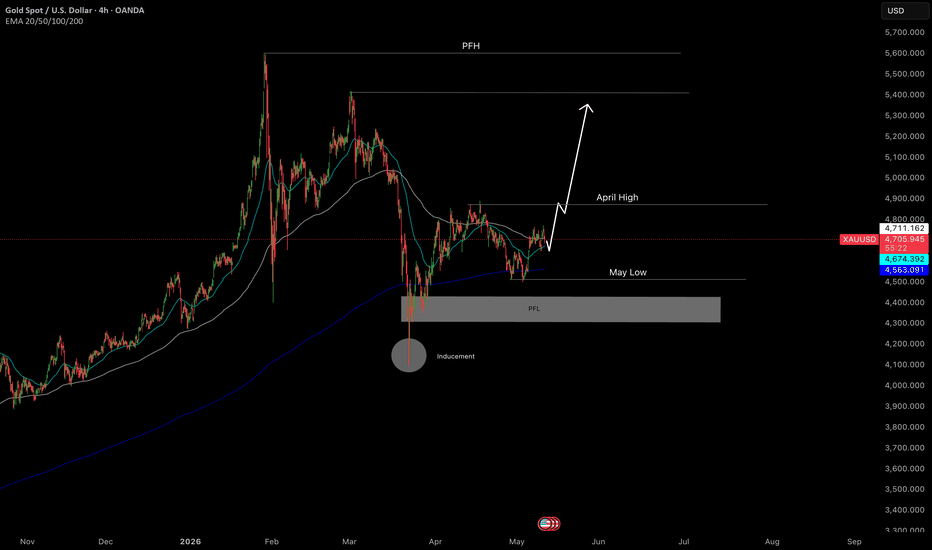
XAUUSD (12/05/26) long sentiment Hello everyone,
I am not typically a commodities trader, however I thought I'd provide a markup.
As we can see a large Double top high has formed, I have marked this PFH, many people would assume based of the size and severity of the formation that we will be seeing some rather exponential shorts.
In contrast, based on recent price action, specifically the low made in march, I believe that was the first leg of a reset. The extremity of the shift to the low, shows an inducement short. Price pulled back up from that low rapidly also. You can then observe a steady rise up until April where we then saw a pullback creating Mays current low, which if you look is price resetting on the 800EMA. I believe from this small observation that we will see price long, to confirm this further, price needs to close above Aprils high. If my bias was to become invalid, price would need to surpass the low made on the 4th May.
If you want to share your views and opinions please feel free to comment.
Thank you for reading.
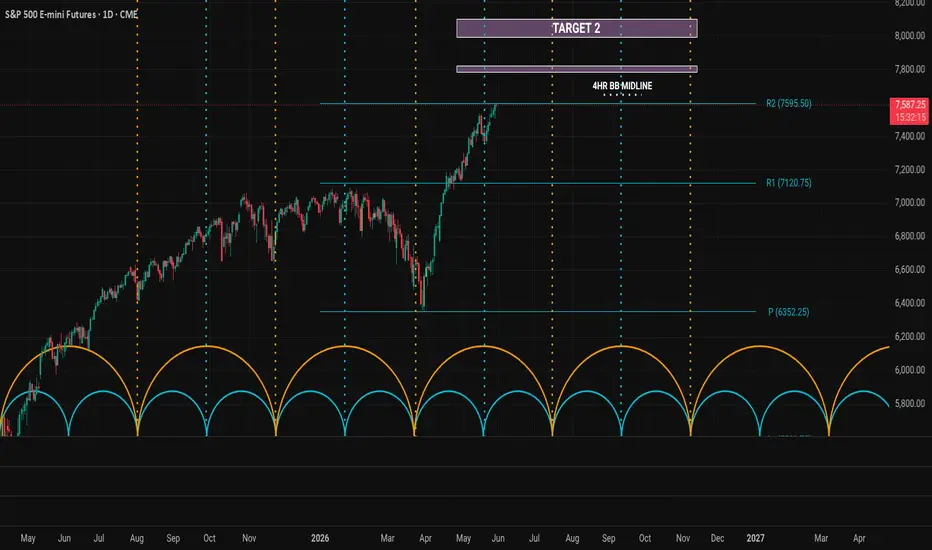
2140 is the estimated endpoint of BTC issuanceWhat happens if we project cyclical, geometric, harmonic, range-based, and chart-derived timing structures far into the future?
The strongest near-term monthly concentrations currently appear around 2026–2028.
But more interestingly, the models also begin detecting isolated far-future timing “islands” — clusters that tend to densify as time approaches.
A notable cycle nest appears around 2050, followed by isolated projections around 2065 and September 2085.
After 2100, the period between 2110 and 2121 suggests a structurally denser and potentially more volatile environment.
Every projection is mathematically tied to a pivot of origin — and each origin carries a particular character. For instance, the 2140 projection shown here is linked to the 2020 low.
This is the aspect I find most fascinating:
timing is not only a decision layer for trading activity — it also creates thematic continuity across time. Themes, headlines, topics, trends, moods, they are reverbate mathematically.
AUD Cot extreme positioning unwindAUD/USD positioning is extremely crowded long (~85% long COT).
Price initially kept rising, but now rallies into ~0.718 are repeatedly failing.
Momentum and structure are weakening:
lower highs
weaker rebounds
MAs rolling over
price spending more time below resistance.
So the thesis is:
Crowded longs are no longer being rewarded, which may be the early stage of a positioning unwind.
BUT:
the unwind is not fully confirmed yet.
Confirmation comes if:
price breaks/accepts below ~0.709
rebounds stay weak
ideally COT eventually rolls over too.
📊 The 0.718 zone is now VERY clearly defined
You can now see multiple failed interactions there:
reclaim attempts rejected
lower highs beneath it
MA cluster rolling over underneath resistance
Key near-term level:
~0.712–0.713
If price:
keeps leaning on it
rebounds weakly
then breaks lower
…that starts opening:
0.709
then potentially acceleration.
Targets: 0.695, 0.685, 0.67
BTC Time and Price Clusters for JuneThis framework combines two structural components:
• Key timing windows (orange dashed lines)
• Multi-timeframe BTC price clusters grouped in $1,000 buckets
The idea is not to predict direction mechanically, but to identify where timing and structure become aligned.
The highest-quality reversals tend to occur when:
1. price reacts inside a dense cluster zone,
2. while having “clean air” ahead:
* no nearby high-density S&R clusters,
* and no immediate timing compression window approaching.
In other words:
compression → reaction → expansion potential.
Dense cluster zones often behave as structural friction or absorption regions.
Lighter areas between clusters frequently allow faster price travel and momentum continuation once the denser region is cleared.
The timing map then helps evaluate whether the market is approaching another temporal compression window — or entering a structurally freer path.
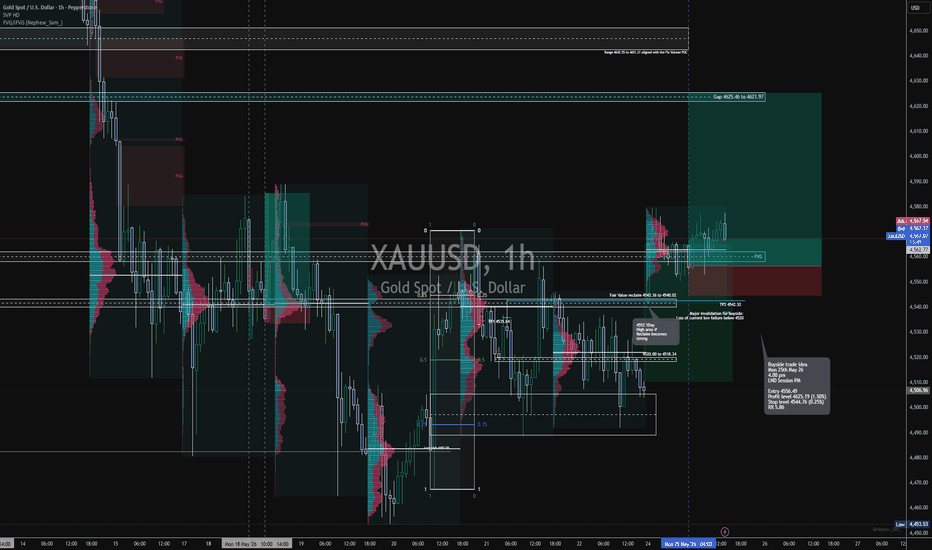
Long trade 🧠 SNAP MAP — XAUUSD Buyside Trade Idea
PAIR: XAUUSD
DIRECTION:🟢 Buyside
DATE: Mon 25th May 26
SESSION: LND Session PM
ENTRY TIME: 4.00 pm
ENTRY: 4556.49
STOP: 4544.76
TARGET: 4625.19
RR: 5.86
🧭 SNAP MAP
🧠 Bias 🟢 Bullish continuation bias
Price appears to be rotating higher after holding a key support base and reclaiming short-term fair value. The structure suggests a buy-side continuation map, not a reversal-from-high map.
Key-mapped locations:
4552 area → prior high / reclaim area
4536.16 to 4540.02 → fair value reclaim zone
4550.56 → Daily Open area
4588.91 → IWeek Hi
Target: 4621.97 to 4625.46 → upside gap/expansion target zone
👉 Trade logic: support reclaim → hold structure → expand into buyside liquidity / gap target
💧 Liquidity Draw
Primary draw:
🟢 Buyside liquidity above current range
🟢 Weekly high
🟢 Gap fill/expansion zone near 4625
🟢Highs above the current London / NY structure or external liquidity.
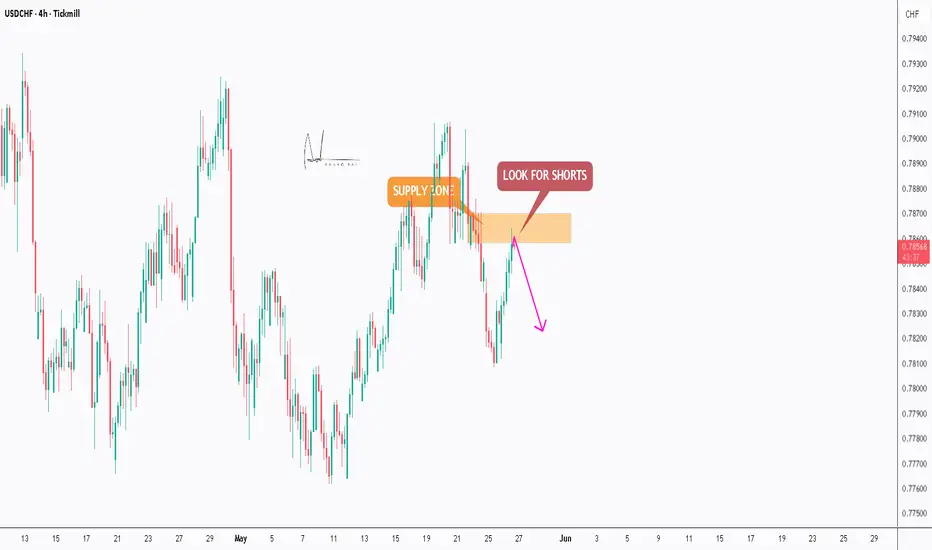
USDCHF - Supply Zone Rejection SetupHello Trading Fam! 👋
USDCHF is reacting from a key supply and resistance zone after a bullish pullback. The current rejection suggests potential short opportunities if sellers regain control and push price lower.
Don’t forget to like and share your thoughts in the comments! ❤️
160 Defense, Intervention Risk Remains but Bull Structure IntactWatching this pair closely from Tokyo today.
A few things standing out.
Current price: 159.15
Market Background:
- The Japanese government clearly wants to cap yen weakness
- They have intervened to defend the 160 level
- Despite intervention keeping markets nervous,
price is approaching 160 again
- Today, USD/JPY has been unable to break above 159.50
Structure Analysis:
- Long-term structure (520 & 20-period regression): Still pointing UP
- Mid-term (50-period regression): Turned DOWN
- ADX: 46.9 (strong directional momentum)
- Hurst Exponent: 0.4785 (expect pullbacks within the trend)
- RSI: 53.9 (neutral, not overbought)
Key Observations:
- USD/JPY and Nikkei used to move together —
that correlation has weakened significantly
- After the intervention, large institutional buying
(USD/JPY long) likely occurred around 155.50
- Japanese long-term yields continue to rise —
this keeps upward pressure on USD/JPY structural bias
View and Chart set up method:
Selling USD/JPY in the 159 handle looks like
the most attractive contrarian setup right now.
Long-term bull structure remains intact.
But this is not the time to aggressively chase longs.
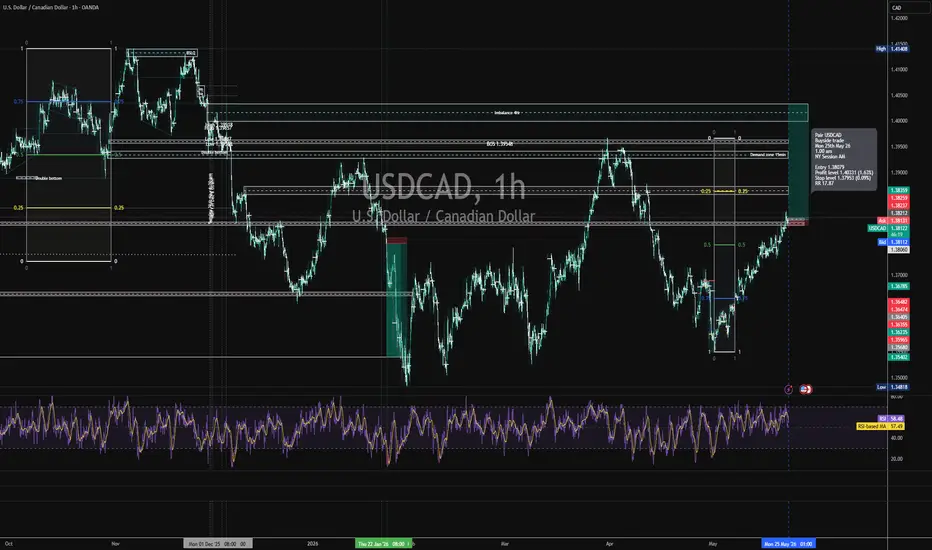
Long trade
PAIR: USDCAD
DIRECTION:🟢 Buyside
DATE: Mon 25th May 26
SESSION:NY Session AM
ENTRY TIME:1.00 am
ENTRY:1.38079
STOP:1.37953
TARGET:1.40331
RR: 17.87
🟢 Bias: Buyside
USDCAD is rotating higher from the May discount base and building a cleaner bullish delivery model within the 4H/1H structure. The larger structure shows price recovering from the lower range, respecting higher lows, and pushing toward premium-side liquidity above 1.39670 and into the 1.40331 imbalance/target zone.
🟢 Buyside Range Logic: Price created a May low
→ built higher lows → reclaimed internal fair value
→ is now attempting expansion toward a premium imbalance / demand-zone objective.
Trigger Type:
🟢 Buyside continuation/range reclaim trigger
Trigger sequence: Price held a higher-low structure
→ reclaimed internal range
→ 5m showed support around the daily open / lower cloud
→ price began pressing higher
→ entry activated at 1.38079
→ target mapped to 1.40331
🔥 Follow-through above 1.3835 / 1.3860.
Until price clears that area, this is still a buyside continuation attempt, not full expansion confirmation.
🔹 Entry: 1.38079
🔒 Stop: 1.37953
🎯 Target: 1.40331
💧 Liquidity draw: 1.39670 high → 1.40331 imbalance
⚠️ Invalidation: loss of 1.37953 and failure back below the reclaim zone
Short trade
PAIR: GBPJPY
DIRECTION: 🔴 Sell-side
TRADE TYPE: Liquidity Sweep → Premium Rejection → Discount Delivery
ENTRY: 214.285
STOP: 214.544
TARGET: 212.638
RR: 6.36
🔴 Bias: Sell-side
GBPJPY has pushed into a premium / upper-range area around 214.20–214.50.
Price is showing rejection near the upper band after sweeping/attacking buyside liquidity.
The larger chart shows that the price has already made a strong upside rotation, but the current location is now expensive. This makes the sell-side idea valid only if price fails to hold above the 214.29–214.54 zone.
Price rallied into the premium
→ Buyside liquidity was attacked near 214.29
→ Price is stalling below the stop zone at 214.544
→ Current structure is forming a potential distribution shelf
→ Sell-side delivery targets the lower range
→ Final target sits at 212.638
🔹 Entry: 214.285
🔒 Stop / Invalidation: 214.544
📊 Fair Value / Midpoint: 213.70–213.85
🎯 Target: 212.638
💧 Liquidity Draw: Sellside liquidity below the current consolidation
✅ Valid sell-side trade idea
⚠️ Not yet a fully confirmed short
🔥 Strong RR and clean invalidation
🔒 Needs displacement below the current shelf before becoming high conviction
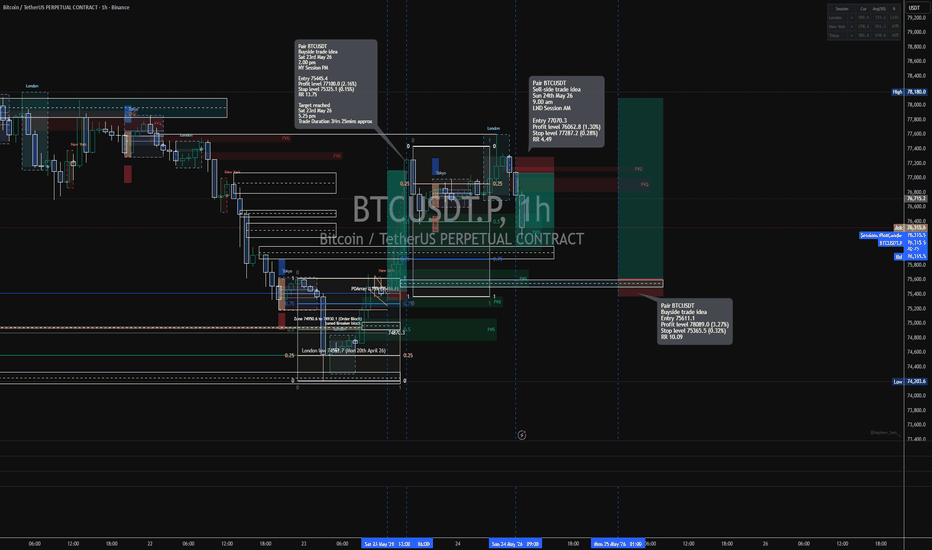
Short trade Pair: BTCUSDT
Direction: 🔴 Sell-side trade idea
Date: Sun 24th May 26
Session: LND Session AM
Entry Time: 9.00 am
Entry: 77070.3
Profit Level: 76062.8
Stop Level: 77287.2
RR: 4.49
👉 Core Read:
This sell-side idea is built on a rejection from the same upper premium zone
that previously completed the 23rd May buyside expansion.
→ 23rd May long completed in the 77100 area
→ 24th May London session pushes back into that upper zone again
→ Price fails to sustain above the premium / prior target area
→ Rejection sets up a sell-side fade back into lower intraday value
🧠 Read:
The common thread is a premium revisit to a previously completed expansion target,
followed by failure to continue higher. 🔒 As long as the price stays below 77287.2. The sell-side idea remains structurally valid.
🎯 Main draw remains:
76062.8
🔴 Sell Entry Zone:
77070.3
🔒 Invalidation / Stop:
77287.2
🎯 Main Target:
76062.8
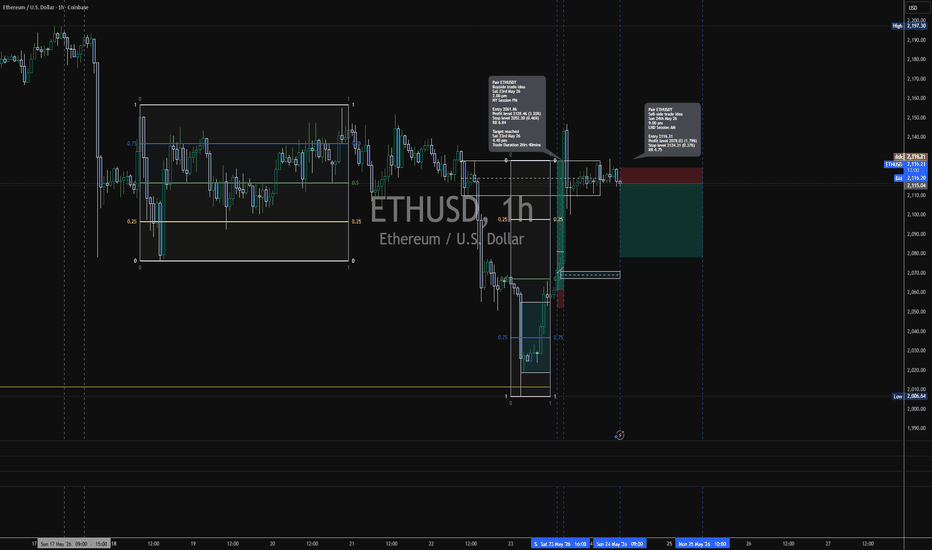
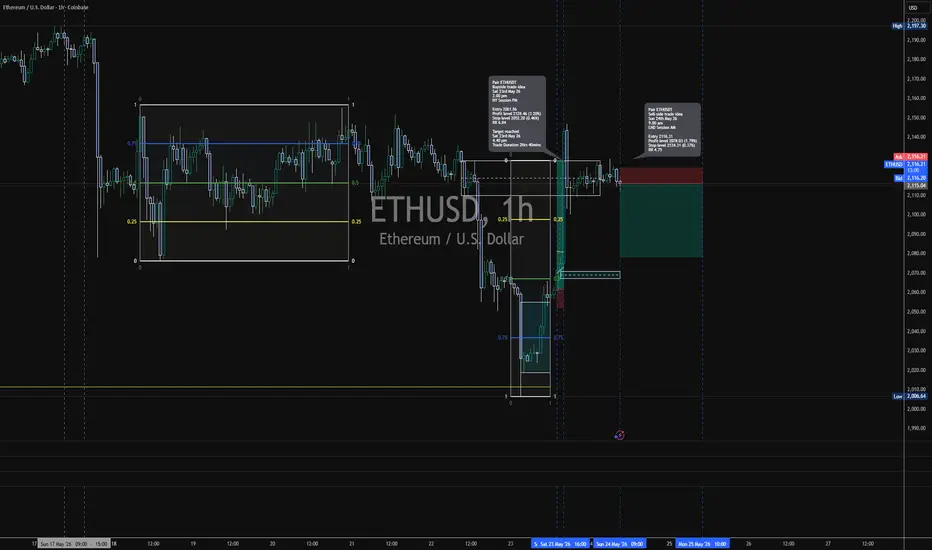
Short trade
Pair: ETHUSDT
Direction: 🔴 Sell-side trade idea
Date: Sun 24th May 26
Session: LND Session AM
Entry Time: 9.00 am
Entry: 2116.31
Profit Level: 2078.03
Stop Level: 2124.31
Risk: 0.37%
Profit Potential: 1.79%
RR: 4.75
Status:
Trade idea active / awaiting full downside delivery
🧭 SNAP MAP
Price rallied into upper intraday resistance
→ Liquidity was taken near the 2128 area
→ Price rejected back toward the 2116 zone
→ Sell-side entry activates at 2116.31
→ Stop protected above 2124.31
→ Downside draw mapped toward 2078.03
🔍 Journal Narrative
ETHUSDT moved into the upper intraday range after the previous buyside expansion. Price tapped the higher liquidity area near 2128, then began rejecting back toward the 2116 zone. The sell-side idea is based on failed continuation above the premium area, with stop protected above 2124.31 and target mapped toward 2078.03.
🔴 Sell Entry:
2116.31
🔒 Stop / Invalidation:
2124.31
🎯 Profit Target:
2078.03
⚠️ Risk Zone:
2116.31–2124.31
🔹 First downside checkpoint:
2108–2105
🔹 Mid-range downside checkpoint:
2095–2090
🎯 Main draw:
2078.03
GOLD Weekly Analysis | 24 May 2026XAUUSD Analysis | 4h Chart
Follow price OANDA:XAUUSD
❇️ Analysis Description: Gold is facing a major structural decision. The overall bias remains cautious, but a shift in market structure depends on how price reacts to the current downtrend line and key horizontal levels. Volume and momentum will dictate the next major trend.
🔄 Trend & Market Scenarios:
Bullish Confirmation (Breakout): If the price gains enough bullish momentum to break above the major downtrend line and the 4,560.60 resistance area, we expect a shift in market structure. Buyers will likely take control after a valid pullback to this flipped support area.
Bearish Continuation (Breakdown): If the sellers defend the trendline and push the price below the 4,455.60 support zone, the bearish momentum will intensify, opening the path for deeper corrective waves.
🎯 Key Structural Targets
🟩 Upside Targets (On Successful Break & Pullback): 4,663.40 (T1) | 4,767.60 (T2) | 4,871.10 (T3)
🟥 Downside Target (On Support Breakdown): 4,350.52 (T1)
⚠️ Note on Targets: As price reaches the first structural target, partial profit-taking (Save Profit) or trailing stops (Risk-Free) is highly recommended to protect capital against sudden market reversals.
💬 What is your view on Gold this week? Let me know in the comments!
💡 Quick Note: I drop daily Gold & Bitcoin signals on lower timeframes right here throughout the week! Make sure to follow my page so you don't miss out on these daily setups. 📲✨