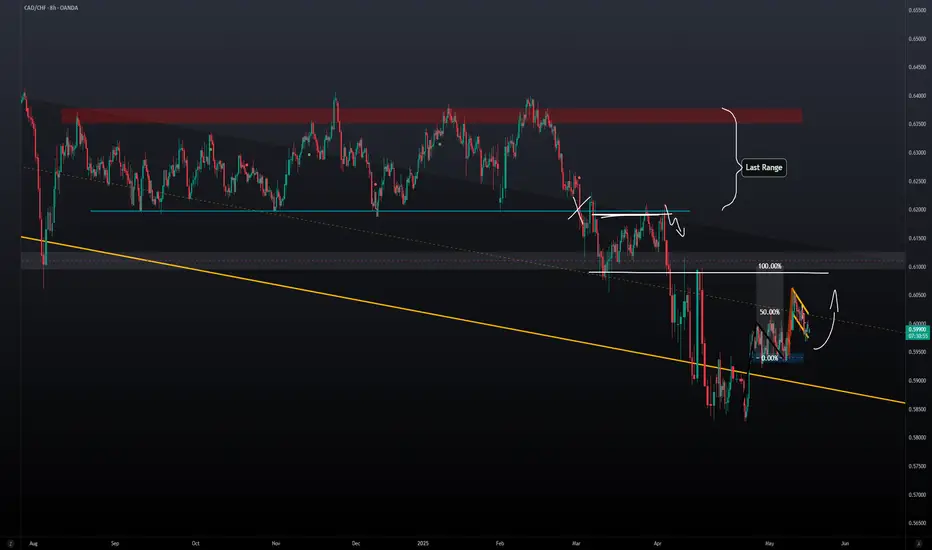
Fibonacci Extension
Litecoin to $1100 (12X) In This Coming AltseasonBased on tried and true fractals, multi-fib confluences, and historical price action, Litecoin is poised to hit prices between $900-1500 this cycle. The multi-fib confluences are pointing to $1100-1200 range as the most likely target. This is expected over the next 6-12 months if things continue to play out how I am expecting. As of today SEC approval of a LTC ETF is imminent but yet to be actualized.
JINDAL STEEL: Leading Diagonal Starting?JINDAL STEEL & POWER appears to be constructing an initial impulsive advance that may very well be taking the form of a Leading Diagonal. The advance from the 770 lows has so far developed into a structure where Wave 4 has overlapped with Wave 1 territory, suggesting that a classical impulse structure may not be applicable here. Instead, the price action fits neatly within the characteristics of a leading diagonal pattern, which allows such overlaps.
Wave 1 terminated at 923.80 followed by a co
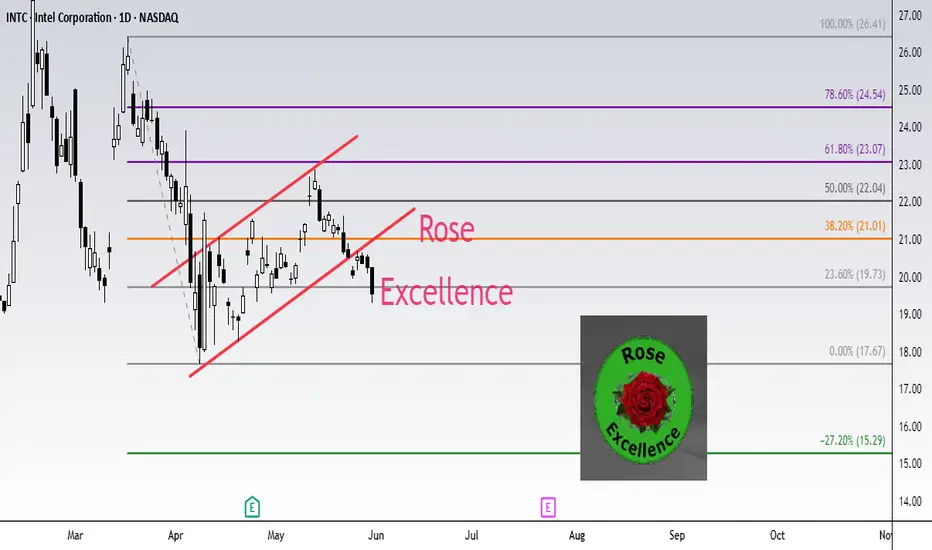
INTEL INTC Short setup target 15.29Fibonacci technical analysis : Intel Corporation NASDAQ:INTC has already found resistance at the Fib level 61.8% (23.07) of my Down Fib. The May 30th Daily candle has closed below retracement Fib level 23.6% (19.73), confirming a sell signal. A Bear Flag pattern has also formed. My Down Fib guides me to look for NASDAQ:INTC to eventually go down to hit first target at Fib level -27.2% (15.29).
NASDAQ:INTC – Target 1 at -27.2% (15.29), Target 2 at -61.8% (12.26) and Target 3 at -78.6 (1
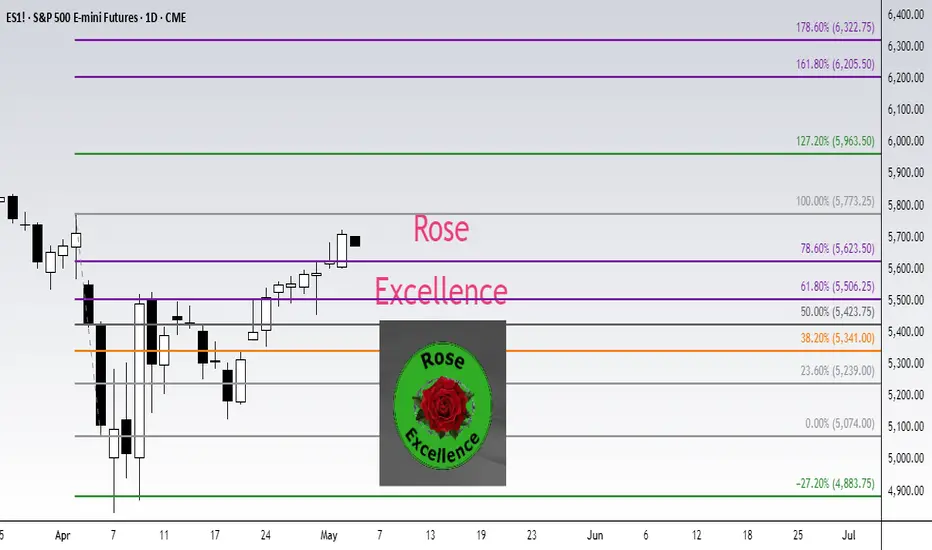
S&P ES Long setup target 5963.50 / Calls SPY target 596Fibonacci technical analysis : S&P 500 E-mini Futures CME_MINI:ES1! has already found support at the Fib level 78.6% (5623.50) of my Down Fib. Last Daily candle (May 2) has closed above retracement Fib level 78.6%. My Down Fib guides me to look for CME_MINI:ES1! to eventually go up to hit first target at Fib level 127.2% (5963.50).
CME_MINI:ES1! – Target 1 at 127.2% (5963.50), Target 2 at 161.8% (6205.50) and Target 3 at 178.6 (6322.75)
Stop loss slightly below the 61.8% retracement Fib
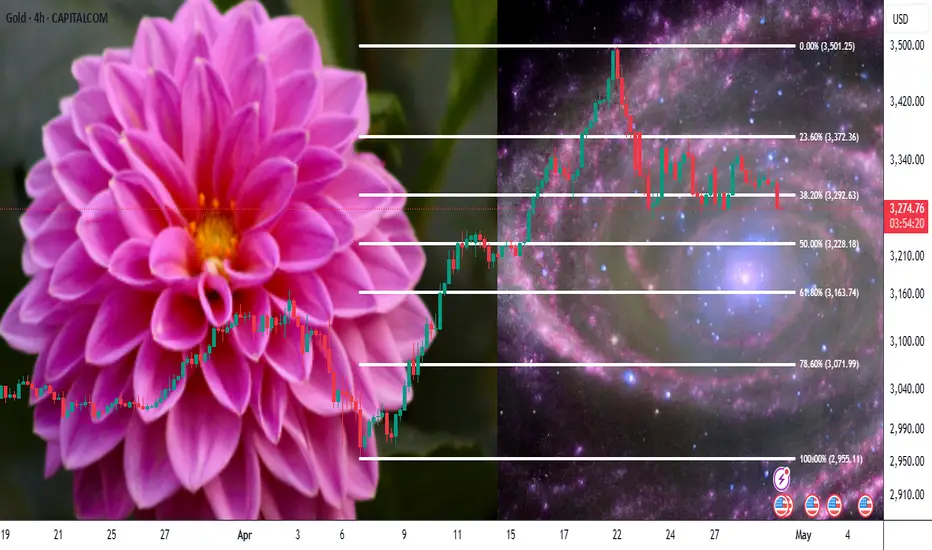
GOLD forms a DOUBLE TOP. Support 3200. Trend reversalGOLD is forming support for the double top reversal pattern
A break of 3200 will confirm the market's intention to reverse the trend and go downwards.
Scenario: There is a lot of important news from the US and Great Britain ahead. If the general fundamental background remains and the dollar continues its bullish trend, then we will be close to a breakdown of 3200.
Thus, a break of 3200 and consolidation below the level will be a signal that we are ready to go down.
NZDUSD is preparing for a reversal and a fallNZDUSD is in consolidation and preparing to exit it. Ahead is possible breakout of trend support and fall to 0.5757
The reason is as follows: change of fundamentals background (positive signals on tariff war), dollar growth and market reversal.
Scenario: break of consolidation support at 0.5885, price consolidation below this level - this will be a signal ready to start distribution, i.e. downward movement.
Primary target 0.5 fibo, secondary target 0.7 fibo
VIRTUALUSDT can derail support with momentumVIRTUAL is consolidating after the rally, but it cannot continue its growth yet. A descending triangle with a clear base support and a fourth retest relative to 1.877 is being formed, which in general only increases the chances of support breakout and decline
Scenario: if the compression of this format (within the descending triangle) continues and the price continues to compress to the support at 1.877, then in this case it will be possible to catch a breakout through a limit order. A sharp im
Fibonacci Extensions: Mapping Market Psychology Beyond the TrendHello, traders! 💫
Fibonacci numbers have traveled far from ancient Italian math to modern trading charts. In technical analysis, Fibonacci Extensions aren’t just mystical ratios; they’re a structured way to project potential price targets based on crowd psychology and trend continuation.
But what are they really, and why do so many traders draw those lines with near-religious fervor?
🧠 A Quick Historical Detour
Leonardo Fibonacci introduced the sequence to the West in the 13th century based
The Golden Code: Unlocking the Markets with Fibonacci Sequence “Mathematics is the language in which God has written the universe.” – Galileo Galilei
If this is true, then the Fibonacci sequence is the poetry of that language, especially in trading.
📚 What is Fibonacci? Why Should Traders Care?
Fibonacci is more than just a sequence of numbers — it’s a universal law of growth and proportion. From galaxies to sunflowers, and now to the charts on your TradingView screen, Fibonacci is everywhere.
In trading, Fibonacci retracement levels are used to ide
SUI - Double Digit is next - Alt season LeaderCorrection of the SUI is over, currently trading around the previous Support zone. i'm expecting this support to hold and bounce back from the support zone.
Once the price breaks from the falling wedge pattern we can expect the bullish momentum to start and hit new all time high.
Entry: after wedge breakout
Target 1: 2.8
Target 2: 3.49
Target 3: 4.5
Target 4: 5.3
Target 5: 6.3
Target 6: 9.2
SL below 1.68
Cheers
GreenCrypto
COTI WAVE 3 is coming COTI has completed its initial phases, Wave 1, 2 of Elliot waves and is preparing for Wave 3📈.
Also COTI V2, released recently, aims to revolutionize web3 privacy.
COTI’s market capitalization is $96 million, suggesting substantial potential gains during the upcoming bull market🚀.
This information is not financial advice. Conduct thorough research before making investment decisions.
Mastering Fibonacci Retracements & Extensions on TradingView!1. Introduction to Fibonacci in Trading
Fibonacci levels are widely used in trading to identify potential reversal zones, support, and resistance levels. These levels are derived from the Fibonacci sequence, a mathematical pattern found in nature and financial markets. Traders rely on Fibonacci retracements to find potential entry points and Fibonacci extensions to determine profit targets. The most critical area of interest is the golden pocket zone, which ranges between 0.618 and 0.65. Price
Manappuram Finance: Long-Term Breakout Alert🚀 Manappuram Finance: Long-Term Breakout Alert! 🚀
🔹 CMP: ₹230 | Stop Loss: ₹170 | Target: ₹290 | ₹372
🔍 Why Manappuram Looks Promising?
🔄 Technical Breakout:
A rounding bottom (or cup-and-handle) breakout with a well-defined base formation—indicating potential long-term upside.
📊 Accumulation Opportunity:
As the breakout occurs, retests may follow—offering an ideal opportunity for staggered accumulation. Long-term investors can accumulate on dips for better risk-reward.
📈 Target Calcula
Bitcoin - This indicator is always right! Crash to 40k in 2026.What we can see on the chart is Bitcoin cycles. We can statistically predict Bitcoin moves with this simple chart, because it's always right and never wrong. What can we say with certainty?
Statistically:
Bitcoin's bull markets last for 742 to 1065 days
Bitcoin's bear markets last for 364 to 413 days
Correction is every time weaker, but still huge
The recent uptrend on Bitcoin started in December 2022 and ended in January 2025 (791 days). We know that statistically bull markets last fo
Bitcoin - 60% crash to 32K | ETH is dying | Trump scam?Technically, Bitcoin is entering a huge bear market! This is what my charts and fundamentals tell me at the moment.
Trump returned to the White House on January 20, 2025. This day, Bitcoin hit a new all-time high (109,588 USD), and since then, Bitcoin has been going only down! In 2019, Trump said he is not a fan of crypto. x.com
So isn't it weird that Bitcoin has been going down since the beginning of his presidential post? (On January 20). Random or planned? Answer by yourself, but somethin
Hedera Goes From April Highs, To ATH, To Elliot Wave Theory? Lets break down what COINBASE:HBARUSD may be setting up for a long-term scenario!
We saw a impressive Bullish Rally from beginning of November 2024 that facilitated a Breakout of the April 2024 High @ .1842 to then create its All Time High @ .4010.
With this Price Action going from a Significant Low to create a new Higher High, we can apply the Elliot Wave Theory which is first supported by seeing some sort of Fibonacci Retracement from the Low to New High and we see that February of 2025 de
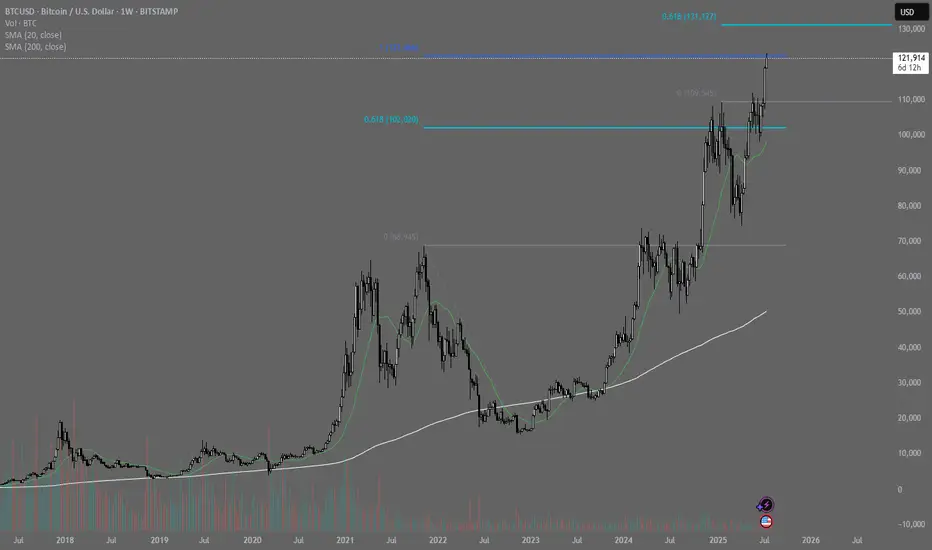
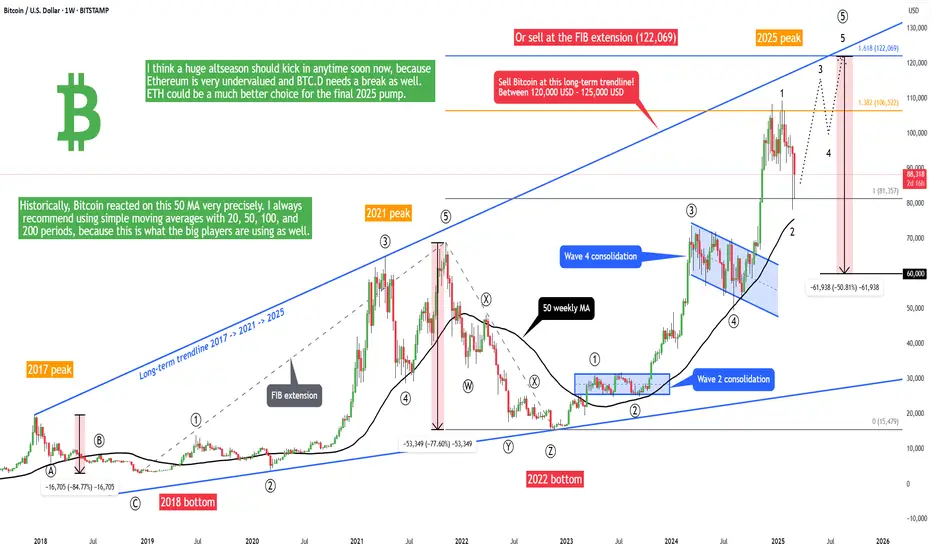
Bitcoin - Historical trap (122k then 60k in 2026)Bitcoin is in the final stage of the bullish cycle, and we want to look for the best price to sell and prepare for the 2025/2026 bear market! The best price to sell Bitcoin is at the 1.618 FIB extension or at the main long-term 2017-2021-2025 trendline. This is exactly at 122,069, as we can see on the chart.
Many people are saying that it's over for Bitcoin and that Trump's post was a giant trap. I think we will see a final 2 waves on Bitcoin to form an ending diagonal wedge pattern (1-2-3-4-5)
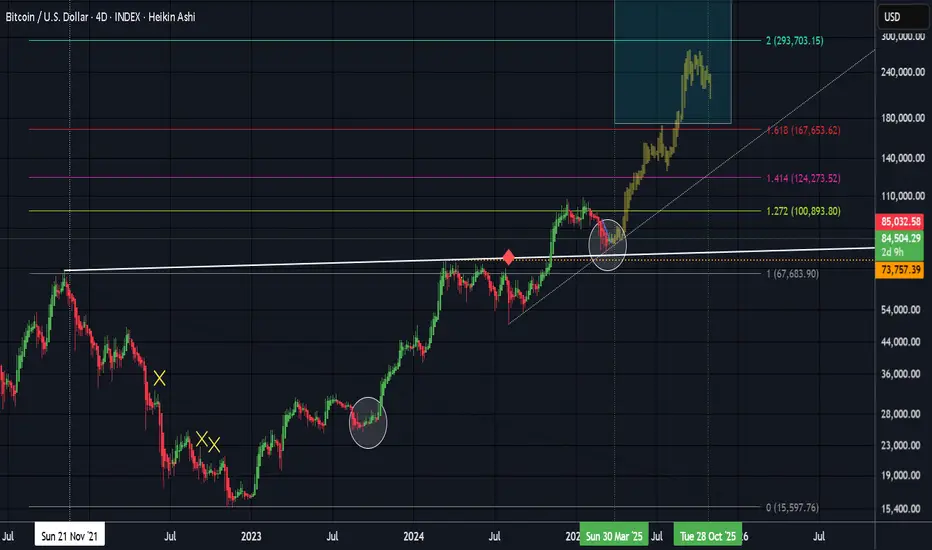
BTC shortFollowing this pullback, my prediction suggests a further decline with a target at $70,000, marking the first Fibonacci extension level in this sequence. This $70,000 target is particularly significant as it closely aligns with Bitcoin’s previous all-time high of around $69,000, reached in November 2021.
XAUUSD: Riding the Trade War Wave: Will We See New Highs?Hey Realistic Traders, Will OANDA:XAUUSD See New All-Time High Soon? Let's dive into the analysis...
Analyzing XAUUSD price movements using Elliott Wave Theory suggests a possible significant upside in Wave 5. Wave 3 previously didn't go beyond the 1.618 Fibonacci extension, classifying it as a normal wave. Wave 4 then retraced to around the 0.618 Fibonacci level, forming a bullish descending broadening wedge pattern.
The breakout from this descending broadening wedge on the 1-hour char
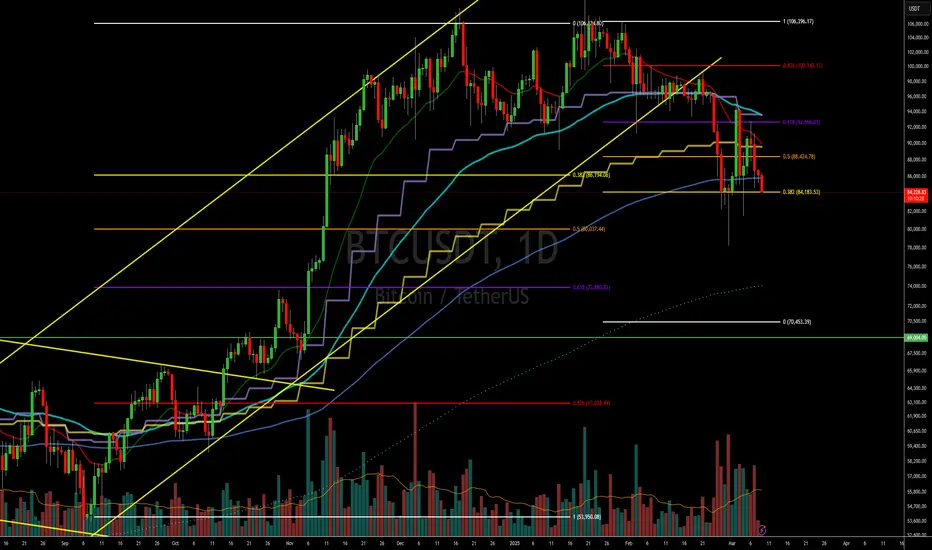
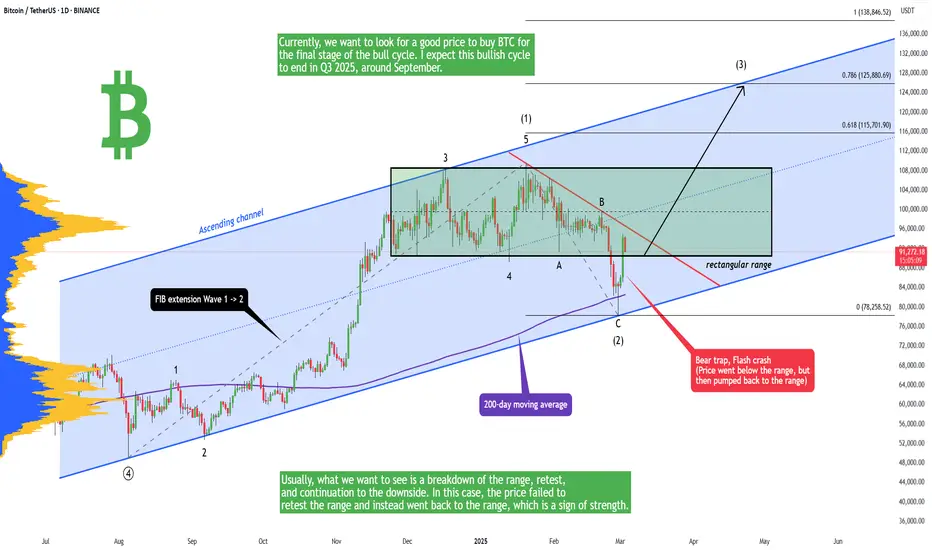
Bitcoin - Dump and Pump | Crypto resurrected - next 125,000 USDLast week Bitcoin and the whole crypto market dumped like crazy, but on Sunday at the start of March, the crypto market was resurrected from the abyss! After Trump's post, the crypto market pumped in a very short period of time. But let's take a look at the technicals.
The price dropped below the rectangular range but then pumped back into the range. What does it tell us? Usually, what we want to see is a breakdown of the range, retest, and continuation to the downside. In this case, the price