Short
Short
 Long
Long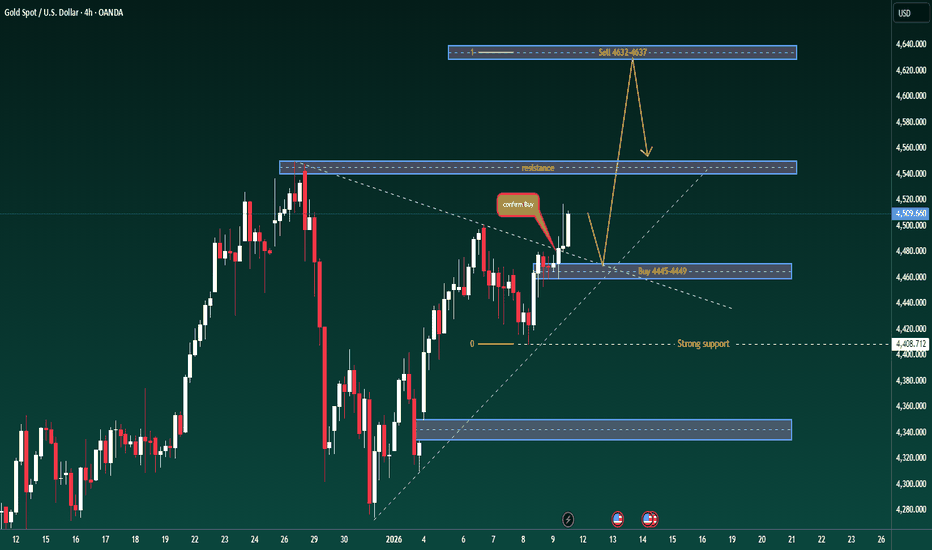
 Long
Long
GOLD - Storm 4475 ahead of the news. NFP aheadFX:XAUUSD is stabilizing at 4475 in a state of consolidation. However, ahead lie US employment data and the Supreme Court's decision on Trump's trade powers...
Fundamentals:
60K new jobs are expected to be created in December, unemployment may fall to 4.5%, and wage growth to 3.6% y/y. As for the Supreme Court, it will decide whether Trump can impose tariffs without Congress' approval (IEEPA law).
The market also continues to expect 2-3 interest rate cuts in 2026. Geopolitical tensions are supporting demand for defensive assets.
Today, the market is waiting for NFP. Strong data will lower expectations of Fed easing, strengthen the dollar, and put pressure on gold (to $4300), but weak NFP data will reinforce bets on rate cuts and support gold (to $4550). The court's decision on tariffs will affect trade policy and the dollar.
Resistance levels: 4475, 4500, 4525
Support levels: 4460, 4442, 4427
A breakout and consolidation above 4475 could open the way to 4500, a breakout of which could trigger a rally to 4525-4550, but given the volatility of the news, the market may test the support zone before a possible rise.
Best regards, R. Linda! Long 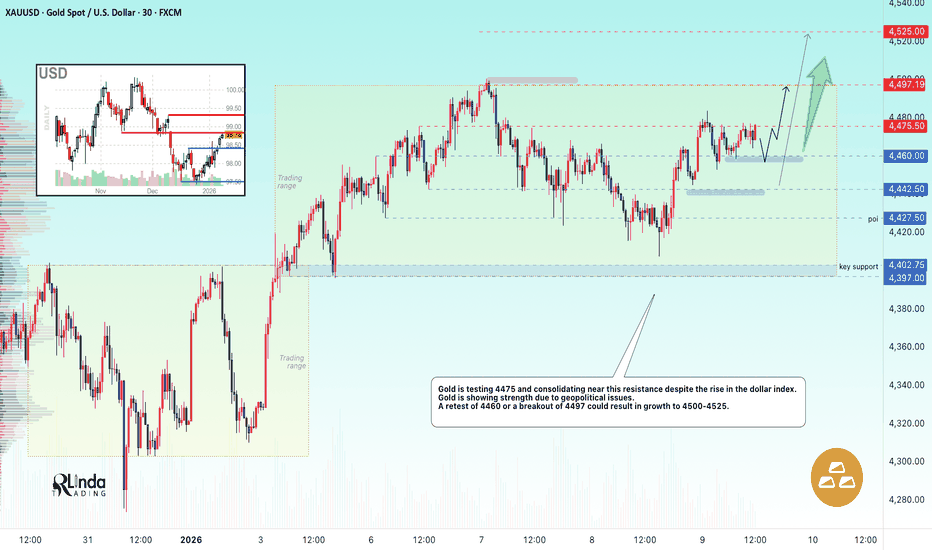
MFST: Flipping Roles between Support and Resistance➡ One of the most basic principles in technical analysis is that when price breaks above a well-defined resistance, that same level often flips its role and starts acting as support. This happens because what was once a selling zone becomes an area where buyers are now willing to step in.
MSFT presents a textbook example of this behavior.
➡ In late 2023, the stock delivered a strong breakout above resistance zone of 350. After the breakout, price rallied nearly 30% before pulling back to retest this same area. That retest also aligned closely with the 50% retracement of the entire rally from the October 2022 lows to the July 2024 highs, adding further technical significance to the zone.
➡ The successful hold of this former resistance led to an even stronger move. MSFT then went on to stage a sharp rally of nearly 60%, advancing from around 344 to 555.
➡ At present, the stock is once again in a corrective phase, moving back toward the 450 zone- a level that previously acted as resistance and now has the potential to function as support.
➡ If this zone manages to hold, the probability of another upside leg increases, and a move back toward 555 or even higher levels cannot be ruled out.
Share your thoughts in the comment section below.
Thanks for reading.
📣Disclaimer:
Everything shared in this idea is meant for education and general awareness only. It’s neither a financial advice, nor a recommendation to buy, sell, or hold any asset. Do your own research, manage your risk, and make sure you understand what you’re getting into.  Long
Long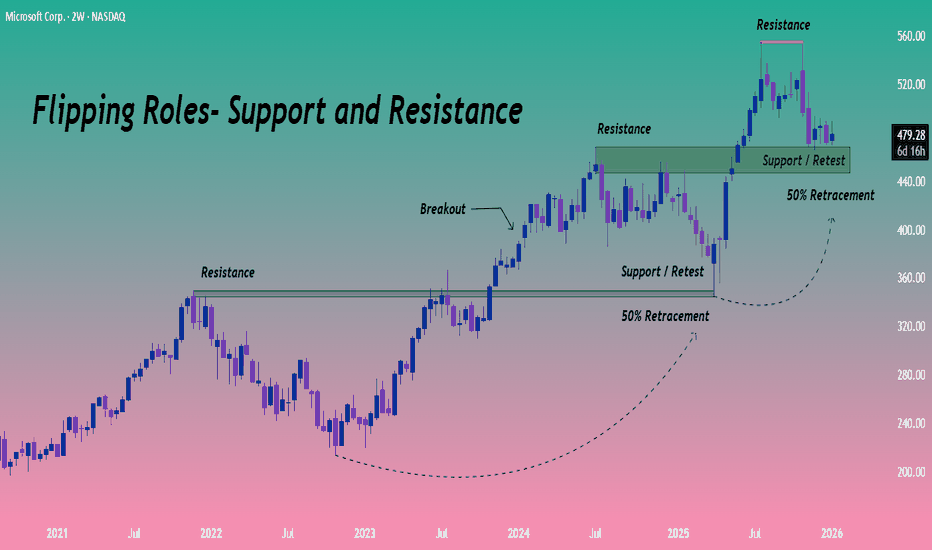
 Long
Long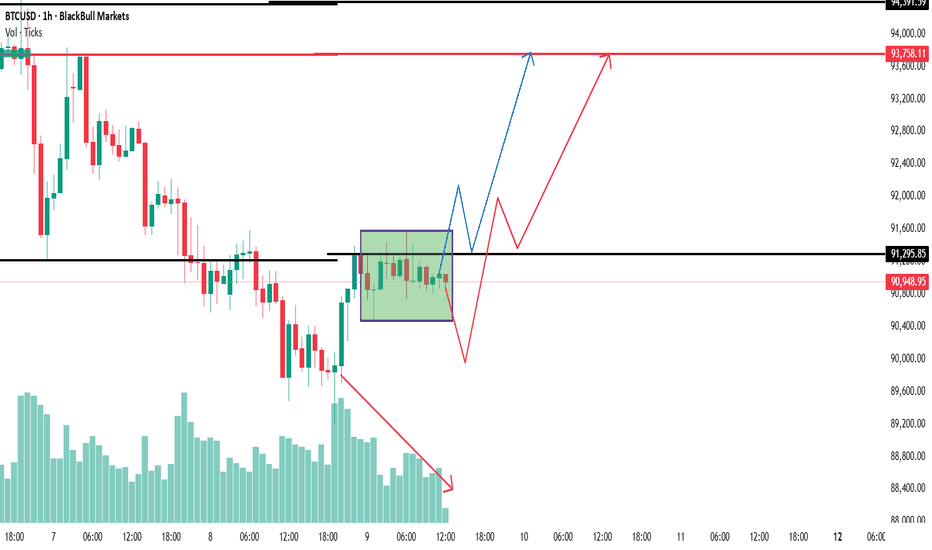
 Short
Short
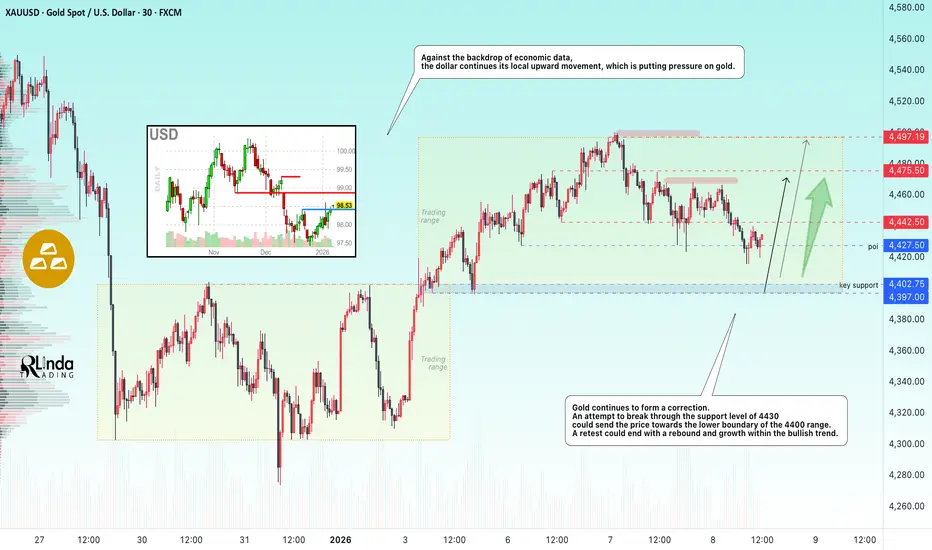
GOLD - Correction and retest of support on a bullish trend FX:XAUUSD is forming a correction from the resistance level of 4500 and reaching a local low of 4415. Against the backdrop of DXY growth, the correction may continue. The market is awaiting economic news...
Mixed US data: JOLTS job openings fell to 7.146 million. ADP employment rose by 41,000. The ISM services index rose to 54.4, which is higher than expected.
Expectations for two Fed rate cuts in 2026 remain (≈61 bps). The fundamental backdrop is mixed, with additional confirming data needed.
Geopolitics supports demand: the US has confirmed negotiations on the acquisition of Greenland. China has imposed a ban on the export of dual-use goods to Japan. The focus is shifting to Friday's US employment report (NFP).
The correction in gold appears to be temporary amid continuing expectations of Fed policy easing and geopolitical tensions. The NFP report will be the decisive factor in determining the direction — weak data could trigger a new round of growth.
Resistance levels: 4442, 4475, 4497
Support levels: 4427, 4400
As part of the correction, gold may test the support zone of 4425-4400. Overall, the trend is bullish, and the market correction may be temporary. A false breakdown and the bulls holding the price above key zones could trigger growth towards the flat resistance.
Best regards, R. Linda! Long 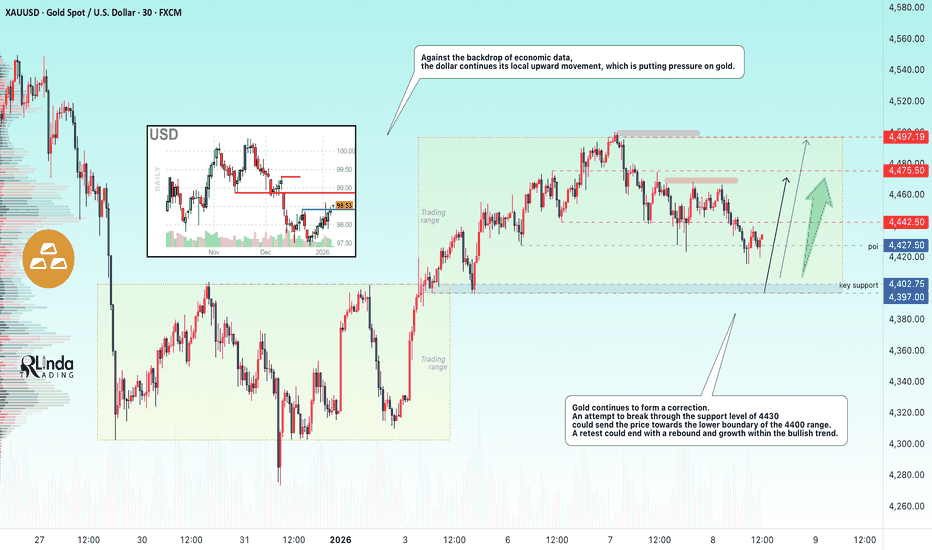
BTC/USDT 4H Chart📈 Trend
Main trend: up
Local trend: downward correction
The uptrend line (black) has still not been broken → this is crucial.
🟩 Support Zones
The most important levels you have well-marked:
91,120 – 91,400
Current price reaction
Local support + mid-range
Decisive in the short term
90,120
Very important zone
Overlaps with:
previous consolidation
potential retest of the trendline
Loss = deepening correction
88,843
Strong structural support
If price reaches here → high probability of bounce
87,235
Bulls' last line of defense
Break = structure changes to bearish
🔴 Resistance
91,400 – 91,500
Nearest resistance
Here we'll see if the uptrend has fuel
92,718
Very important level
Return above = bulls regain control
94 834
High / supply zone
Unlikely to be broken on the first try without an impulse.
📊 Stochastic RSI
Was heavily oversold.
Now bouncing from the lows → a short-term bounce signal.
Note: in an uptrend, the Stochastic RSI often gives false short signals.
➡️ Supports a corrective bounce scenario, not a dump.
🧠 Scenarios
🟢 Baseline scenario (more likely)
Defense 90-91k
Bounce → test 91.5k → 92.7k
Consolidation and decision
🔴 Negative scenario
Break 90 120
Down to 88.8k
Reaction there (or fake breakdown)  Long
Long
GOLD - Retesting support at 4440 ahead of the news FX:XAUUSD is correcting from weekly highs of $4,500 amid a rising dollar and profit-taking ahead of key US labor market data
The market expects two Fed rate cuts in 2026. The ISM Manufacturing PMI in December (47.9) was lower than expected, reinforcing expectations of a dovish policy. In addition, geopolitical risks remain (Russia's actions off the coast of Venezuela, tensions between China and Japan), which continue to fuel demand for safe-haven assets.
Today, ADP employment data, JOLTS job openings, and the ISM services index will be released. Weak indicators could increase pressure on the dollar and support gold.
The correction appears to be technical amid profit-taking. The uptrend remains intact as the dollar remains under pressure due to expectations of Fed policy easing. Any decline in gold can be seen as a buying opportunity.
Resistance levels: 4475, 4497, 4520
Support levels: 4442, 4430, 4402
Two key support zones relative to the current trading range: 4442 - 4430. A long squeeze and liquidity capture followed by price consolidation above key levels could shift the imbalance towards the buyer (bullish trend)...
Best regards, R. Linda! Long 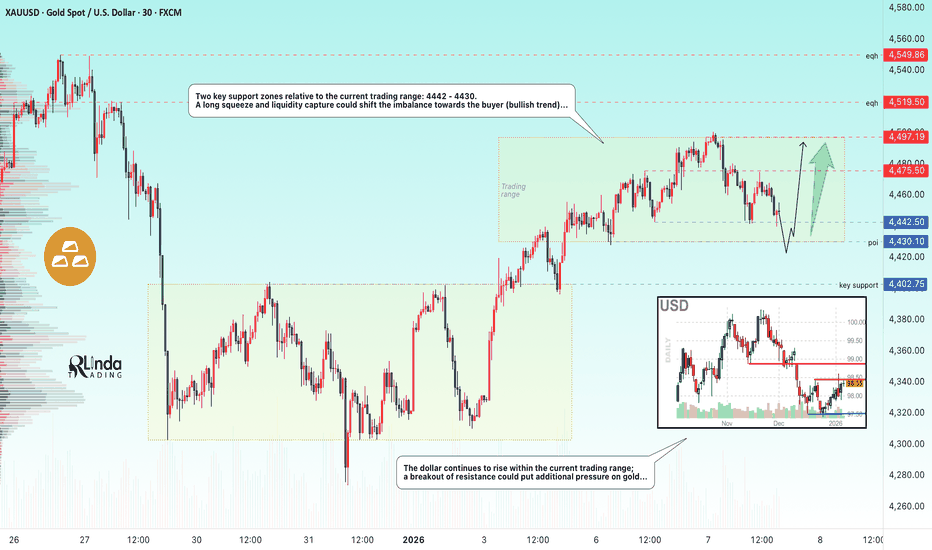
GOLD - Consolidation before resistance at 4470. Bullish trendFX:XAUUSD resumes growth and tests 4470, an important resistance level, amid a weakening dollar caused by expectations of further easing of Fed policy and continuing geopolitical uncertainty.
Expectations of a Fed rate cut intensified after the release of weak ISM Manufacturing PMI data.
Geopolitical risks have temporarily receded into the background, but remain a potential catalyst for a new wave of demand for safe-haven assets.
Attention is shifting to US labor market data (ADP report and JOLTS vacancies on Wednesday, NFP on Friday). Weak employment figures could increase pressure on the dollar and support gold.
Important nuances: China and Russia's reaction to US actions in Venezuela, as well as the open conflict between Russia and Ukraine.
Further dynamics will depend on employment data and a possible escalation of the geopolitical situation. A break above $4470 will open the way to testing higher levels.
Resistance levels: 4470, 4488, 4519
Support levels: 4440, 4430, 4400
If the metal does not pull back from 4470 and continues to storm the resistance, then attempts to continue growth from 4470 can be considered. Otherwise, the market may test 4440-4430 before rising (long squeeze). Within the current cycle, gold has a chance to test its ATH.
Best regards, R. Linda! Long 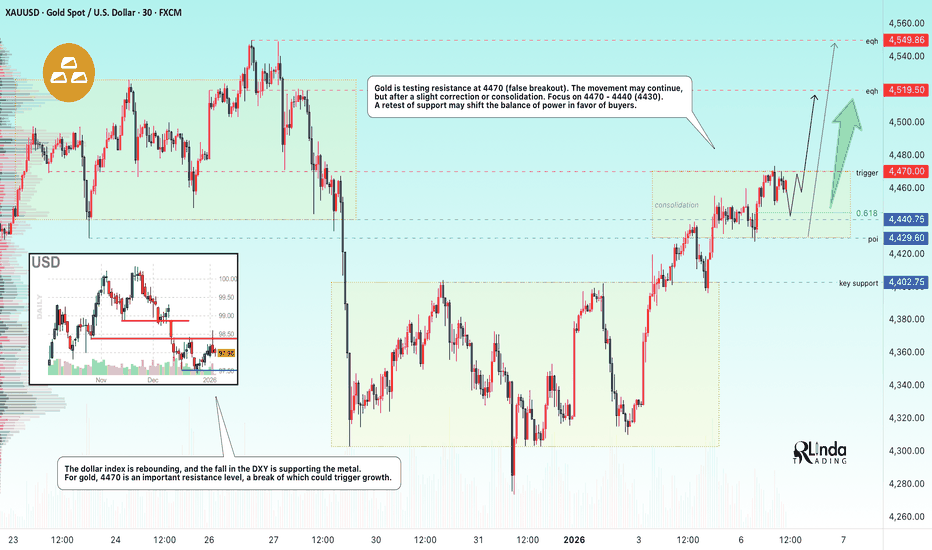
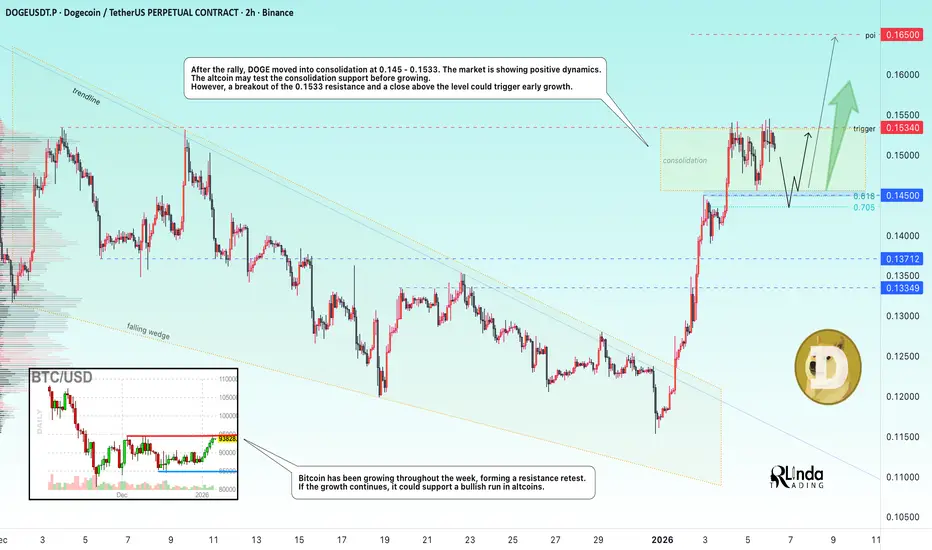
DOGEUSDT - Consolidation after growth is a positive signBINANCE:DOGEUSDT is testing resistance, but the coin is not going to reverse yet. Focus on the current consolidation at 0.145 - 0.1534. A long squeeze or a breakout of resistance could trigger growth.
Bitcoin has been growing throughout the week, forming a retest of resistance. If the growth continues, it could support a bullish run in altcoins.
After the rally, DOGE moved into consolidation at 0.145 - 0.1533. The market is showing positive dynamics. The altcoin may test the consolidation support before growing. However, a breakout of the 0.1533 resistance and a close above the level could trigger an early rise.
Resistance levels: 0.1534, 0.1648
Support levels: 0.145, 0.139
Regarding the current consolidation in the trading range format, I highlight two levels: 0.1534 and 0.145. If the overall positive background persists, a false breakdown of support at 0.145 or a breakout of resistance at 0.1534 with the price closing above the level could trigger further growth towards the local zone of interest at 0.165.
Best regards, R. Linda!  Long
Long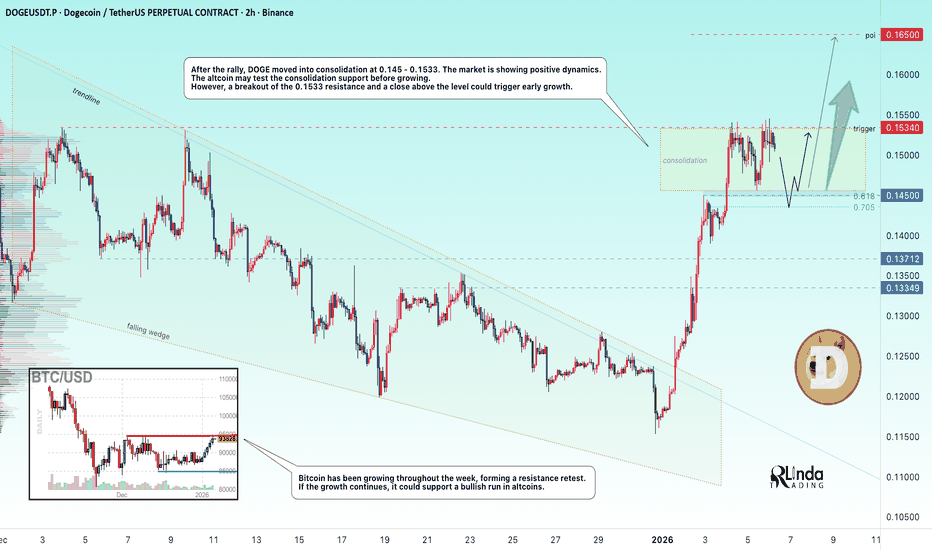
 Long
Long
SNDK - Bullish Scenario Since 04 Sept, Momentum Still Intact!SNDK - CURRENT PRICE : 228.47
🔥 Bullish Scenario Supported by Trend Structure & Fibonacci Reactions
SNDK began showing early signs of a bullish scenario when price respected a rising support line , indicating steady accumulation and higher lows forming. The major bullish confirmation occurred on 04 September , when price broke above the 55.55 level (look at red arrow), triggering strong momentum and leading to a rapid vertical rally. As with many fast-moving stocks, a healthy retracement followed, and SNDK pulled back precisely toward the Fibonacci 38.2% golden ratio, where the stock found support and began forming a new base. This behavior suggests the prior uptrend remains intact, and the uptrend may resume as long as the stock continues to hold above this retracement zone.
Some Elliott Wave practitioners may also interpret the current structure as a developing Wave 5, suggesting the potential for another upside leg if the trend continues to follow impulsive wave behavior.
Take note that I'm using logarithmic scale chart because the share price has already risen more than 300% since the 04 September breakout, making it more suitable for analyzing large percentage moves and trend structure.
ENTRY PRICE : 228.47
FIRST TARGET : 270.00
SECOND TARGET : 324.00 (Projected based on Fibonacci extension)
SUPPORT : 183.00 (The low of 21 Nov HAMMER candle)
 Long
Long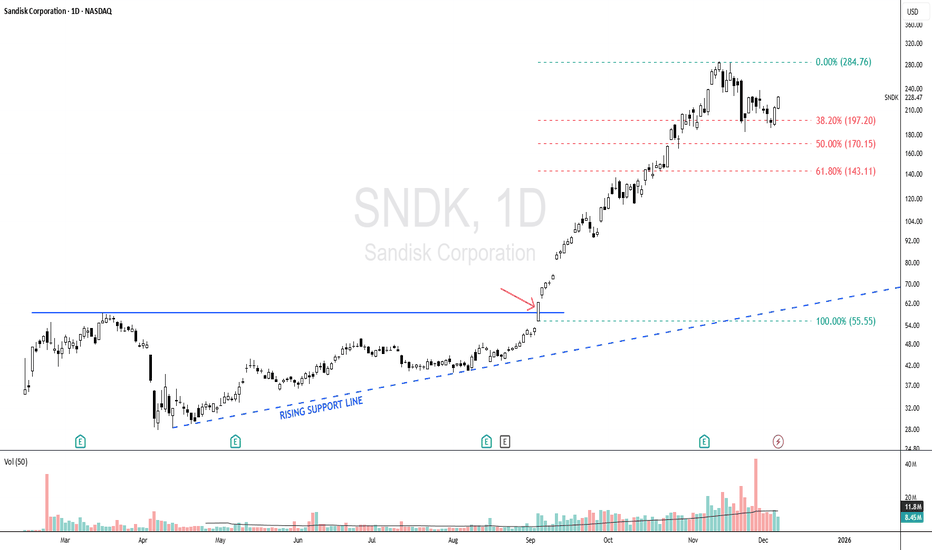
XAUUSD H1 –Liquidity Reaction After Geopolitical SpikeXAUUSD H1 – Liquidity Reaction After Geopolitical Spike
Gold surged strongly at the start of the week as escalating geopolitical tensions boosted safe-haven demand, while expectations of further Fed rate cuts continued to support the broader bullish narrative. From a technical perspective, price is now reacting around key liquidity and Fibonacci zones rather than trending impulsively.
TECHNICAL OVERVIEW
On H1, gold experienced a sharp sell-off followed by a recovery, forming a V-shaped reaction that suggests aggressive liquidity clearing.
Price is currently trading below prior breakdown zones, indicating that supply remains active at higher levels.
The market structure favours sell-on-rallies in the short term, while deeper pullbacks may attract fresh buyers.
KEY LEVELS & MARKET BEHAVIOUR
Upper sell zones (supply & Fibonacci confluence):
4497 – 4500 (FVG sell zone, premium area)
4431 – 4435 (Fibonacci + former support turned resistance)
These zones represent areas where sellers previously stepped in aggressively, making them important reaction levels if price rebounds.
Lower buy-side liquidity:
4345 – 4350 (Value Low / buy-side liquidity zone)
This area aligns with trendline support and prior accumulation, making it a key level to monitor for a bullish reaction if price rotates lower.
EXPECTED PRICE FLOW
Short term: price may continue to consolidate and rotate between resistance and liquidity below, with choppy price action likely.
A rejection from the upper resistance zones could lead to another leg lower toward buy-side liquidity.
If buy-side liquidity is absorbed and defended, the market may attempt another recovery move.
FUNDAMENTAL CONTEXT
Gold’s strength is underpinned by two major factors:
Rising geopolitical risk, which increases demand for safe-haven assets.
Dovish expectations from the Federal Reserve, as markets continue to price in additional rate cuts, reducing the opportunity cost of holding non-yielding assets like gold.
These fundamentals support gold on higher timeframes, even as short-term technical corrections play out.
BIG PICTURE VIEW
Medium-term bias remains constructive due to macro and geopolitical support.
Short-term price action is driven by liquidity and reaction zones rather than trend continuation.
Patience is key—allow price to interact with major levels before committing to the next directional move.
Let the market show its hand at liquidity. Long 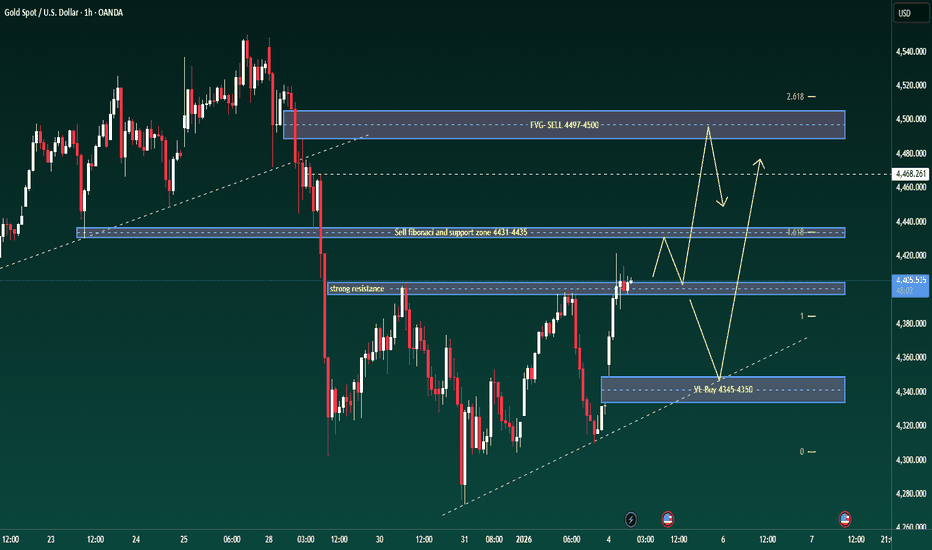
Long 
 Long
Long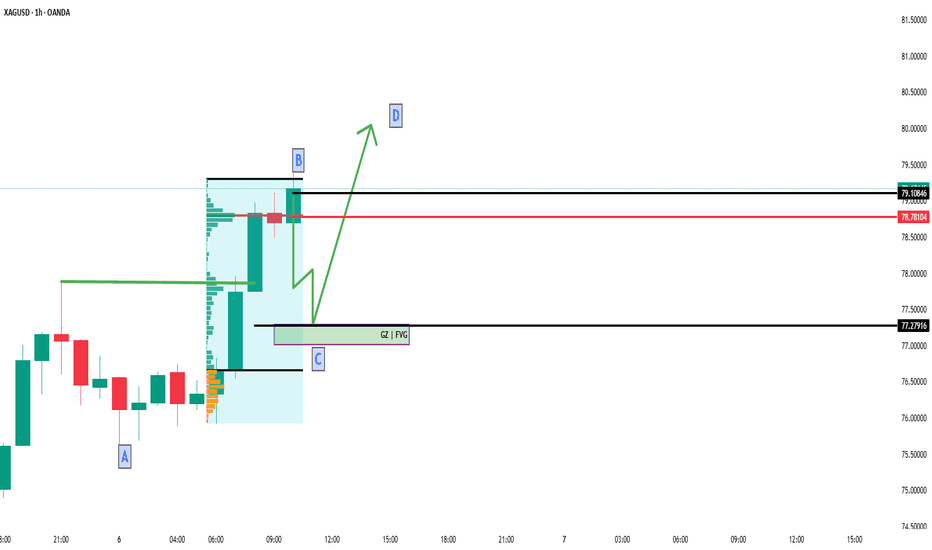
GOLD - The battle for 4400. Will the growth continue?FX:XAUUSD starts the week of 2026 with a rise of more than 1.5%, staying above $4,400 amid escalating geopolitical tensions in Latin America
Geopolitical crisis: US-Venezuela, Donald Trump threatened new military intervention if the interim government does not comply with Washington's demands.
Expanding risks: Trump hinted at Colombia and Mexico. The situation between Russia and Ukraine remains tense. Against this backdrop, investors are actively shifting funds into defensive instruments, including gold and the US dollar
Important US labor market data is expected this week, which could add to volatility. Venezuela has set up a commission to free Maduro, indicating a further escalation of the conflict.
Gold remains a priority for investors amid unprecedented geopolitical uncertainty. Short-term corrections are possible, but the overall uptrend is likely to continue, especially if the conflict in Latin America escalates
Resistance levels: 4440, 4470, 4519
Support levels: 4400, 4373
If the bulls keep gold above 4410-4400, then in the short and medium term, gold will be able to continue to grow despite the fact that the daily ATR has already been exhausted. Local and global trends are bullish...
Best regards, R. Linda! Long 

 Long
Long