Fractal
XAU/USD 16 June 2026 Intraday AnalysisH4 Analysis:
-> Swing: Bullish.
-> Internal: Bearish.
Price has now printed a bullish CHoCH as per analysis dated 11 June 2026.
Price is now trading within an established internal range.
Intraday expectation:
Price to continue bullish, react at either discount of internal 50% EQ, or H4 demand zone before targeting weak internal low, priced at 4,023.870.
Note:
Gold remains volatile as tensions between the US, Israel, and Iran keep safe‑haven demand elevated.
Markets are reacting qu
XAU/USD 15 June 2026 Intraday AnalysisH4 Analysis:
-> Swing: Bullish.
-> Internal: Bearish.
Price has now printed a bullish CHoCH as per analysis dated 11 June 2026.
Price is now trading within an established internal range.
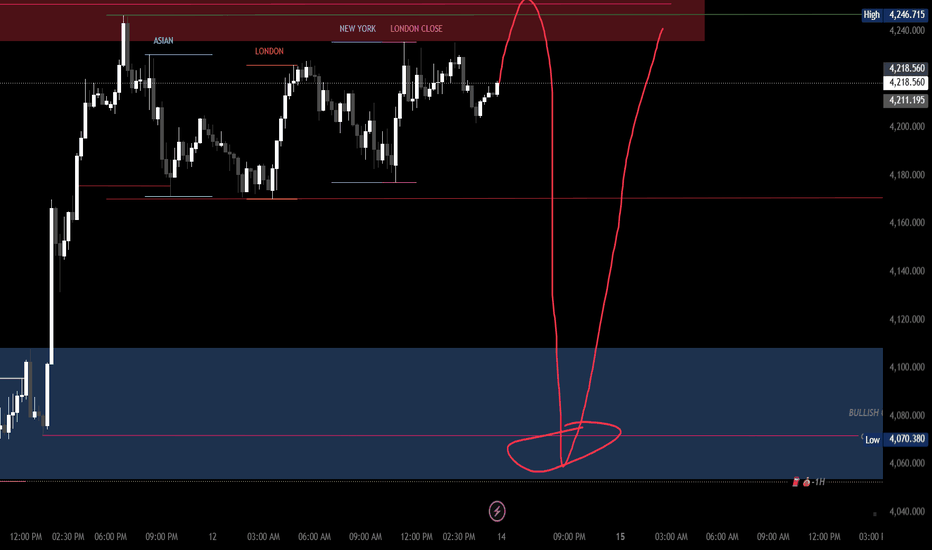
Intraday expectation:
Price to continue bullish, react at either discount of internal 50% EQ, or H4 demand zone before targeting weak internal low, priced at 4,023.870.
Note:
Gold remains volatile as tensions between the US, Israel, and Iran keep safe‑haven demand elevated.
Markets are reacting qu
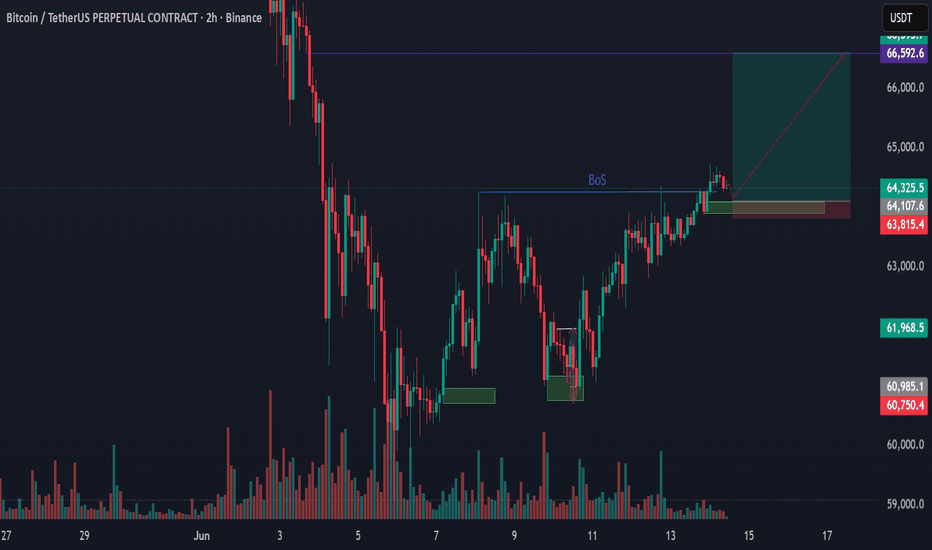
BTC Long Setup: Riding the Break of Structure (BoS)BINANCE:BTCUSDT.P has officially achieved a Break of Structure (BoS) to the upside, signaling a strong shift in local momentum. Price is currently consolidating just above the breakout point, and we are hunting for a long position on a minor pullback to validate the newly formed support block.
Entry Zone: ~$64,120 (Retest of the green demand zone right around the BoS level)
Stop Loss (SL): $63,700 (Placed below the local structural invalidation level)
Target (TP): ~$66,592 (Aiming for the ma
XAUUSD W Setup: SSL Sweep, 4H Pullback & Bullish ContinuationOANDA:XAUUSD has swept the monthly swing low liquidity and closed bullish, showing that price has collected SSL liquidity. On the weekly timeframe, price also swept SSL and gave a body close above it, which supports a bullish bias for this week.
The main weekly destination is the Weekly Volume Imbalance, which is located near the supply area. On the daily timeframe, price has created bullish displacement after grabbing swing low liquidity, and the next-day target can be the Daily Volume Imbal
XAU/USD 12 June 2026 Intraday AnalysisH4 Analysis:
-> Swing: Bullish.
-> Internal: Bearish.
Bias and analysis to remain the same as yesterday's analysis dated 11 June 2026.
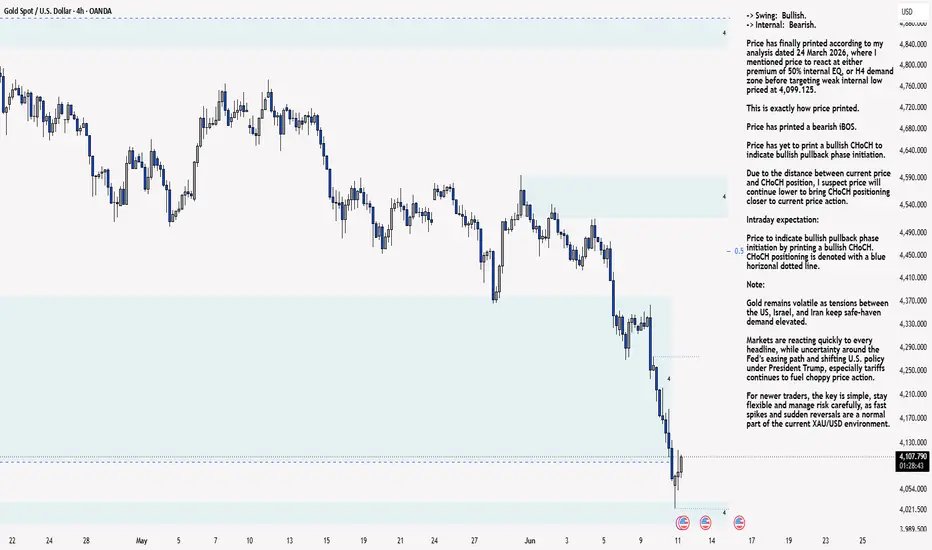
Price has finally printed according to my analysis dated 24 March 2026, where I mentioned price to react at either premium of 50% internal EQ, or H4 demand zone before targeting weak internal low priced at 4,099.125.
This is exactly how price printed.
Price has printed a bearish iBOS.
Price has yet to print a bullish CHoCH to indicate bullish pullback
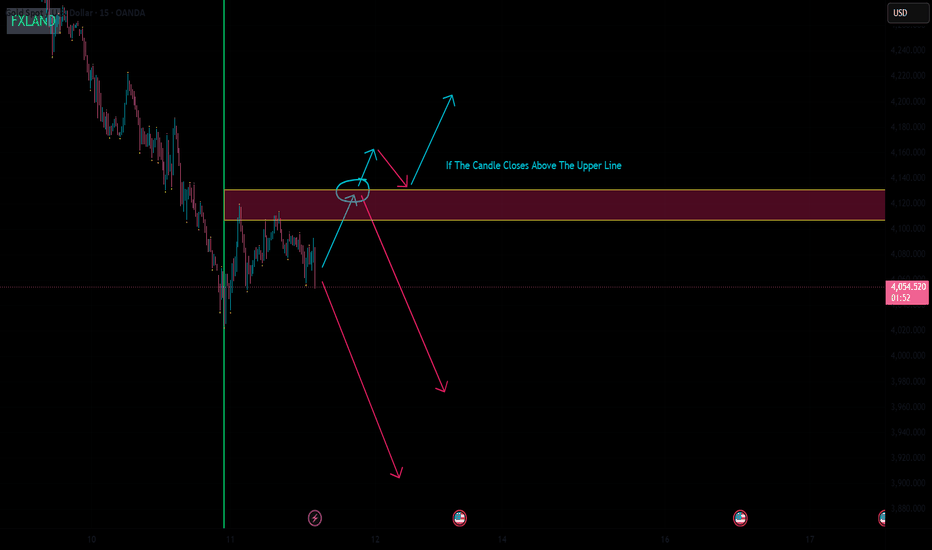
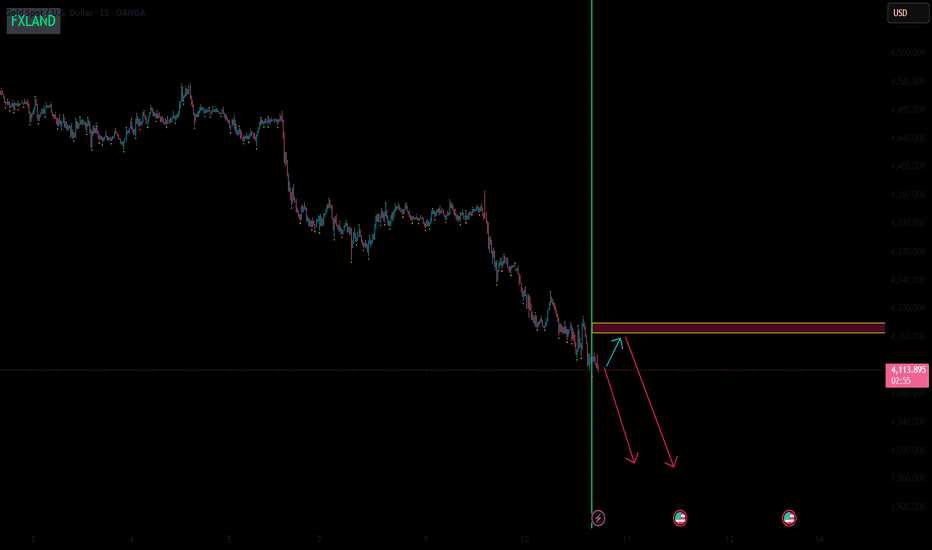
SmartFxland New Analysis on XAUUSD M15Hey Traders! On the M15 timeframe, price has already reacted twice from the highlighted resistance zone, making the box area an important short-term decision point.
Two possible scenarios are currently being monitored:
1. if price manages to break and close above the upper boundary of the box, a short-term bullish continuation may develop after a possible pullback and successful hold above the zone
2. if the highlighted resistance area fails to break to the upside once again, the broader beari
XAU/USD 11 June 2026 Intraday AnalysisH4 Analysis:
-> Swing: Bullish.
-> Internal: Bearish.
Price has finally printed according to my analysis dated 24 March 2026, where I mentioned price to react at either premium of 50% internal EQ, or H4 demand zone before targeting weak internal low priced at 4,099.125.
This is exactly how price printed.
Price has printed a bearish iBOS.
Price has yet to print a bullish CHoCH to indicate bullish pullback phase initiation.
Due to the distance between current price and CHoCH position, I
SmartFxland New Analysis on XAUUSD M15Hey Traders! Price is currently reacting below the highlighted resistance zone after an extended bearish movement.
Based on the current structure, bearish continuation from the current area remains a possible scenario if price continues to reject below the box.
However, even if price temporarily moves higher into the highlighted zone, the box area may still act as resistance and another bearish reaction could develop from that region.
The projection is based on price structure, resistance beh
XAU/USD 10 June 2026 Intraday AnalysisH4 Analysis:
-> Swing: Bullish.
-> Internal: Bearish.
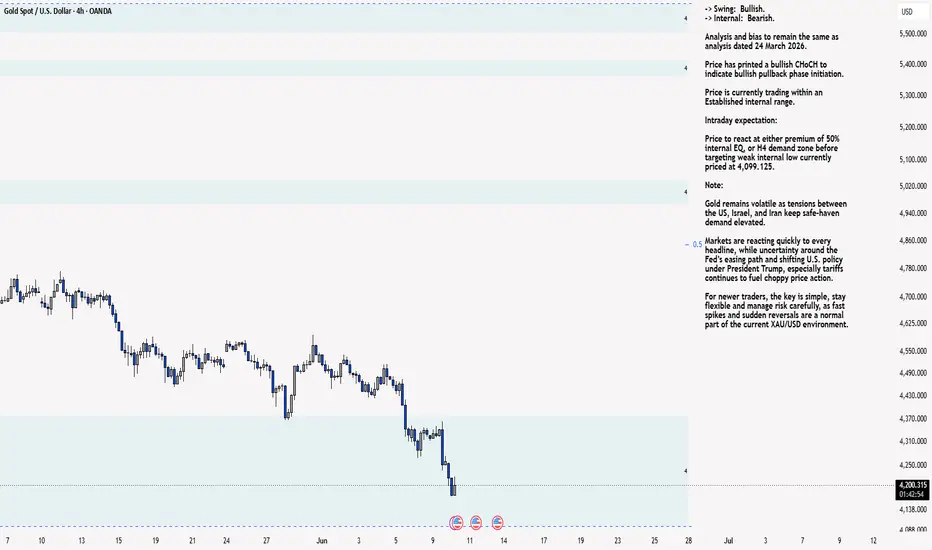
Analysis and bias to remain the same as analysis dated 24 March 2026.
Price has printed a bullish CHoCH to indicate bullish pullback phase initiation.
Price is currently trading within an Established internal range.
Intraday expectation:
Price to react at either premium of 50% internal EQ, or H4 demand zone before targeting weak internal low currently priced at 4,099.125.
Note:
Gold remains volatile as tensions between the US,
XAU/USD 09 June 2026 Intraday AnalysisH4 Analysis:
-> Swing: Bullish.
-> Internal: Bearish.
Analysis and bias to remain the same as analysis dated 24 March 2026.
Price has printed a bullish CHoCH to indicate bullish pullback phase initiation.
Price is currently trading within an Established internal range.
Intraday expectation:
Price to react at either premium of 50% internal EQ, or H4 demand zone before targeting weak internal low currently priced at 4,099.125.
Note:
Gold remains volatile as tensions between the US,
GBPUSD Liquidity Grab Complete | Massive Bullish Move Next?Price has tapped into a key bullish order block around 1.3330 and is showing signs of accumulation after sweeping weak lows. Market structure remains favorable for a continuation higher if buyers defend this zone.
🔹 Bullish Order Block: 1.3330 – 1.3340
🔹 Liquidity sweep below weak lows completed
🔹 Targeting internal liquidity and strong highs near 1.3500
🔹 Extended target at BSL around 1.3637
As long as the order block holds, I expect a retracement followed by an impulsive move toward buy-side
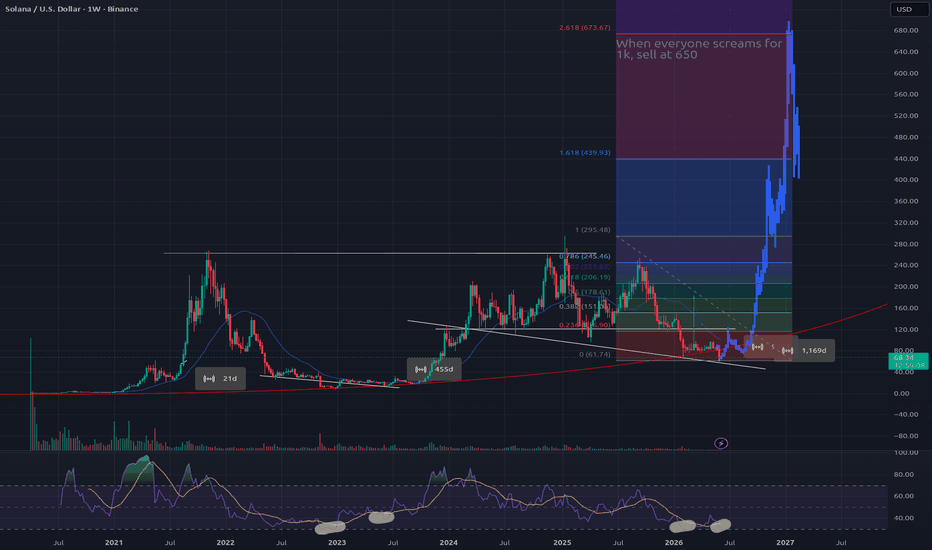
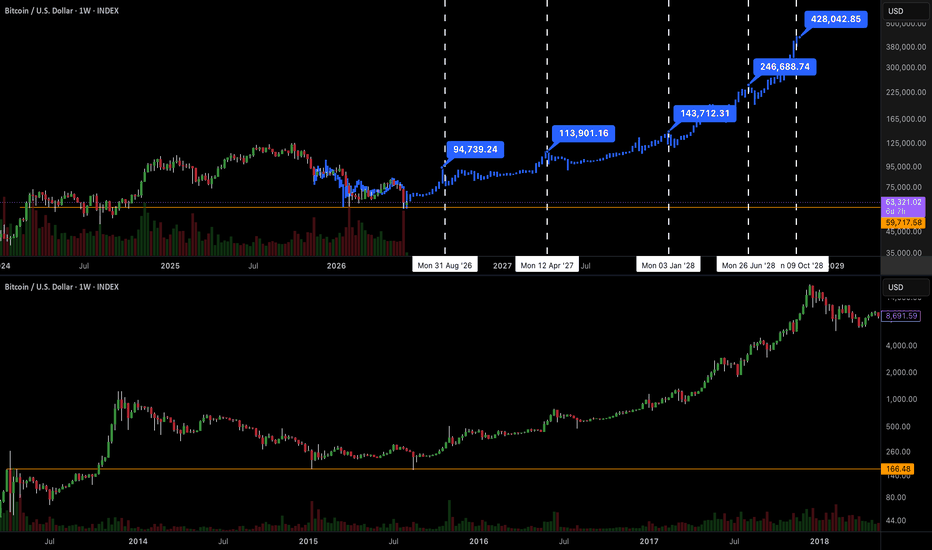
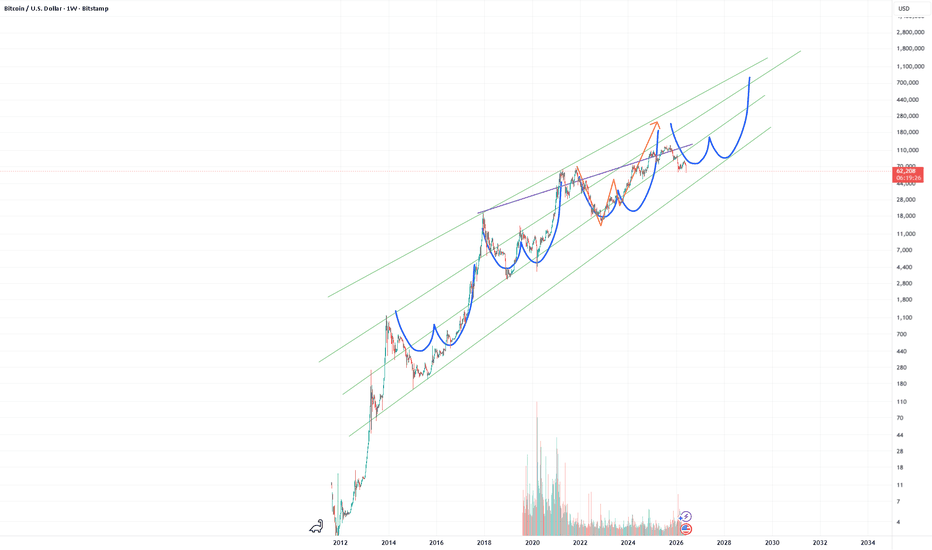
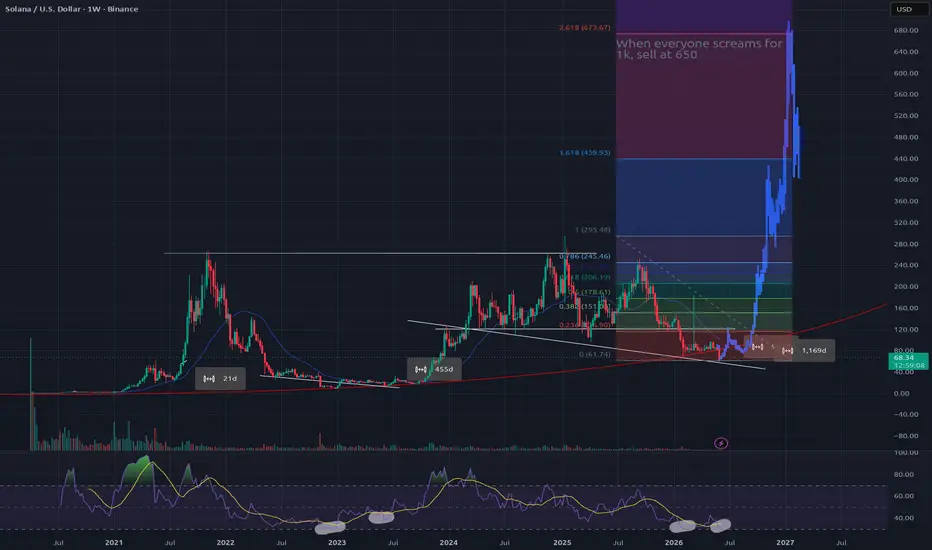
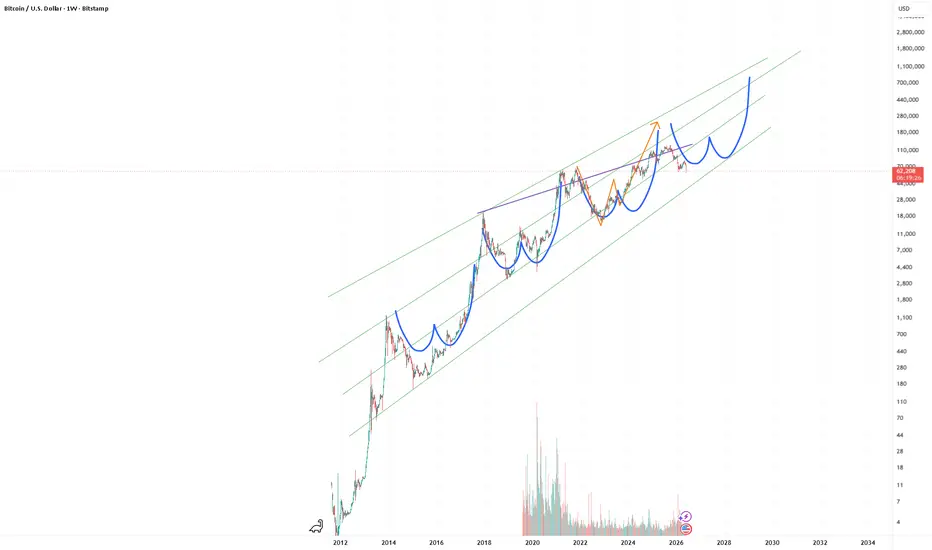
BTC Fractal (2015 Bottom - 2018 Top)Don't take this too seriously. Let's have some fun while our favorite orange coin slides..
This feels like an unlikely bottom, but we're sitting around '21 double top price levels. We've also consolidated here for the majority of '24 before the push to 100K. Sentiment is about as negative as it can get. Bears are getting greedy for lower prices and even bulls want lower prices to buy.
Let's call this the double bottom and use the 2015 - 2018 fractal as our map. How about a run to 400K by 2028?
XAU/USD 08 June 2026 Intraday AnalysisH4 Analysis:
-> Swing: Bullish.
-> Internal: Bearish.
Analysis and bias to remain the same as analysis dated 24 March 2026.
Price has printed a bullish CHoCH to indicate bullish pullback phase initiation.
Price is currently trading within an Established internal range.
Intraday expectation:
Price to react at either premium of 50% internal EQ, or H4 demand zone before targeting weak internal low currently priced at 4,099.125.
Note:
Gold remains volatile as tensions between the US,
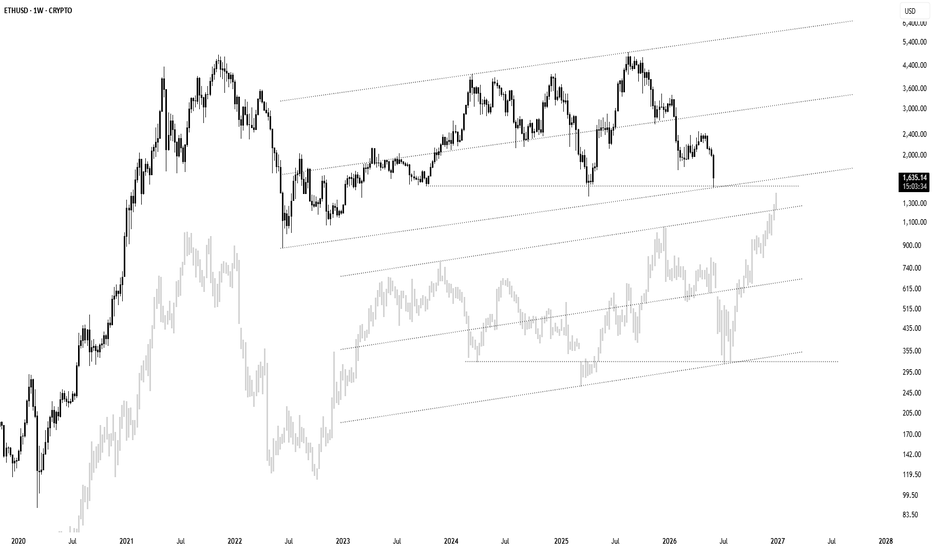
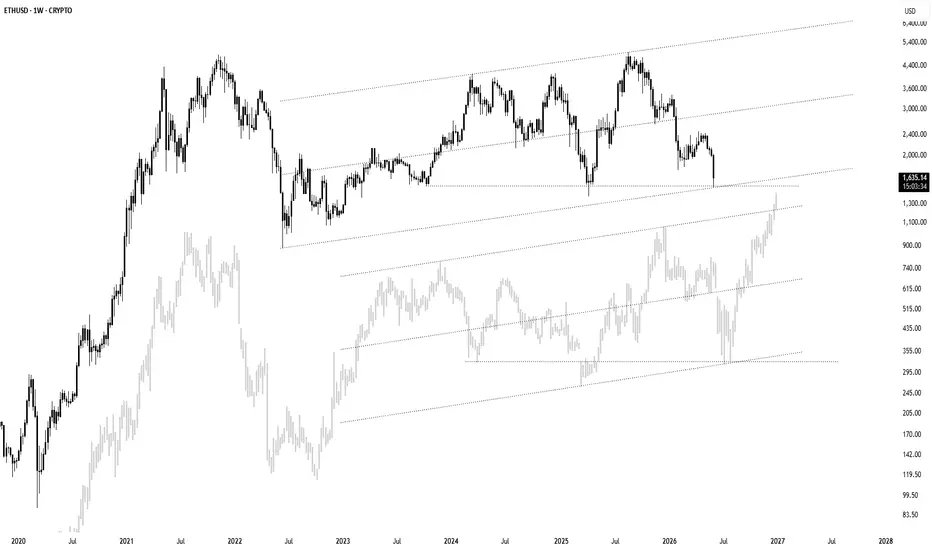
ETH IS DEAD...I think we are in a golden investment opportunity, as we can see in the chart. Ethereum has a lot of fractals, and according to this fractal, it is now at the bottom of the price for holding, and from now on, a move towards the historical ceiling can be considered. Many are looking for Ethereum to fall to $1,200 to $1,000, but I don't think this will happen. The price of $10,350 is the target for this move, and up to that price, I am not personally a seller, and the buying range is $1,620 to $1,
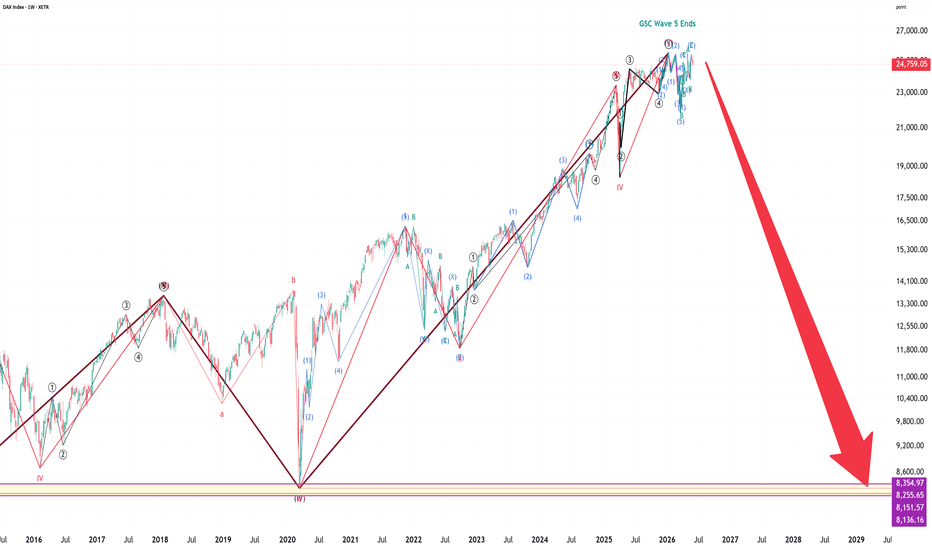
DAX Elliott Waves Analysis: End of Grand Super Cycle Bull MarketIn this video, I analyzed the Germany DAX index on a Grand Super Cycle (GSR) level starting from 1970s. Alarmingly, this analysis tells me that DAX GSR bull market has ended in Jan 2026. What follows will then be a fall to March 2020 low region where I brought up the importance of that price region as a support.
DAX has recently completed it's first sub-wave 1 and sub-wave 2 down and is currently on sub-wave 3 down. I expect a wave 3 type of crash for DAX, similar to Nikkei, S&P500, and Nasdaq.
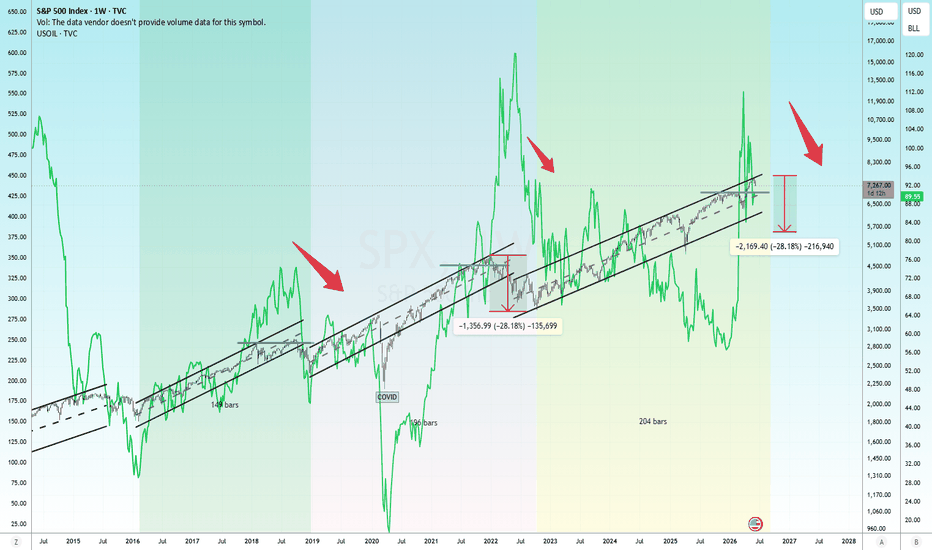
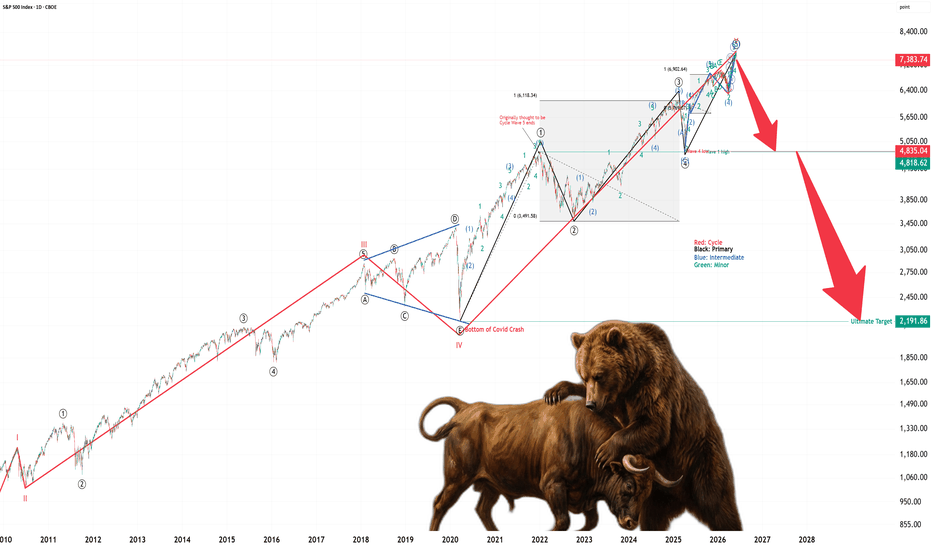
SPX Elliott Wave Cycle Level Study: The Beginning of Bear MarketIn this video, I talk about the big picture for S&P500 using SPX. The entire wave that starts from March 2009 and ended on June 2026. I discussed the huge wave structure, the Fibonacci extension levels, and the breakdown of the sub-waves for the final cycle wave 5.
Essentially, the warning here is that we can see SPX going down another 2500 points to 4835 as the initial target, and potentially going down even more to 2020 March low of 2192.
Be careful out here.
Good luck!