Tesla Holds Above Support — Can Buyers Regain Momentum?Market Structure
Tesla remains in a recovery phase after rebounding sharply from its earnings-driven selloff. The broader trend is still rebuilding rather than fully bullish, with price currently consolidating above a higher low. As long as buyers continue defending the recent support zone, the recovery structure remains intact, although a decisive breakout above nearby resistance is still required to confirm stronger upside momentum.
Market Sentiment - Moderately Bullish
Short-term moment
Investing
NVIDIA — Correction or the Next Buying Opportunity?Market Structure
NVIDIA remains within a broader bullish market structure despite the recent sharp pullback following earnings volatility. The latest decline has brought price back toward a key demand zone without breaking the sequence of higher lows on the higher timeframe. For now, this appears to be a corrective move rather than a confirmed trend reversal.
Market Sentiment - Moderately Bullish
Short-term momentum weakened after the post-earnings selloff, but buyers have already begun re
S&P 500 Daily Chart Analysis For Week of August 28, 2026Technical Analysis and Outlook:
In the previous week's trading session, the cash index steadily rose after retesting the crucial Mean Support level at 7,643.
In the upcoming session, the S&P 500 pattern indicates a potential In-Force Rebound, which is entirely plausible. Initially, targeting the Mean Resistance level at 7,767 and extending to retest the completed Outer Index Rally at 7,815, maneuvering through the Key Resistance level at 7,800.
However, there is a possibility that the index m
EUR/USD Daily Chart Analysis For Week of August 28, 2026Technical Analysis and Outlook:
In last week's trading session, Eurodollar continued its In-Force Retracement from the completed Inner Currency Rally at 1.171 and reached our vital support level at Mean Support at 1.158.
The continuation of the downward price movement points to extended support at Mean Support 1.157, with the possibility of dropping further to Mean Support 1.152.
On the upside playout, there is a probability of an In-Force Rebound within this upcoming week's trading session t
Bitcoin(BTC/USD) Daily Chart Analysis For Week of Aug 28, 2026Technical Analysis and Outlook:
Bitcoin has shown a powerful surge to complete the Inner Coin Rally at $81,300 and, on this price action, has retreated sharply to the Mean Support at $77,000, where it currently is toying with this strong support.
Current price action indicates an intermediate rebound retest towards the completed Inner Coin Rally at $81,300 via the Mean Resistance at $80,300, with potential extensions to the next resistance level marked as Key Resistance at $82,200 and the nex
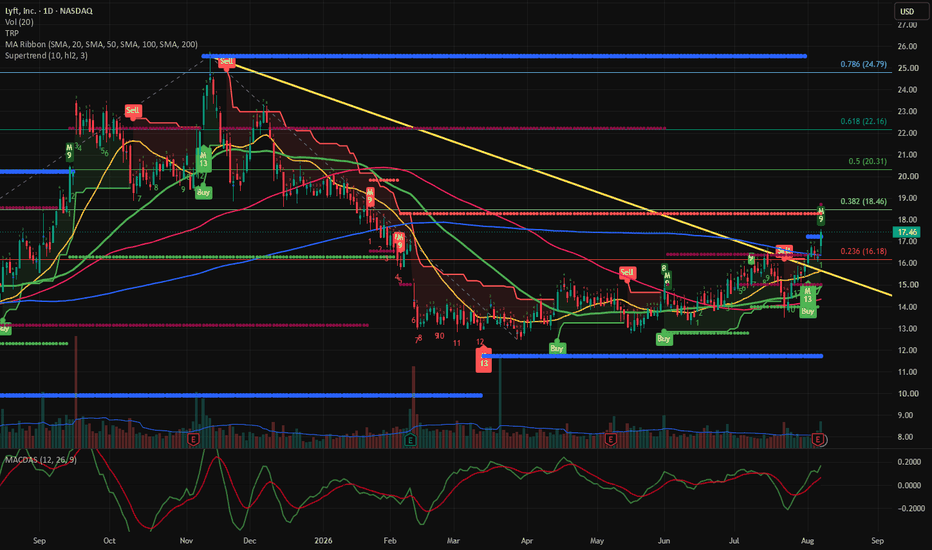
LYFT–Breakout → Retest → Breakout ofPrevious High, what is next?Hello Everyone, Followers,
Happy Sunday to all. This week in my filter i found only one stock that could be interesting coming weeks , let's drill down.
Lyft (LYFT) is showing one of my favorite technical sequences:
Breakout → Retest → Continuation.
After spending months below its long-term descending trendline, LYFT finally broke through that structure. Instead of immediately running higher, price came back, retested the breakout area, found buyers and pushed higher again.
Now LYFT has als
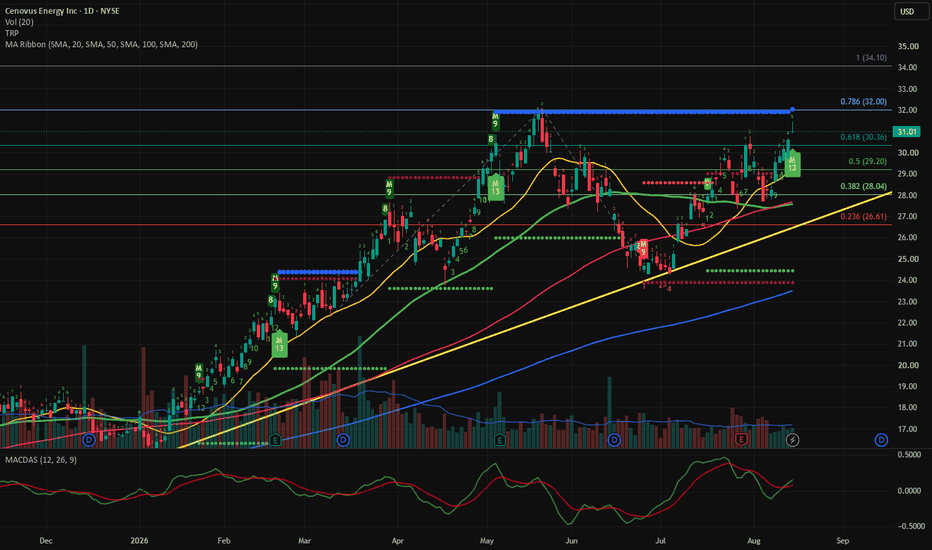
CVE – Previous High Under Attack | New ATH Next?Hello Everyone, Followers,
This week i found 2 stocks in my filter and first one is CVE.
Cenovus Energy (CVE) continues to show a strong bullish structure and is once again approaching its previous major high.
After the July pullback, buyers stepped back in around the rising trend structure and CVE has recovered strongly. Price has now reclaimed the $30.36 Fib 0.618 level and is trading around $31.00.
Now the big question:
Can CVE finally break $32 and move into new-high territory? 👀
📊 T
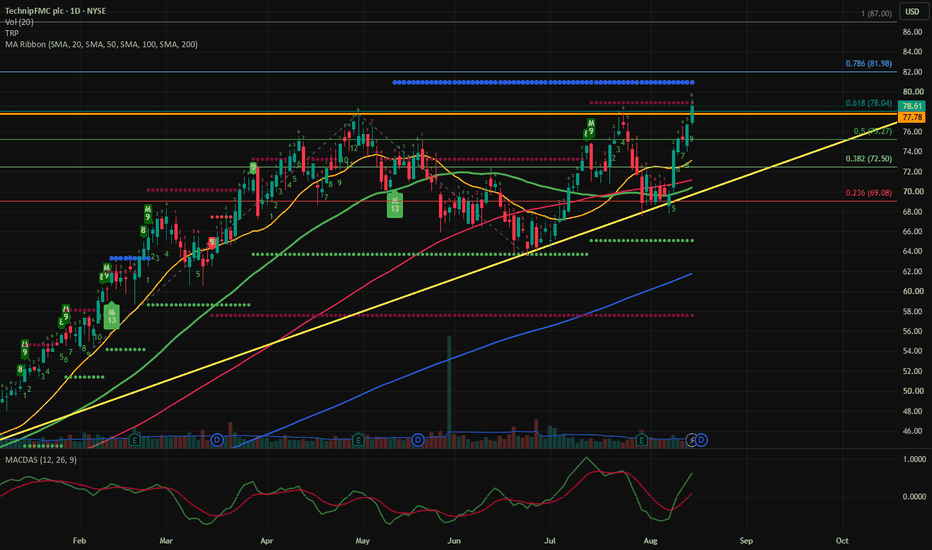
FTI – Previous High Breaking | New ATH on the Way?Hello Everyone, Followers,
FTI is the second and last one from my side for this week.
TechnipFMC (FTI) is making another serious attempt to expand its long-term bullish trend.
After a sharp pullback toward the $68–69 area, buyers stepped in aggressively and price recovered almost the entire decline.
FTI is now trading around $78.61, pushing through the previous resistance zone around $77.78–78.04.
📊 Technical Overview
The chart currently shows:
• Strong long-term bullish trend
• Rising tre
NAZARA TECHNOLOGIES: Cup & Handle Breakout — Can ₹419 Be Next? Nazara Technologies is showing a textbook-looking Cup & Handle formation on the weekly chart.
The stock has spent several years forming a broad Cup, followed by a relatively smaller Handle consolidation.
The important resistance zone around ₹359–₹360 has now been breached, with the current weekly candle trading around ₹380.
🔥 Why this setup is interesting
🔹 Clear long-term Cup & Handle structure
🔹 Price has broken above the ₹359–₹360 resistance zone
🔹 Breakout is accompanied by increase
COFORGE: 7-Year Trend + ATH Breakout SetupCoforge is approaching a potentially significant breakout on the weekly timeframe.
After a strong recovery from the 2026 correction, price has once again reached the ₹1,980–₹2,000 zone, which has acted as a major resistance area in the past.
The current structure is interesting because:
🔹 The broader weekly trend remains bullish
🔹 Price has formed a strong sequence of higher highs and higher lows after the 2026 bottom
🔹 Weekly RSI is around 73, indicating strong momentum
🔹 Price is now testi
An earnings date is not a reason to exit a trendThree scheduled reports on this chart. The stock fell the next day on all three.
It's still well above where it was before the first one.
That's the whole lesson and most people get it backwards. The reaction day and the trend are two separate questions, and a scheduled event answers the first one only.
Run it through the three gates.
Gate 1, trend. Is the higher timeframe still pointing the way it was? A report doesn't change a trend, it tests one. If the structure is intact the day after
S&P 500 Daily Chart Analysis For Week of August 21, 2026Technical Analysis and Outlook:
In last week's trading session, the S&P 500 has experienced a consistent, gradual decline following the completion of the Outer Index Rally at 7,815 from the previous week.
In light of this price action, the Index print suggests an In-Force Rebound is likely, initially targeting the Mean Resistance level at 7,735 and, conceivably, extending to retest the completed Outer Index Rally 7,815 via Key Resistance 7,800.
However, there is a chance that it exhibits cont
EUR/USD Daily Chart Analysis For Week of August 21, 2026Technical Analysis and Outlook:
In last week's trading session, Eurodollar completed Inner Currency Rally 1.171 and is in Intermediate In-Force Retracement progress, heading to the first Mean Support 1.164 with designated additional targets marked as Mean Support 1.158 and 1.152.
In the upside scenario, there is a probability of a retest of the completed Inner Currency Rally 1.171 within this upcoming week's trading session after successfully attaining the first Mean Support 1.164 downside tar
Bitcoin(BTC/USD) Daily Chart Analysis For Week of August 21, 202Technical Analysis and Outlook:
Bitcoin has demonstrated a strong Inner Rebound movement, successfully retesting and surpassing the Mean Resistance at $65,400 and the Key Resistance at $66,700. It has also surged with vengeance past the Inner Coin Rally level of $69,500 with significant momentum.
Current price action indicates an intermediate pullback towards the designated Mean Support of $76,000, with potential extensions to Mean Support levels at $73,000 and $69,000.
On the upside, trading
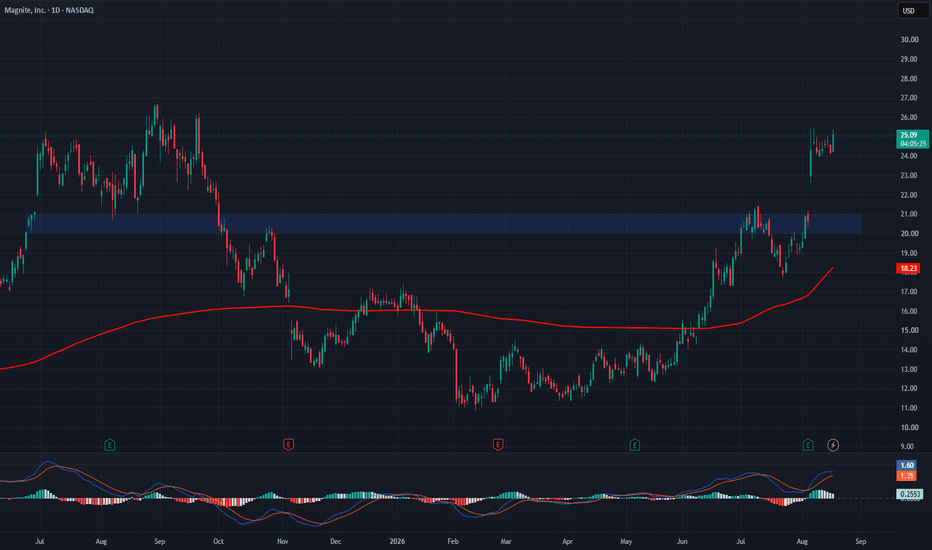
MGNI — Capitalizing on the Shift to Connected TV AdvertisingMagnite, Inc. NASDAQ:MGNI is a leading independent advertising technology platform, with significant exposure to connected TV (CTV), streaming, and programmatic advertising. The company helps publishers monetize digital advertising inventory while connecting them with advertisers across premium media environments.
Key Catalysts:
Strong CTV momentum:
CTV remains Magnite’s primary growth engine, with CTV contribution ex-TAC increasing 36% year-over-year and now accounting for more than half of
S&P 500 Daily Chart Analysis For Week of August 14, 2026Technical Analysis and Outlook:
The S&P 500 Index has shown a steady-to-lower decline during the early phase of the weekly trading session, followed by a remarkable increase that enabled the index to complete the significant Outer Index Rally at 7,815 in due course.
In light of this development, the S&P 500 Index pattern suggests an In-Force Retracement is likely, targeting the Mean Support level at 7,752 and, feasibly, extending to Mean Support at 7,706.
At the other end, there is a scenari
EUR/USD Daily Chart Analysis For Week of August 14, 2026Technical Analysis and Outlook:
In the ex-week’s Eurodollar trading session, one of the renowned currencies resumed its upward movement, where it successfully retested the Mean Resistance at 1.158.
The current momentum points are traveling upward on the Inner Rebound path, eyeing the next significant obstacle, marked as Mean Resistance 1.161, with the ultimate goal of reaching Inner Currency Rally 1.170.
However, there is a probability of a termination of the upward price movement; we may se
Bitcoin(BTC/USD) Daily Chart Analysis For Week of August 14, 202Technical Analysis and Outlook:
Bitcoin has revealed strong Intermediate Retracement power by retesting and peeling off substantially from Mean Resistance at $65,400 to Mean Support at $62,700, where it is currently resting.
Trading price action indicates a continuous downside bias extending to Mean Support at $61,500 and $60,100, with a potential retest of the completed Inner Coin Dip at $58,500 with attached Key Support marked at $58,600.
On the upside, with moderate probability, Bitcoin m
ES Holds Structure While CVD Weakens — Credit and Vol Stay CalmMarket Regime
Fragile Rotation / Constructive Underneath
Wednesday produced another mixed session in the major indexes, but the broader risk environment remained considerably healthier than ES and NQ price action suggested.
ES continued holding above its major lower-volume structure while NQ remained the weaker index. At the same time, volatility declined sharply, credit strengthened, regional banks improved and equal-weight equities outperformed.
ES — A Timeframe Split
ES currently present
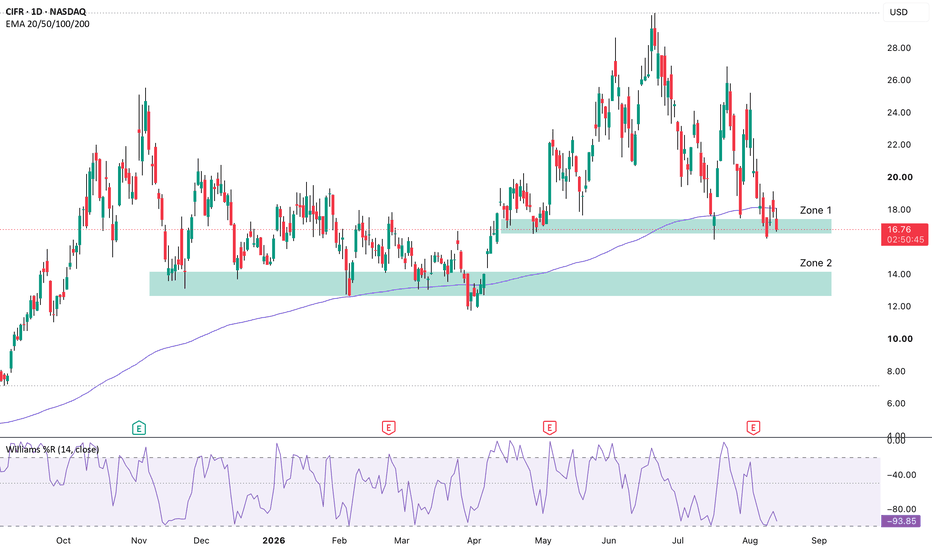
$CIFR: Buying the Transition Gap, Zone 1 and Zone 2Setup:
CIFR is sitting at $16.74 in Zone 1 with Williams %R at -94, deeply oversold after a drop from $25.22 on Aug 3 to the mid $16s in a week. NASDAQ:CRWV and NASDAQ:NBIS are ripping and the demand behind them isn't slowing down. CIFR is building for that exact same demand. The difference is theirs is switched on already and CIFR's starts in October.
Why the fundamentals support this:
✅ 168MW + 56MW ten year AI hosting agreements with Fluidstack
✅ ~$3B contracted revenue, up to $7B if e
Why "I Don't Time the Market" Is the Biggest Lie in InvestingOne of investing’s biggest myths has been bothering me for a while: the idea that looking at charts is a trader’s job, and a “real” investor only reads annual reports.
People say: “I don’t watch charts, I’m a long-term investor.”
👉 Here’s the truth: every time you hit the buy button, you’re making a timing decision. You’re not just buying a company. You’re buying a company and a moment, at the same time…
-------------------------------------
There’s a sentence I hear constantly in investing c
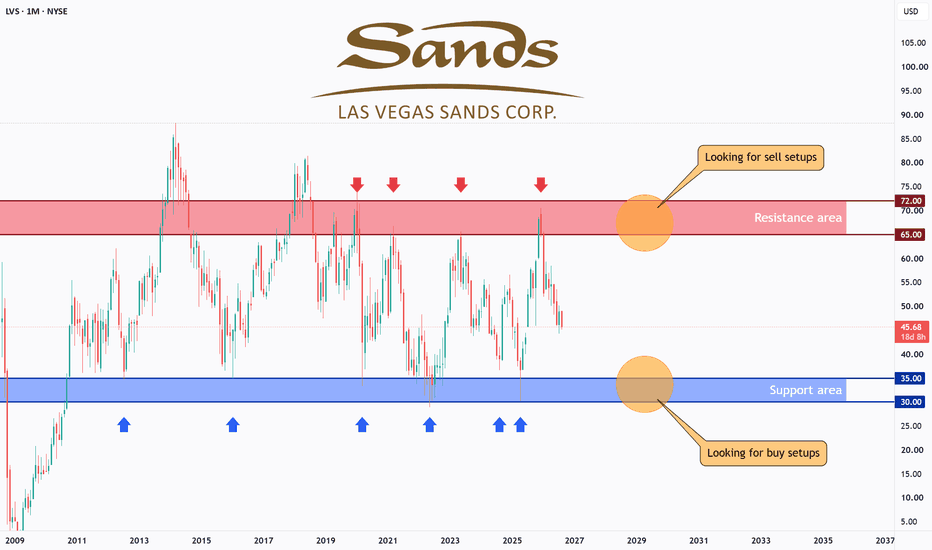
LVS - Buyers Waiting at Range Support!LVS (Las Vegas Sands Corp.) is a global casino and resort company operating integrated resorts and gaming properties across major markets in Asia and the United States.
From a longer-term investment perspective, the price has been trading within a well-defined range for an extended period, respecting both the major support and resistance areas.
Lately, price rejected the resistance area and traded lower, and is now moving toward the support area, bringing this key level back into focus.
⭕As
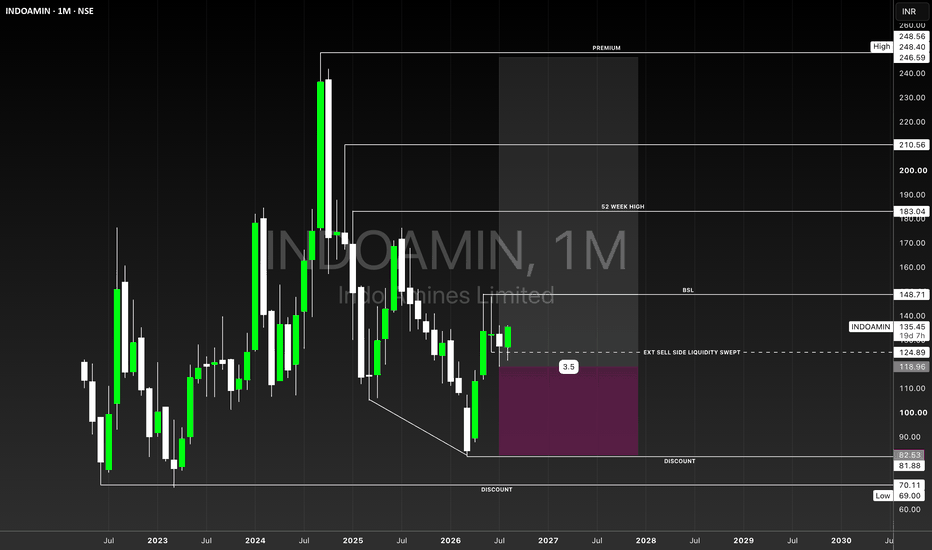
INDO AMINES LTD MONTHLY ANALYSIS# INDO AMINES LTD. — MONTHLY STRUCTURAL TRAJECTORY
### **Sell-Side Liquidity Sweep → Discount Recovery → Repricing Toward Buy-Side Liquidity**
**NSE:** INDOAMIN
**Timeframe:** 1M
**CMP on chart:** ₹133.00
**Bias:** 🟢 **Bullish, but confirmation-dependent**
**Setup:** Long-term positional / swing
Indo Amines operates in the **Chemicals / Specialty Chemicals** segment, manufacturing fatty amines, amine derivatives, fine chemicals and performance chemicals used across industries including pharma