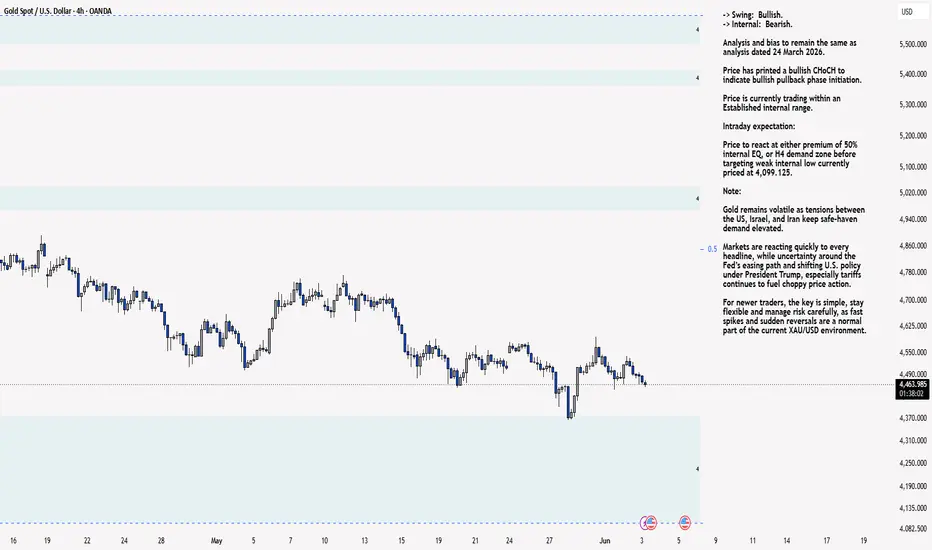
XAU/USD 04 June 2026 Intraday AnalysisH4 Analysis:
-> Swing: Bullish.
-> Internal: Bearish.
Analysis and bias to remain the same as analysis dated 24 March 2026.
Price has printed a bullish CHoCH to indicate bullish pullback phase initiation.
Price is currently trading within an Established internal range.
Intraday expectation:
Price to react at either premium of 50% internal EQ, or H4 demand zone before targeting weak internal low currently priced at 4,099.125.
Note:
Gold remains volatile as tensions between the US, Israel, and Iran keep safe‑haven demand elevated.
Markets are reacting quickly to every headline, while uncertainty around the Fed’s easing path and shifting U.S. policy under President Trump, especially tariffs continues to fuel choppy price action.
For newer traders, the key is simple, stay flexible and manage risk carefully, as fast spikes and sudden reversals are a normal part of the current XAU/USD environment.
H4 Chart:
M15 Analysis:
-> Swing: Bearish.
-> Internal: Bullish.
Analysis and bias to remain the same as analysis dated 01 June 2026.
Price has not printed according to my analysis dated 28 May 2026.
Price did not target weak internal low, instead printing a bullish iBOS. However, I am not entirely convinced of the bullish iBOS to the insignificant nature of the iBOS.
Nonetheless, I shall follow a systematic procedure and classify this as an iBOS.
Price has subsequently printed a bearish iBOS to indicate, but not confirm bearish pullback phase initiation.
Intraday expectation:
Price to trade down to either discount of 50% internal EQ, or M15 demand zone before targeting weak internal high, priced at 4,595.330.
Note:
Gold remains highly reactive on the M15 as geopolitical risk continues to drive quick, headline‑led moves.
The tension between the US, Israel, and Iran is keeping safe‑haven demand elevated, with markets still sensitive to any sign of escalation.
At the same time, shifting US tariff policy under President Trump is adding extra uncertainty, fuelling sharp intraday swings and increasing the likelihood of sudden sentiment flips. Liquidity pockets and whipsaws remain common, making disciplined risk management essential.
Gold’s geopolitical premium is still firmly in place, and until tensions ease, short‑term volatility is likely to stay front‑loaded.
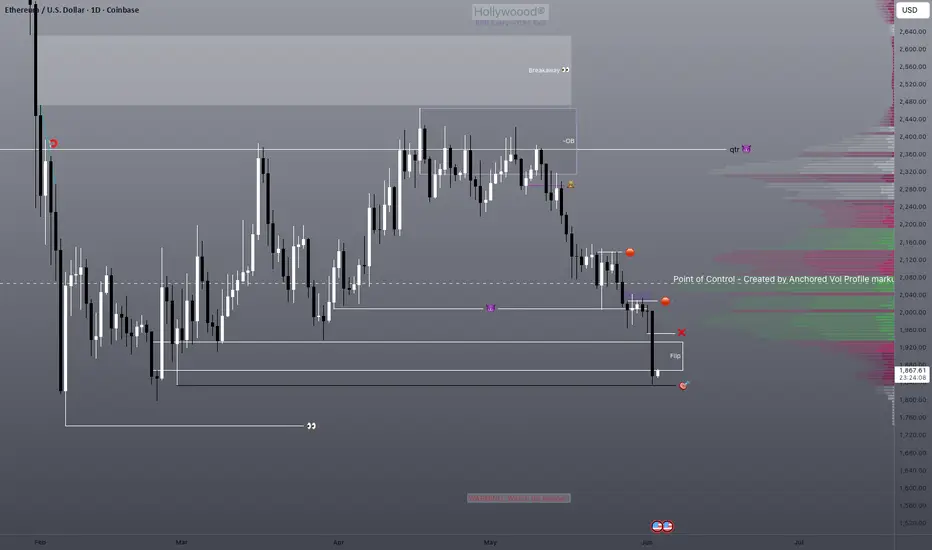
M15 Chart: BTC PullBack moveWe finally hit are long term goal. Which was to liquidate last quarters low. I had an OB target for the longest there at $65,000 and today it hit and price bounce of it. I believe we can pullback as high as $71,250. Bitcoin trend been over since last year it been a bearish market. The USA dollar and economy is looking great, even though our oil/gas prices still high they will fall soon and fast in my opinion as summer is starting. Investors, institutions, companies are pulling their money out of safe heavens meaning they are trusting the dollar right now and pushing other markets bullish like the Dow Jones, Nasdaq, S&P; This will cause special metals like gold, silver, Yen, and crypto prices to fall.  Long
Long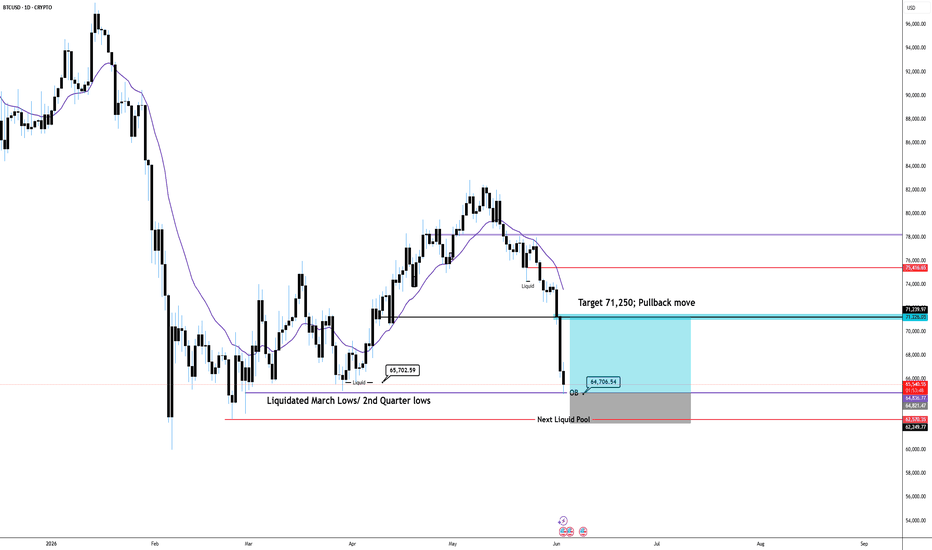
 Short
Short
 Short
Short
Canadian Natural: Potential UptrendCanadian Natural Resources broke out to record highs in February, and some traders may see further upside in the oil-and-gas producer.
The first pattern on today’s chart is the 2024 high of $56.50. CNQ bounced above that old peak in mid-April, followed by higher lows in early May and late May. That could mean new support has developed above old resistance. It could also be consistent with bullishness resuming in the intermediate term.
Second, the 50-day simple moving average (SMA) is above the 100-day SMA. Both are above the 200-day SMA. That configuration, with faster SMAs above the slower, may reflect a bullish long-term trend.
Third, stochastics are turning up from an oversold condition.
Next, CNQ climbed on Monday and Tuesday but remained below last week’s high and above last week’s low. That kind of bullish inside price action could suggest buyers are gaining control.
Finally, the 8-day exponential moving average (EMA) is nearing a potential cross above the 21-day EMA. That may reflect short-term bullishness.
TradeStation has, for decades, advanced the trading industry, providing access to stocks, options and futures. If you're born to trade, we could be for you. Learn more here about TradingView’s Broker of the Year!
Past performance, whether actual or indicated by historical tests of strategies, is no guarantee of future performance or success. There is a possibility that you may sustain a loss equal to or greater than your entire investment regardless of which asset class you trade (equities, options or futures); therefore, you should not invest or risk money that you cannot afford to lose. Online trading is not suitable for all investors. View the document titled Characteristics and Risks of Standardized Options at www.TradeStation.com . Before trading any asset class, customers must read the relevant risk disclosure statements on www.TradeStation.com . System access and trade placement and execution may be delayed or fail due to market volatility and volume, quote delays, system and software errors, Internet traffic, outages and other factors.
Securities and futures trading is offered to self-directed customers by TradeStation Securities, Inc., a broker-dealer registered with the Securities and Exchange Commission and a futures commission merchant licensed with the Commodity Futures Trading Commission). TradeStation Securities is a member of the Financial Industry Regulatory Authority, the National Futures Association, and a number of exchanges.
TradeStation Securities, Inc. and TradeStation Technologies, Inc. are each wholly owned subsidiaries of TradeStation Group, Inc., both operating, and providing products and services, under the TradeStation brand and trademark. When applying for, or purchasing, accounts, subscriptions, products and services, it is important that you know which company you will be dealing with. Visit www.TradeStation.com for further important information explaining what this means. XAU/USD 03 June 2026 Intraday AnalysisH4 Analysis:
-> Swing: Bullish.
-> Internal: Bearish.
Analysis and bias to remain the same as analysis dated 24 March 2026.
Price has printed a bullish CHoCH to indicate bullish pullback phase initiation.
Price is currently trading within an Established internal range.
Intraday expectation:
Price to react at either premium of 50% internal EQ, or H4 demand zone before targeting weak internal low currently priced at 4,099.125.
Note:
Gold remains volatile as tensions between the US, Israel, and Iran keep safe‑haven demand elevated.
Markets are reacting quickly to every headline, while uncertainty around the Fed’s easing path and shifting U.S. policy under President Trump, especially tariffs continues to fuel choppy price action.
For newer traders, the key is simple, stay flexible and manage risk carefully, as fast spikes and sudden reversals are a normal part of the current XAU/USD environment.
H4 Chart:
M15 Analysis:
-> Swing: Bearish.
-> Internal: Bullish.
Analysis and bias to remain the same as analysis dated 01 June 2026.
Price has not printed according to my analysis dated 28 May 2026.
Price did not target weak internal low, instead printing a bullish iBOS. However, I am not entirely convinced of the bullish iBOS to the insignificant nature of the iBOS.
Nonetheless, I shall follow a systematic procedure and classify this as an iBOS.
Price has subsequently printed a bearish iBOS to indicate, but not confirm bearish pullback phase initiation.
Intraday expectation:
Price to trade down to either discount of 50% internal EQ, or M15 demand zone before targeting weak internal high, priced at 4,595.330.
Note:
Gold remains highly reactive on the M15 as geopolitical risk continues to drive quick, headline‑led moves.
The tension between the US, Israel, and Iran is keeping safe‑haven demand elevated, with markets still sensitive to any sign of escalation.
At the same time, shifting US tariff policy under President Trump is adding extra uncertainty, fuelling sharp intraday swings and increasing the likelihood of sudden sentiment flips. Liquidity pockets and whipsaws remain common, making disciplined risk management essential.
Gold’s geopolitical premium is still firmly in place, and until tensions ease, short‑term volatility is likely to stay front‑loaded.
M15 Chart: Crude-oil, brewing another big up move?Since the time Iran - US war broke out in February, oil price remain at a broader range of 84 - 117, Crude has shown it's tendency to bounce back from the base it has created around $86, four instances in the past 3-months is testimony to that.
Its seems almost certain that whenever the price nears around 86, market is struck by some big news that takes the price high, again.
Given the current global ambiguity around the war and it's consequences, Expecting Crude at higher levels giving wide upswings is not unreasonable.
Trade Levels
above $94.70, another good up-swing could be expected,
Immediate support is at $90.12
$85 and below is major support.
resistance remains at the levels of $104, $110
Strict Risk management should be applied and Position should be sized according to individuals risk appetite.
For Educational Purposes only, Not an Investment Advice
 Long
Long
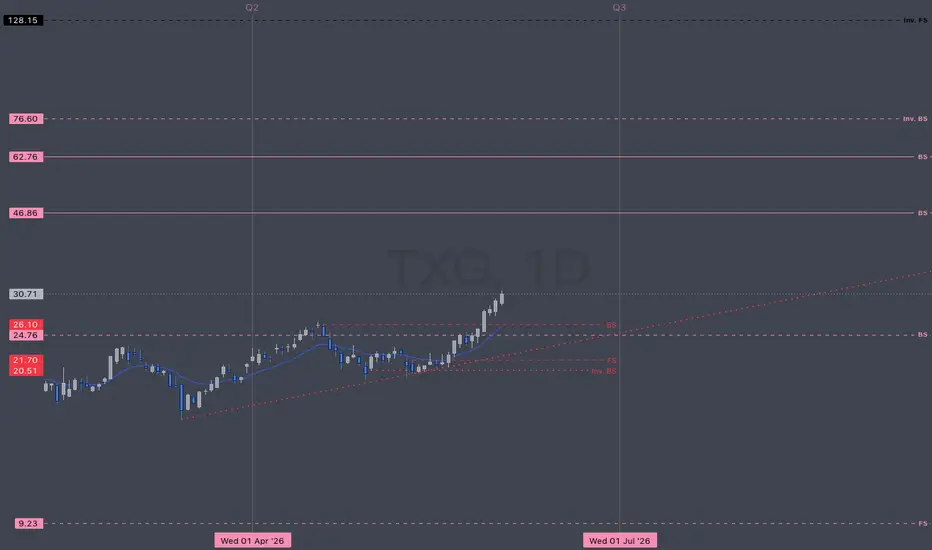
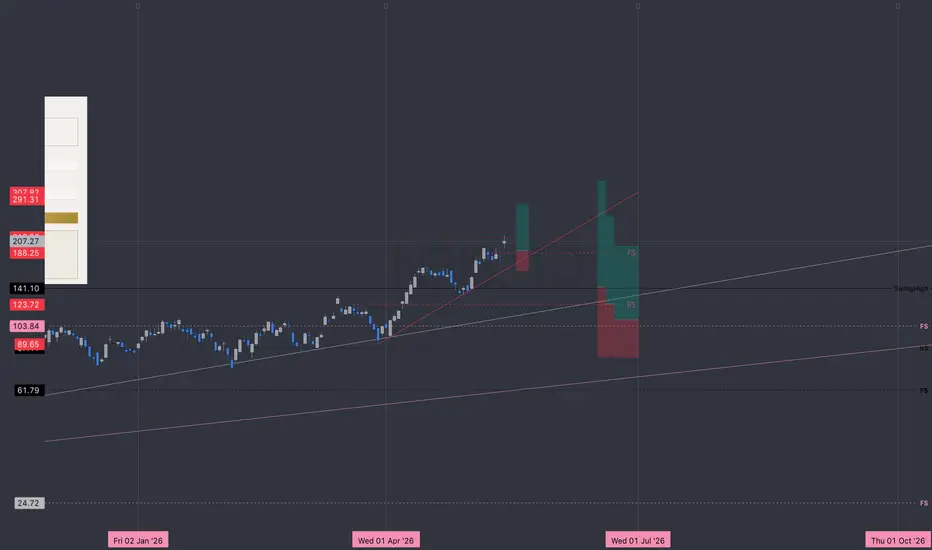
TXG | 26' Q2 June | Day ChartMARKET-BEATING SCORE = 5/10
TXG | 10x Genomics, Inc.
"is a life science technology company, which engages in building products to interrogate, understand and master biology. Its integrated solutions include single cell transcriptomics, single cell genomics, single cell epigenomes, linked-reads genomics and spatial transcriptomics. The company’s products include Single Cell Gene Expression, Immune Profiling, ATAC, and Genome. "
HQ in: Pleasanton, CA.
------------------------------
-------------------------
Multiple Time-Frame Analysis; Color Code | Strength favors the higher timeframe.
Yearly timeframe = black
Monthly timeframe = pink
weekly = grey
daily = red
4hr = orange
1hr = yellow
15min = blue
5min = green if they are shown. (Level visibility on intervals is set to timeframe the level was found on and below to keep chart view organized.)
** Candle Science explained **
A Range = two or more consecutive color candles.
There are two types of ranges - accumulation and distribution.
DISTRIBUTION RANGES DEFINED: BackSide (BS) Candle - First distribution candle in a distribution range. Expectation = strong reaction to price. long wicks reaching to or away from level.
FrontSide (FS) Candle - Last distribution candle in a distribution range. Expectation = reversal, create a trend in the opposite direction. Distribution candles are used as support.
ACCUMULATION RANGES DEFINED:
Inverse BS (Inv.BS) - First Accumulation candle in an accumulation range. Expectation. = strong reaction to price. long wicks reaching to or away from level.
Inverse FS (Inv.FS) - Last accumulation candle in an accumulation range. Expectation = reversal, create a trend in the opposite direction. Accumulation candles are used as resistance.
Horizontal Ray tool on BS & FS levels are default support levels when dashed lines, tested when dotted lines and resistance when solid lines.
Horizontal Ray tool on Inverse BS & Inverse FS levels default as resistance and shown with a dashed line, tested when 1x dotted line, and support when solid line.
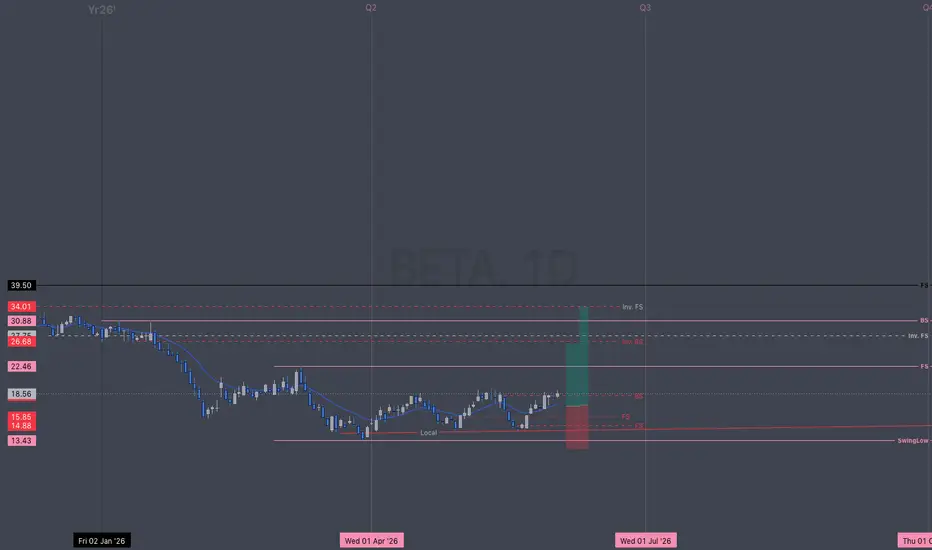
The inverse is true for the Inv. BS Inv. FS levels, they are resistance as dashed lines, tested as dotted and support as solid lines. BETA | 26' Q2 June | Day ChartMARKET-BEATING SCORE = 2/10
BETA | Beta Technologies, Inc.
"is an electric aerospace company focused on designing, manufacturing, and selling high-performance aircraft, propulsion systems, and charging systems. The firm designs and manufactures the ALIA, a family of electric aircraft with a conventional takeoff and landing (CTOL) and vertical takeoff and landing (VTOL) variant."
HQ in: South Burlington, VT.
------------------------------
BULL CASE — +25%
Strong revenue growth (73%) supports market-beating returns.
High gross margin (72.2%) signals strong moat — characteristic of long-run market beaters.
Negative FCF — cash burn is a risk factor against market-beating returns.
BEAR CASE — −25%
Net losses burning cash — equity value erodes through any drawdown.
Negative FCF: capital markets disruption could accelerate a −25% event.
-------------------------
Multiple Time-Frame Analysis; Color Code | Strength favors the higher timeframe.
Yearly timeframe = black
Monthly timeframe = pink
weekly = grey
daily = red
4hr = orange
1hr = yellow
15min = blue
5min = green if they are shown. (Level visibility on intervals is set to timeframe the level was found on and below to keep chart view organized.)
** Candle Science explained **
A Range = two or more consecutive color candles.
There are two types of ranges - accumulation and distribution.
DISTRIBUTION RANGES DEFINED: BackSide (BS) Candle - First distribution candle in a distribution range. Expectation = strong reaction to price. long wicks reaching to or away from level.
FrontSide (FS) Candle - Last distribution candle in a distribution range. Expectation = reversal, create a trend in the opposite direction. Distribution candles are used as support.
ACCUMULATION RANGES DEFINED:
Inverse BS (Inv.BS) - First Accumulation candle in an accumulation range. Expectation. = strong reaction to price. long wicks reaching to or away from level.
Inverse FS (Inv.FS) - Last accumulation candle in an accumulation range. Expectation = reversal, create a trend in the opposite direction. Accumulation candles are used as resistance.
Horizontal Ray tool on BS & FS levels are default support levels when dashed lines, tested when dotted lines and resistance when solid lines.
Horizontal Ray tool on Inverse BS & Inverse FS levels default as resistance and shown with a dashed line, tested when 1x dotted line, and support when solid line.
The inverse is true for the Inv. BS Inv. FS levels, they are resistance as dashed lines, tested as dotted and support as solid lines. Short 
Broad Uptrend, Quiet Adapt-Divergence-Reading AI InfrastructureNVDA closed at 222.82 today, holding above its smoothed signal path with the Adaptive Trend Filter reading **Good** across every structural metric — **Strong** momentum at +1.38% over the last 5 bars, **Increasing** trend pressure, and **Perfect** Technical Rating. The MAMA/FAMA cycle filter is tracking an 18-bar dominant cycle with the Reversal Engine quiet (no conviction score above 50). The broader screener reports the NASDAQ AI Infrastructure universe in **Broad Uptrend** — 23 of 37 tickers in Elite tier, only 2 in Bear.
The headline read is unambiguous. The interesting story is what sits underneath it.
### The Elite cohort is dense and stacked in semis
The top 10 Elite names by rank are exclusively chips, semi equipment, and the SMH benchmark itself:
- **#1 SNDK** (41b in tier) — RankVal +84.2, ADD · Strengthening
- **#2 MU** (35b) — +39.8, ADD · Strengthening
- **#3 DELL** (27b) — +33.1, ADD · Strengthening
- **#4 MRVL** (32b) — +32.5, ADD · Strengthening
- **#5 ARM** (15b) — +26.1, ADD · Strengthening
- **#6 AMAT** (53b) — +21.2, HOLD · Mature
- **#7 LRCX** (38b) — +20.5, HOLD · Stable
- **#8 AMD** (13b) — +19.4, ADD · Strengthening
- **#9 KLAC** (51b) — +15.7, HOLD · Mature
- **#10 SMH** (40b) — +13.4, ADD · Strengthening
Eight of ten read **ADD · Strengthening**; two read **HOLD · Mature** without rank decay. That's a textbook breadth pattern — the secondary semis are running with concentrated conviction, and the long-standing trends (AMAT at 53 bars, KLAC at 51 bars) are holding without fatigue.
Notable: **NVDA itself ranks below #10 in the Elite tier**. The namesake of the AI trade is in Elite, but it's the secondary semis — memory, equipment, custom silicon — driving the rank-momentum right now. That's a regime-internal observation worth holding in mind.
### The Confirmed tier is flashing one specific warning
Eight names sit at 2-of-3 bullish — and every one shares the *same* failure mode. The Adaptive filter (MAMA/FAMA) has flipped bearish while FAST and CORE remain bullish:
- **NYSE:VRT** — 6b, A↓-7, WATCH · Adapt divergence
- **NYSE:GEV** — 9b, A↓-3.9, **TRIM · Adapt warn+fading**
- **NYSE:PWR** — 1b, A↓-0.6, WATCH · Adapt divergence
- **NASDAQ:EQIX** — 11b, A↓-0.5, WATCH · Adapt divergence
- **NYSE:DLR** — 12b, A↓-1.6, WATCH · Adapt divergence
- **NYSE:TT** — 10b, A↓-1.0, WATCH · Adapt divergence
- **NASDAQ:AMZN** — 1b, A↓-0.7, WATCH · Adapt divergence
- **NYSE:HUBB** — **20b, A↓-1.5, WATCH · Adapt divergence** ← Top Read
The screener's "Top Read" line surfaces HUBB specifically: 20 bars of Confirmed-tier persistence with MAMA flipped bearish. That's the longest-running adapt-divergence in the cohort and the engine's flagship warning.
### Why this matters
The Adaptive filter detects cycle changes through MESA spectral analysis — it tends to flip first when the dominant market cycle is shifting, before the slower Hybrid (CORE, 3-pole) and SuperSmoother (FAST, 2-pole) filters confirm. When the *same* failure mode appears across multiple Confirmed-tier names — A↓ while F↑ and Co↑ — that's the regime engine telling you something specific: the second-tier of the AI infrastructure trade (electrical infra, cooling, data center REITs, power gen) is starting to lose cycle support, and the slower filters haven't caught up yet.
This doesn't invalidate NVDA. The chart subject is in Elite tier with Perfect Technical Rating, Strong momentum, and a 2.73% Safety Margin above its baseline. But the screener's value here is making visible what raw price action obscures — that "23 in Elite, 2 in Bear" headline doesn't capture eight Confirmed names simultaneously flashing the same cycle warning.
### The Emerging tier confirms the pattern from below
Three names read **WATCH · Persistent early** with Adapt-only-bullish while FAST and CORE remain bearish:
- **NASDAQ:SMCI** — 35b, A↑+20.4 (rank trending up)
- **NASDAQ:MSFT** — 34b, A↑+4.3 (rank trending up)
- **NYSE:ORCL** — 35b, A↑+12.1 (rank trending up)
These are names where the cycle filter has been calling improvement for 34-35 bars before the structural trend confirms. Patient setups, not noise.
### What invalidates this read
NVDA breaking its CORE baseline (visible on chart as the green-to-red transition zone) would flip its consensus to Confirmed and put the Adaptive filter's divergence behavior on the namesake — a different question than where it currently sits. More directly: if HUBB's adapt-divergence persists to 30+ bars *and* its rank trajectory turns negative, the engine would re-tag from WATCH to TRIM · Adapt warn+fading, and the Confirmed-tier warning shifts from observational to actionable.
Conversely, if MAMA flips back bullish across the Confirmed cohort and the Adaptive filter rejoins consensus, the warning resolves and the Broad Uptrend regime extends without the qualifying footnote.
### Bottom line
Multi-filter consensus screening isn't about replacing trend judgment — it's about making *internal* sector state visible at a glance. Right now, the AI infrastructure stack has strong headline breadth and a synchronized cycle warning sitting one tier beneath it. Both are real. Both matter for how you size and where you trim.
---
*Indicator: Ehlers Adaptive Trend Filter + Consensus Engine by TrendMatrix Labs*
*Not financial advice. Position sizing, entry timing, and risk management are independent of trend identification.*
 Education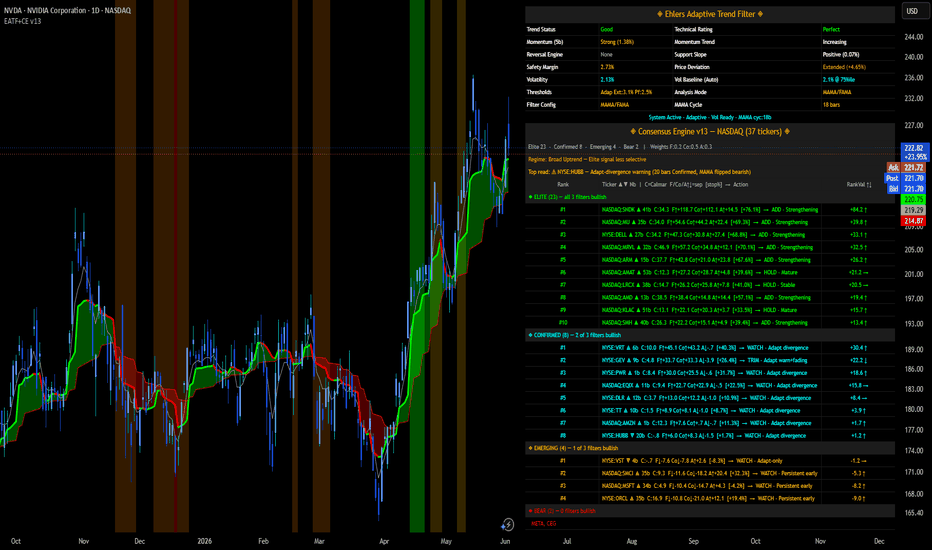
Day 69 of 90 — Sellers Are Still In Control🛡️ Day 69 of 90 — Sellers Are Still In Control
XAUUSD | M15 | Sentinel Core | Sentinel Structure | Sentinel Companion
Situation
• Gold rallied strongly earlier and reached a high near **4,540**.
• Sellers stepped in and pushed price lower.
• Price is currently trading around **4,487** after bouncing from support.
• The market remains below key resistance levels.
👉 A short rally does not automatically change the trend.
What This Chart Shows
• Trend direction is currently **Bearish**.
• Price is making Lower Highs (LH) and Lower Lows (LL).
• EMA21 and EMA50 remain above price and are acting as resistance.
• Sellers continue to control the overall market structure.
👉 The trend decides. Not a single candle.
🟦 Phase 1 — Trend Reversal
• Price reached a major high near **4,540**.
• Sellers took control and pushed price lower.
• The first Lower High formed.
• Market structure shifted from bullish to bearish.
👉 Trends change when structure changes.
🟩 Phase 2 — Sellers Take Control
• Lower Highs continued to form.
• Lower Lows followed.
• Every rally struggled to break resistance.
• Sellers maintained pressure throughout the move.
👉 Lower Highs are evidence that sellers remain in control.
🟨 Phase 3 — What Is Happening Now
• Price bounced from support around **4,470–4,475**.
• Current price is around **4,487**.
• Resistance sits above at **4,495–4,505**.
• Buyers must break and hold above resistance to change the trend.
👉 Until then, the trend remains bearish.
Key Lesson
Many beginner traders see a few green candles and think the market is turning bullish.
The problem?
The overall structure is still bearish.
Professional traders focus on trend direction first.
They wait for confirmation instead of guessing.
As long as Lower Highs continue to form, sellers remain in control.
Momentum alone is not confirmation.
Execution Note (Sentinel Core)
• Watch resistance around **4,495–4,505**.
• Watch support around **4,470–4,475**.
• Wait for a Lower High to form.
• Structure first → Confirmation second → Execution last.
🛡️ No confirmation = No trade.
Trend Summary
🔴 **Trend:** Bearish
💰 **Current Price:** 4,487
📈 **Resistance:** 4,495–4,505
🛡️ **Support:** 4,470–4,475
⚠️ **Status:** Bearish Pullback — Waiting for Lower High Confirmation
Sentinel Principle
You do not trade the move.
You trade confirmed structure.
🛡️ Patience > Excitement
Series Note
Building consistency through observation, not prediction.
#XAUUSD #Gold #PriceAction #MarketStructure #SentinelCore #Intraday #Scalping #TradingView
Buy the dip: Gold could repeat its classic rebound pattern!Gold rebounded to around 4541 before falling back under pressure, indicating that gold remains weak. Moreover, the current situation between the US and Iran is unclear, and the technical conditions are insufficient to achieve a breakthrough, so gold does not have the conditions to form a one-sided trend in the short term. From the current technical structure, gold has failed to break through the 4560-4580 area multiple times during the rebound. After the rebound highs gradually declined, a resistance barrier has once again formed in the 4540-4560 area in the short term, further limiting the upside potential of gold.
However, it is worth noting that although gold is currently weak and has failed to break through multiple times. However, strong support was still evident below, and the inverted head and shoulders support pattern formed in the short term has not been completely broken. Gold bulls still showed considerable resilience, and with gold repeatedly testing the bottom and rebounding, the short-term support has moved up from the 4420-4400 area to the 4480-4460 area.
Therefore, gold has not formed a one-sided downward trend in the short term, and it cannot be ruled out that gold will launch another counterattack after repeatedly testing and verifying the support during the process. Moreover, before the NFP, market sentiment is more cautious, so gold is very likely to maintain repeated fluctuations in the 4560-4460 range.
Therefore, in short-term trading, if gold retraces to the 4485-4465 area first, I will consider going long on gold; if gold does so, I will focus on the 4525-4545 area, which may be the potential entry area for short sellers. Long 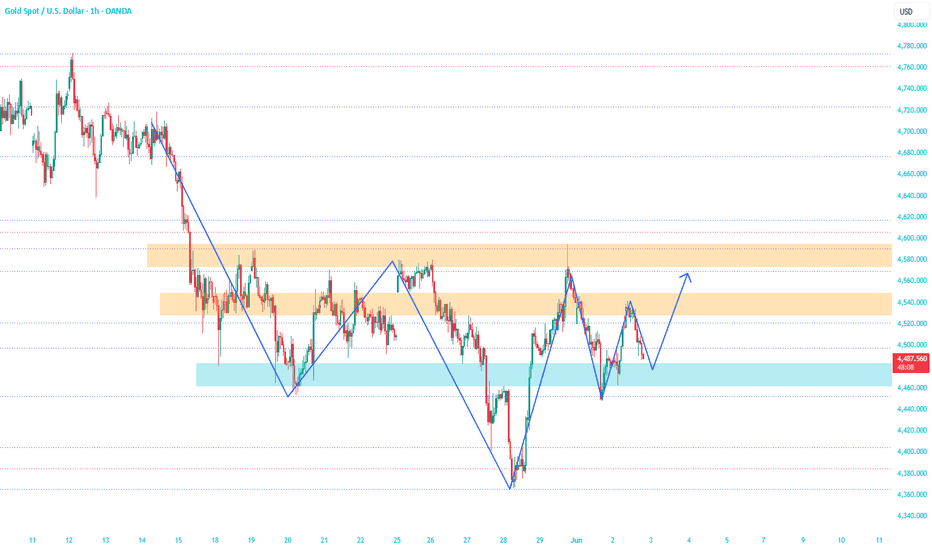
Support failed, but...This (as I call it:) $2.26 support -it was in the area of a resistance before- just failed twice (in the 15 min chart). And that means (more likely) it is not ready to stay above it for longer (yet). The 1 year price target is between $3-4, right? So I would not worry at all. More over, the longer term trend is heading up steady since the beginning of March. So now in the short term, $1.8 is the strongest support. Sure it could go down and see $1.6 again, for a bit, but then it would bounce back up, more likely than not. The trend continues (and so it is your friendship) until it's not, and "she throws your shit out of the window" -as David Frost would say. All in all, I'm bullish as I see the price of Lexicon will be between $1.6 and $7 in the next 5 years, (more likely than not!) End of story, period, full stop.  Long
Long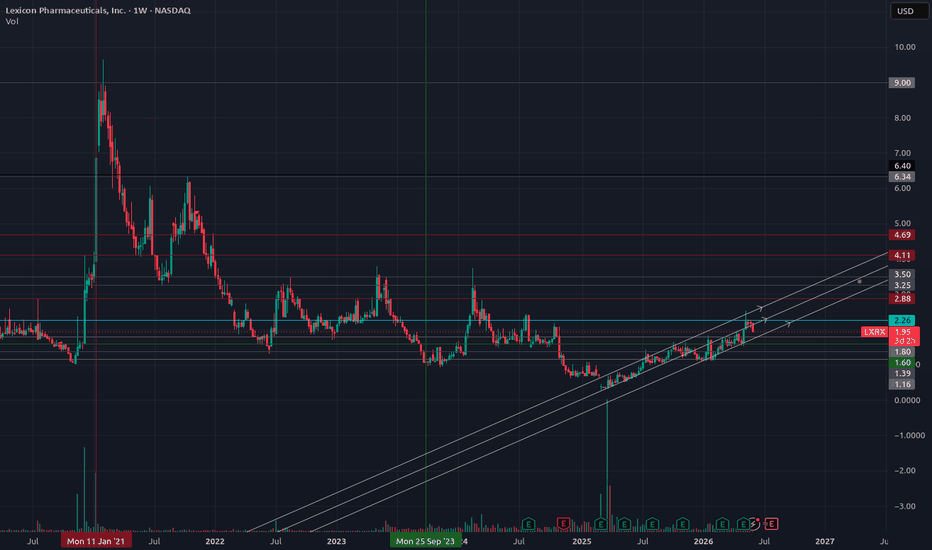
Long 
 Long
Long

 Long
Long