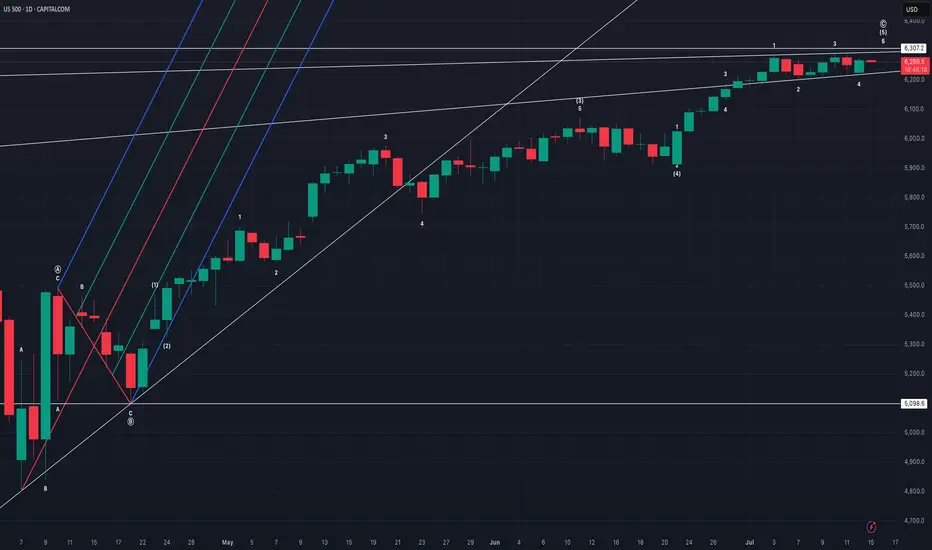
US500 evening analysisMy primary count of bullish price action since 7 April 2025 low sees regular flat (regular flat A, zigzag B, impulse C), impulse C with ending diagonal 5 of (5).
Median line (red line) of pitchfork was never tagged, implies price action eventually returning to origin (5098.6).
Ending diagonal invalid above 6307.2, bears with high reward, low risk opportunity.
Pitchforks
IBM: SHA-ttering ExpectationsAs we move through 2024, NYSE:IBM continues to demonstrate its strength as a technology powerhouse, particularly in cloud computing, AI, and cybersecurity. With a legacy rooted in innovation, IBM's deep history in encryption technologies and its forward-looking strategies make it a compelling buy for investors aiming to capitalize on the next wave of tech advancements.
Financial Performance:
Revenue Growth: IBM reported a 5% year-over-year increase in revenue for Q2 2024, driven primari
The GENIUS Act: A Historic Breakthrough in Stablecoin RegulationIn the fast-evolving world of cryptocurrencies, stablecoins have carved out a unique role, acting as a bridge between digital assets and traditional finance. Until recently, however, the regulatory framework for these instruments remained fragmented and unclear. The adoption of the GENIUS Act marks the first major step toward establishing a coherent regulatory system for stablecoins in the United States — an event already being hailed as a historic breakthrough.
What Is the GENIUS Act?
The GENI
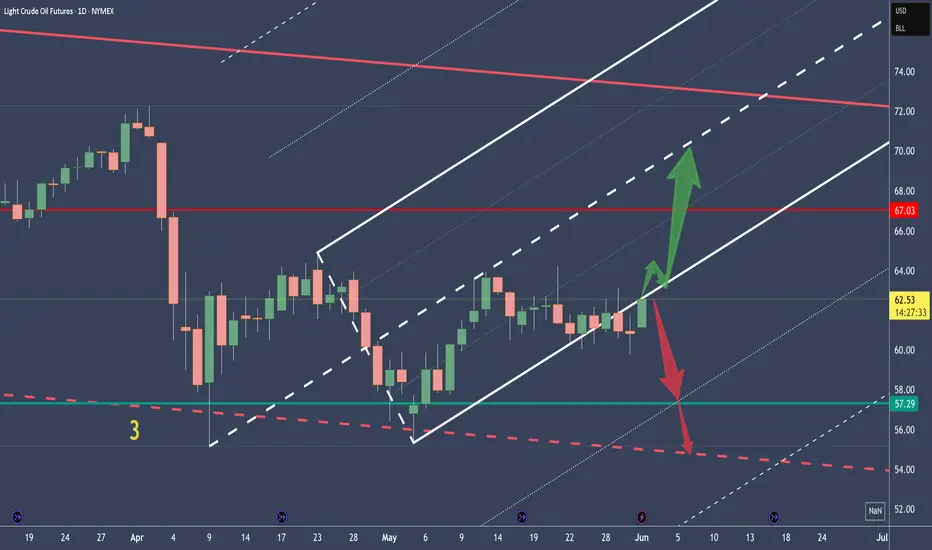
Crude Oil - Two Scenarios and about Brain PowerPrice retests the L-MLH.
VI. - Price breaks upward, target is the centerline
VII. - Price reverses again, then the target is the 1/4 line, with a subsequent extended target at the red centerline, and possibly even lower at the white dashed warning line.
On a personal note:
I was once again told that the price didn’t do what I had projected.
...yeah, really, that’s how it is §8-)
After over 30 years in the markets and hundreds of coaching sessions, I’m still amazed that people think you can
USFD – US Foods has reached its zenithIn 2020, we had the action, and since 2024 the market's reaction. Just as Newton describes the universal law of Action/Reaction.
However, we see that USFD has reached the centerline of the white Fork, which coincides with the reaction high and the upper median line (U-MLH) of the yellow fork!
There is not much more to say about it.
It's a clear Short to me, and the target are always the Forks and the A/R lines. And if you have enough fantasy, GAP's are always get filled....
...they say.
WDFC - WD-40 a good shortWD-40 changed direction to the south after the 5/0 count.
Soon it will become clear whether the support from (4) holds or not.
But what is already apparent is that WDFC is struggling significantly at the trend barrier. No surprise, since this price level coincides with the natural resistance.
To me, this seems like a cheap short, even though a new, true low hasn't been reached yet.
A stop behind the resistance Zone is a fair bet.
AMZN Struggles at Trend-Barrier and ResistancePrice is still in upward mode.
Why am I bearish?
1. Rejection in the Resistance Zone
2. Second Hagopian
3. Close below the Red Forks 1/4 Line
PTG1 is the Center-Line.
Potential further PTG's below at the 1/4 Line and then of course the L-MLH.
Playing it with Options which give me much more leeway. For a hard Stop I would put it right behind the last high above the TB.
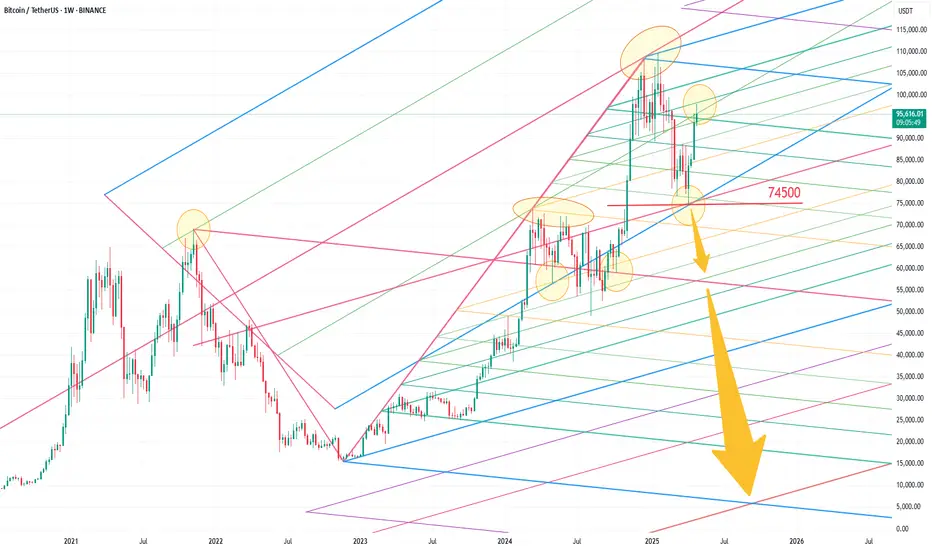
BTC log pitchfork (re-up)the BTC Log scale Pitchfork shows perfect Fib levels being respected. I don't know what it means or how to interpret this, no price target or direction from this, but the levels seem significant so I'm just noticing and playing the levels being held. All I know is buy the yellow the line (SMA40), and I drew the next lower pitchfork levels according to proportions.
Also, last season's ATH is always the next bearmarket season's bottom.
When in doubt, zoom out.
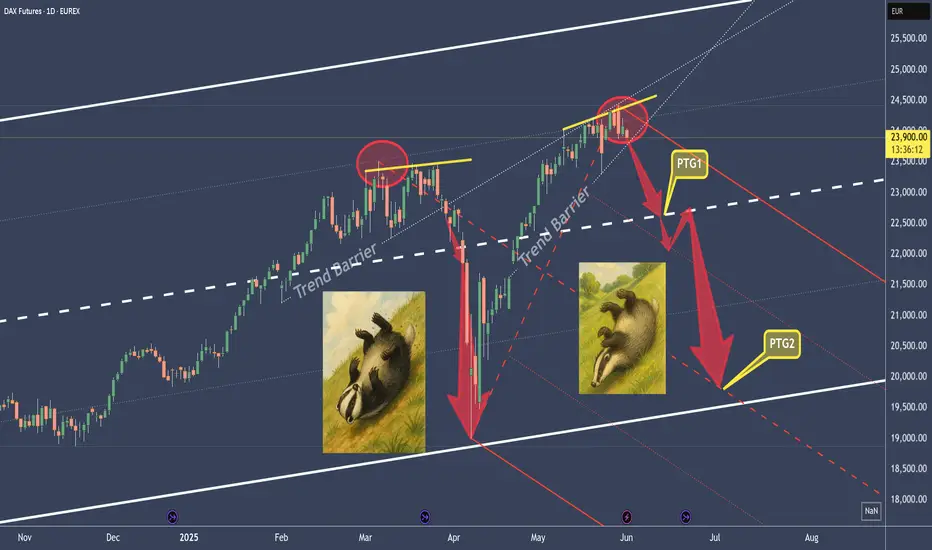
DAX Take 1 Part 2 – Reloaded but not yet good to goThe first time, we saw the DAX poke the 1/4 line.
This was followed by several attempts (distribution by the big players), and from that point on, it headed south and the DAX rolled down the hill.
Currently, it looks very similar.
I’m watching and observing the break of the trend barrier very closely, even on smaller timeframes than the daily.
The profit targets are indicated by the red arrows.
After the break of the thick white centerline, a strong retest of the CL could be in store.
My mai
Is This Brutal Sell-Off Finally Setting Up a Reversal?Looking at TON here and I'm seeing some interesting developments that caught my attention. We've been in this brutal downtrend since the November highs around $7, but the price action in this current zone is telling a different story.
The Setup:
Price has been getting absolutely hammered from that strong supply zone I've marked around $6.50-7.00. Every bounce into that area got sold hard, which is classic distribution behavior. But now we're sitting in what I believe is a critical accumulation z
TLong
Analysis of BTC price prediction for 2025 to 2026Hello sexy friends, I hoping that you are very good and be successful in this market today.
Based on the released data bullrun not happened yet and market still collecting the liquidity for a big movement, don't worry this year will finishing very nice by a great momentum....I want to all of we can give a nice profit from the market.
This analysis based on pitchfan tools that BTC can gets to high levels consist of 3 tp that I think :
Tp1 : 108,000$ that reached successfully
Tp2: 160,000$ common
BTC 4H Expansion scenario (Pseudo CRT with Elliott Wave)
This is just a sketch, but I found some interesting confluence between Pseudo CRT-like analysis and an Elliott count (expanded/running flat with A as a flat).
The automated indicator I created ("Seer Tee," doing the above-stated "pseudo-CRT" analysis) detected pivots for an upper-timeframe candles-based Modified Schiff Pitchfork.
From a bullish perspective, 89k-92k could be a target zone.
Invalidation below the thick white channel.
If the chart turns bearish, 80k will be the next stop.
Litecoin analysis using multiple toolsPlease read the full analysis to get the complete picture.
Let's start with the trend lines.
We have three increasing angles of support trend lines. The third one marked with this week's low so it might change if we happen to get a lower low.
For the resistance we have R1 which is anchored at the ATH at the December 2024 top. This resistance trend line was tapped twice more, in January and February 2025, creating marginally lower highs marking the triple top which sent Litecoin to its recent
Algorand Long Trade, 6x Potential by 2026Algorand has retraced to the lower Median Line, presenting a strong investment opportunity.
With current economic conditions favoring altcoins, Algorand stands out.
Oversold at present, I project it to increase 6x from its current level, with a direct move toward the ML likely by 2026 — potentially spearheading the altcoin rally.
I’m personally invested in Algorand with a R/R ratio of 18:1.
Long Term Brent Outlook, $32 by 2026Weekly Brent has broken a clear barrier and formed a Bull Flag pattern, but the subsequent rally has been weak, not even reaching the breakout level.
The global economy is showing signs of weakening, leading to a reduction in oil demand. Concurrently, Trump's move to lift US production restrictions is boosting oil supply. However, the slight depreciation of the dollar is providing upward pressure on oil prices.
Given these factors, Brent remains relatively weak, and we may see a continued dec