BTC Sideways then DUMPAs the risk assets diddle a little bit in the middle.
NQ will keep posting ATH's until the AI Companies goes for the IPO.
I feel that AI Companies IPO's will mark the top of this cycle of 2022.
Meanwhile BTC being higher risk asset is hanging by a thread. Lower prices are coming.
Window of weakness will be seen in Q3 of 2026 and a possible Reversal in Q4 of 2026.
We have a really healthy sellside liquidity built up which should be an easy target to chase for Market Makers.
Lets see how thi
Seasonality
Silver: Seasonal Confluence & Ratio CompressionA) The 2026 Macro Hierarchy: Liquidity & Rates
Silver is currently navigating a pivotal shift in the global liquidity regime as we approach mid-May 2026.
• Liquidity Regime (DXY & Yields):
The U.S. Dollar Index (DXY) has broken local support, testing the 97.70 level. This persistent dollar weakness, combined with 10-year yields stabilizing at 4.38%, has significantly reduced the opportunity cost of holding non-yielding metals.
• Inflation Regime (PCE & CPI):
Markets are pricing in a "Gol
Bitcoin akan melanjutkan bearish hingga bottomBitcoin is expected to continue its bearish trend until reaching the bottom
Bitcoin( BITSTAMP:BTCUSD ) - Welcome to the bear market phase in the crypto market, especially Bitcoin, which previously reached its peak on October 24, 2025, at a price of $115,000 USD. Currently, Bitcoin is in the middle phase between the peak and the bottom within one market cycle.
Based on our indicator, CRYPTOID, the Bitcoin bottom is predicted to occur around November 14, 2026. Below is an illustration of th
$BTC Reaction to TGA Drain vs ISM ExpansionWhy aren't any of the macro gurus talking about how the Treasury General Account has risen ~33% in the past couple weeks due to tax season?
This is supposed to be a liquidity DRAIN on markets.
Is everyone fixated on the ISM Manufacturing PMI being in expansion the past 4 months, so liquidity does not matter as much anymore?
asking for a friend 🥸
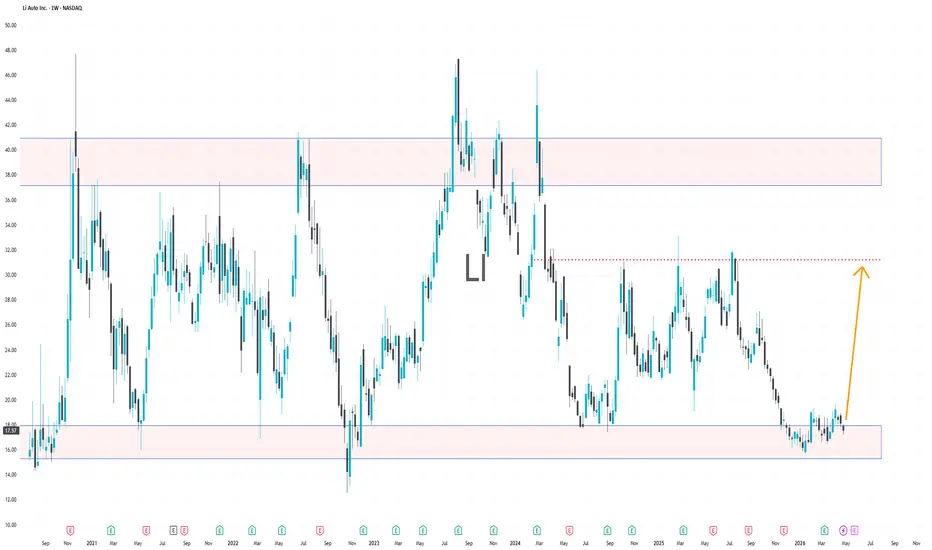
LI Back at Support as Historical Cycles Come Into PlayLi Auto is one of those names where price action alone doesn’t tell the full story—you need to overlay seasonality to really understand what’s going on.
Looking at the broader structure, LI has been trading in a well-defined range for quite some time. The chart clearly shows repeated reactions between a lower demand zone (around current levels) and an upper supply zone near the 30–40 area. Right now, price is once again sitting near that lower boundary, which already makes it technically intere
Microsoft MSFT Daily Demand Zone Entry $415 to $432Microsoft has corrected 22% from its late 2024 all time high near $539, bringing price back into a strong daily demand zone between $415 and $432. Current price around $427 sits directly inside the entry window.
Entry Zone: $415 to $432
Stop Loss: $390
TP1: $455 (R:R 1:1)
TP2: $490 (R:R 1:2)
TP3: $522 (R:R 1:3)
Technical Context:
The $415 to $432 band was the consolidation base that launched the 2024 bull run to ATH. Price returning here is a first fresh test of this demand zone. Sellers are l
Gold Inside Day Signal - Backside of the Month Reversal Idea
Gold gave us an inside day on Monday (opening range). Price is hovering over last week's low of the week (4658) and the low of the week before on April 10 (4644). If an opportunity presents during the NYSE open (9:30 AM EST), we'll look for a quick move towards the lowss that breaks all 3 (1) yesterday's LOD (Inside low) at 4668 (2) last week's low at 4658, and (3) April 10 low at 4644) triggering short sellers and breakout traders in the process as well as potentially hunting higher timefram
Best Time To TradeMost traders think the market is only about levels, zones, and entry patterns. But there is another factor that directly affects price movement — time.
And if you still struggle to trade consistently, this material can become the boost that takes your trading to the next level.
The market does not move randomly.
It moves during specific hours, when liquidity enters the market.
This concept is known as time theory.
The idea is simple:
not all time periods are equally important for trading.
The Only 3 Market Conditions That MatterThe Only 3 Market Conditions That Matter (And What to Trade in Each)
Most traders are not losing because of bad strategies.
They’re losing because they’re using the right strategy in the wrong market condition.
If you understand this, your results change immediately.
1. Trending Market — Ride Strength, Don’t Fight It
This is when price is moving clearly in one direction (higher highs / higher lows or the opposite).
What works:
• Breakouts
• Pullbacks to trend (EMA, support/resistance)
• Trend
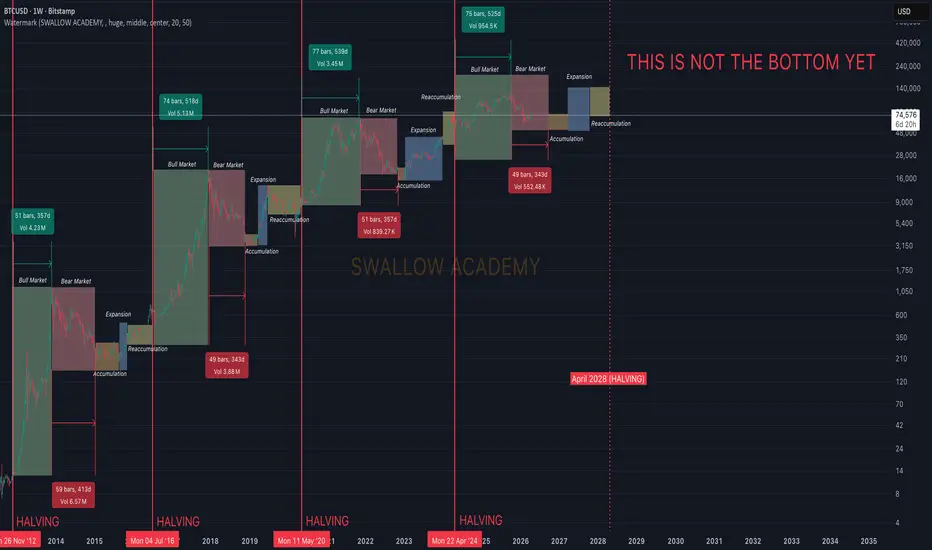
Bitcoin | Bear Market Will Be Until Approximately September 2026Well, seems like timing is everything with each cycle where this time the bull market
Swallow Academy +/- 500 days, just as for the last 2 bull markets. And if we look at the previous bear markets, we had them for +/- 300 days, which gives us at least 5 more months of bloody markets, or as we would recall them, "a discount zone most traders will miss most probably."
So this is what it is all about, a reminder: there are times when it is best to buy something and there are times when it is bes
I think BTC rejects hereMy script that is public along with the Bull market support bands lays roughly 77-79k. During this time of the cycle, BTC rarely ever exceeds the resistance top and bull market support band. 2 major macro scripts point towards a rejection coming up, based on historical price action, and math.
We are in a bear market, that was made clear in Q4 last year. If BTC does break out of these indicators, I think that integrity of the 4 year cycle will be challenged.
Based on major indicaotrs that I'v
Gold Long Bias – 80% ProbabilityPrice action has been trending to the upside, consistently respecting lower timeframe market structure.
It is currently trading above all higher timeframe EMAs, while sweeping lower timeframe liquidity and forming a sequence of higher highs and higher lows.
If price continues to push higher from this level, it will print a new daily candle with both a higher high and a higher low relative to the previous day, reinforcing bullish momentum
How New EU Rules Transformed the Crypto Exchange Market MiCA in Action: How New EU Rules Transformed the Crypto Exchange Market from July 1, 2026
July 1, 2026, went down in history as " Day X " for the European crypto market. The MiCA (Markets in Crypto-Assets) regulation has officially entered into full force, concluding the transition period. Trading digital assets in the EU is no longer a "grey zone" but a strictly regulated industry comparable in transparency to the banking sector. For traders, this marks the end of the anonymous altcoin era
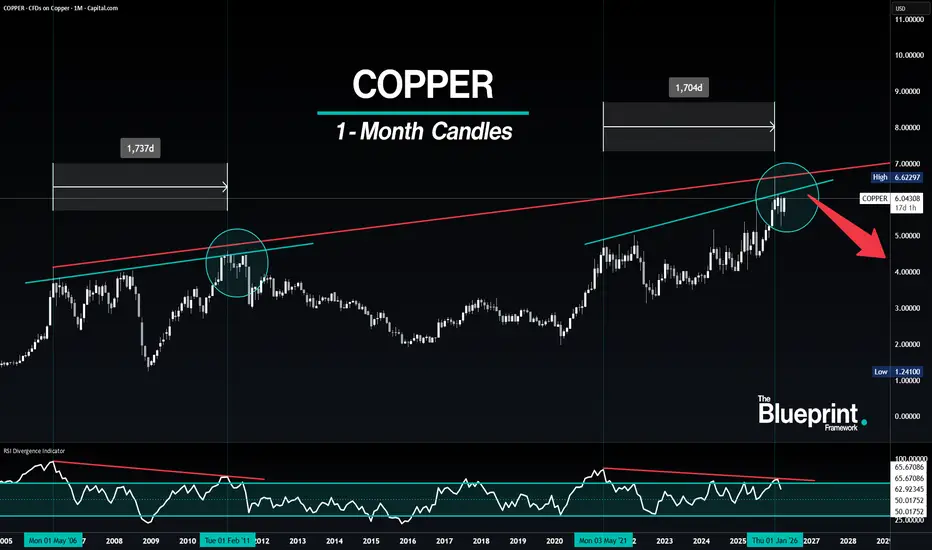
COPPER - If history repeats then copper is topping here.There is a risk of copper to top here around these levels. Its possible that we go up and make a new ATH and test the upper trendline, if we break above it and hold there is likely more upside to come, But if history repeats then we years of downside coming for copper which is very likely due to the 18.6 year cycle is in its last phase right now.
Evolution of Decentralized Exchange InfrastructureDecentralized exchange architecture is undergoing a gradual transformation from static automated market makers toward more modular and programmable liquidity systems. The introduction of extensible execution logic at the protocol level enables more complex interactions between liquidity providers, routing systems, and external execution layers.
This evolution shifts the role of exchanges from passive liquidity venues to active infrastructure layers capable of supporting diverse execution strate
D
US2000 :Long journeyThis is a continuation of the previous chart analysis. It’s a long journey—almost like a field trip.
The Russell 2000 Index is currently at a year-to-date level of +6.53%.
Now then, according to geometric delta analysis, with a remaining time of approximately 1,327 days, the level along the trajectory defined by the golden ratio (1.618) is 3,041 points.
This reflects the typical relationship between U.S. presidential election timing and equity market behavior. Given that the Russell 2000 cons
$NQ - Very tough to gaugeEither Option 1 happens.
I.e Next week forms a lower high and continue down
Or
Goes to ATH, completes the business cycle and goes to standard deviation level of -4 and then we get a major correction after Open AI and Anthropic gets its IPO
Who knows. Just trade what the market gives you.
GBP/AUDThe key focus for GBP/AUD is simply how much the pound can rebound from the recent highs. This is because the geopolitical importance of the resource-rich nation, Australia, is increasing day by day. From a chart perspective, the setup suggests we are in the final phase of an Elliott Wave structure—reflecting a prolonged period of Australian dollar strength and its resulting backlash.
Beloved US Crude OutlookWTI crude oil prices plunged sharply.
The key focus is geometric delta analysis in options trading.
The sharp decline, driven by rising expectations of an early ceasefire agreement with Iran, has significantly altered the scenario.
According to geometric delta analysis,
the estimated remaining time is around 60 days, which corresponds to approximately June 3, 2026.
The estimated strike price is about $135.50 per barrel.
Such a price level is not entirely unrealistic.
“The second act begins—st
NASDAQ100 - Historical Pattern in PlayLast year, NESDA100 made a double top at 22270 area. Later it fell below daily EMA200 in March, and correction continued to 0.5 Fib levels, till 16420 area.
NASDAQ100 is following exact same pattern so far this year. It did hit double top near 26290 area and it just closed below EMA200 on daily TF, and that too in Month of March (some seasonality in play?). I'd expect correction (call it a fall). A daily close below EMA 200 is already a strong bearish sign but still it closed above psychologica