• Products
  • Community
  • Markets
  • Brokers
  • More
Get started
  • Markets
  • /Argentina
  • /Stocks
  • /Ideas
Trade in AEM 23-10-26I entered a position in this asset, as it appeared to be a good buying opportunity. However, I was caught off guard—at the time of purchase, I didn't realize there were two assets with the ticker "AEM." It seems to be the same ticker, but one is traded in the United States, while the other is traded only in Latin America. The price variation is minimal—they essentially track each other—but, honestly, I would have preferred the U.S.-listed stock, as my core thesis was based on that chart rather t
BCBA:AEMLong
by Danielroble5
TSMC (BYMA) | ATM Watch: Defend 45.96. Challenge 49.15 and 54.22Semiconductors attract capital. My money still requires a qualified setup. On this 4H BYMA chart, the displayed TSMC depositary certificate trades around 47.84, recovering after a pullback from the October high. Price remains within the broader rising channel, with marked supply zones overhead. These levels refer to the instrument and quotation shown on this chart. The foundation — 45.956–45.970 This marked support area sits beneath the current consolidation. Continued buyer defense would suppo
BCBA:TSMCLong
by IUGRAVITY
Havanna - 71% down in market capitalization from all time highsRetail investors who bought into the hype-driven narrative on Twitter were put in their place. It was inevitable that I would be proven right. Buying at a high price—anywhere, but especially in Argentina—is a bad move. There is no narrative in our country that justifies holding a peso-denominated asset, regardless of how promising future economic growth might seem. I invested in Havanna—lucky enough to do so very close to the lows and to sell in November 2023. No one buys at the absolute bottom
BCBA:HAVA
by cavagnaro
Liquidity Sweep, Trendline Break, and Whats Next Here’s a clean way to walk your blog readers through this chart without overcomplicating it: > **What I’m seeing on SPY** > > SPY spent most of the session recovering from an earlier selloff. The important part is that buyers started producing **higher lows**, which tells us selling pressure was being absorbed instead of price simply continuing straight down. > > At the same time, SPY was still trading underneath a larger **descending trendline** coming down from the prior high. That trendline
BCBA:SPYLong
by davidblake850
1
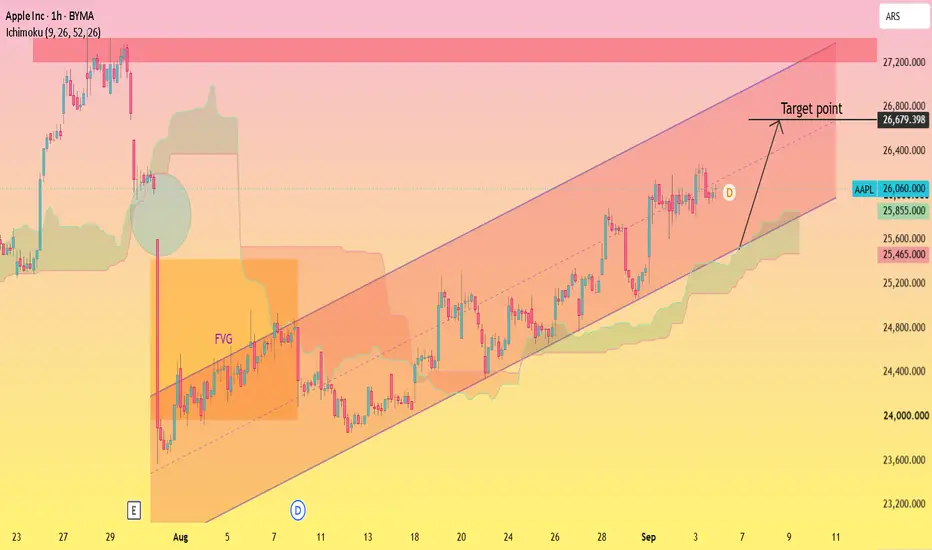
(AAPL) – Bullish Channel Continuation Apple is trading within a rising channel, showing steady bullish momentum. Price is holding above channel support, keeping the upside structure intact. A continued move toward the upper channel resistance remains possible if momentum holds.
BCBA:AAPLLong
by Alpha_Trade_Scope
Updated
9
looks a mess yes and it was not easy but the blueprint is live trial and error Attempting to map this was not easy. And making sense of it on anytime frame under a 4 hour is a myth. but for now we can wait to see how it plays out
BCBA:TSMC
by blackwhite121
Update on TXARBCBA:TXARD After my last publication, TXAR has been forming wave 1, Right at the moment im publishing this we are seeing the extension of the wave 3 of a lesser degree, it is all going as I planed. Any doubts in the comments
BCBA:TXAR
by lucasvillella06
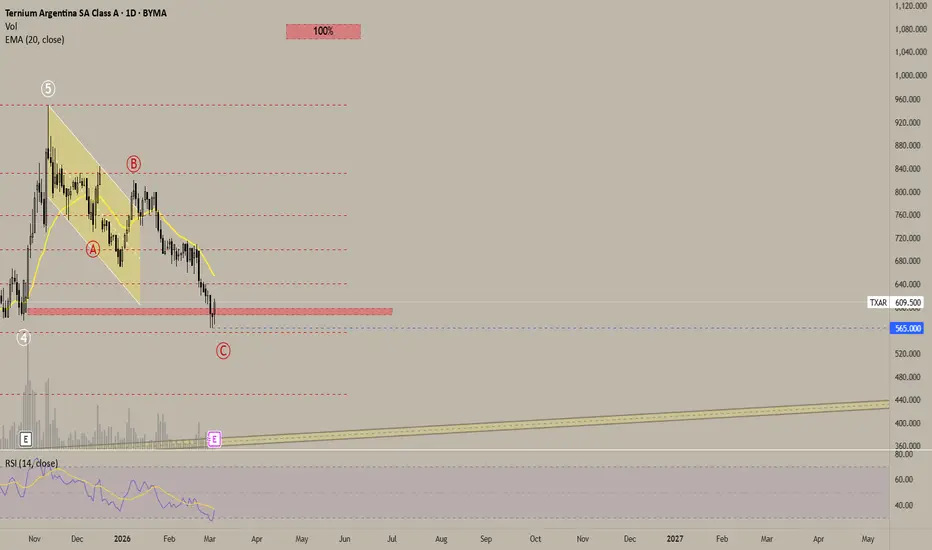
TXAR FInished Correction?BCBA:TXARD TXAR had my attention a long time ago, I'm almost sure the correction has finished. I have a lot of reason to think that, in the first place, when talking about Elliot Wave Patterns the corrections usually tend to finish on the 4th wave of less degree (as marked with the red rectangle), second I think that the count of fifth wave is completed, third if you see the candles they have a lot of wick on the lower part indicating the lower force to the bearish, forth the RSI is indicating
BCBA:TXARLong
by lucasvillella06
Possible ending of the correction.BCBA:TXARD I have to possible counts, the first one and suposly more probable is that what we are seeing is a zig zag, on the other hand we can have a WXY. If what we are having is a Zig Zag It is probable that the correction will finish on the red rectangle, because it is commonly seen correction waves finishing on the wave 4 of the less degree, plus the fibonnacci extension and correction is around there. I'm thinking on the WXY correction possibility because the first part of the correction
BCBA:TXAR
by lucasvillella06
Txar 3 wave or CBCBA:TXAR The correction finished earlier than I expected, although my expectation for the impulse are the same. Now that the correction could be over we have 2 scenarios, the first one is that the correction is over so our 3th wave should go at least to the 1 mark of the fibbonacci, the other could be that we are seeing a flat or a complex correction, however because it is the first correction it is more probable to be a zig zag that is sharper whether than anything else.
BCBA:TXARLong
by lucasvillella06
Correction of previous idea txarBCBA:TXAR new Count of Elliot since the market showed me another way as I expected
BCBA:TXAR
by lucasvillella06
The Four Different Sideways TrendsIn the modern Market Structure, stocks, indexes and industry indexes move sideways or trend moving horizontally most of the time. Understanding this phenomenon and how to use it to your advantage is important to learn. There are 4 different types of price moving sideways: 1. The consolidation is a very narrow price range, often less than 5% but can be wider. The consolidation trend usually lasts a few days to a few weeks. The price action is very tight and small. Pro traders dominate consolid
BCBA:SPYEducation
10:05
by MarthaStokesCMT-TechniTrader
1
SPY Weekly Options Trade Plan 2025-05-25SPY Weekly Analysis Summary (2025-05-25) Model Summaries Grok/xAI Report Technicals: SPY at $579.11, below short-term EMAs (10/50 on 5-min), above 200-period EMA, RSI oversold on 5-min, MACD bearish. Daily chart neutral to slightly bearish. Sentiment: Rising VIX (22.29), max pain at $580. Trade: Buy 2025-05-30 577 put at $5.12, profit target ~3-point move, 20% stop loss, confidence 65%. Claude/Anthropic Report Technicals: 5-min and daily charts bearish but RSI oversold intraday. Volume sell
BCBA:SPYShort
by quantsignals
Balanceo de cartera por monedas / carry trade #Sistema de BandasThe following chart shows how the portfolio could be balanced, taking into account exchange rate sensitivity and different levels of preference for both currencies.
BCBA:YPFD
by meza.mariian
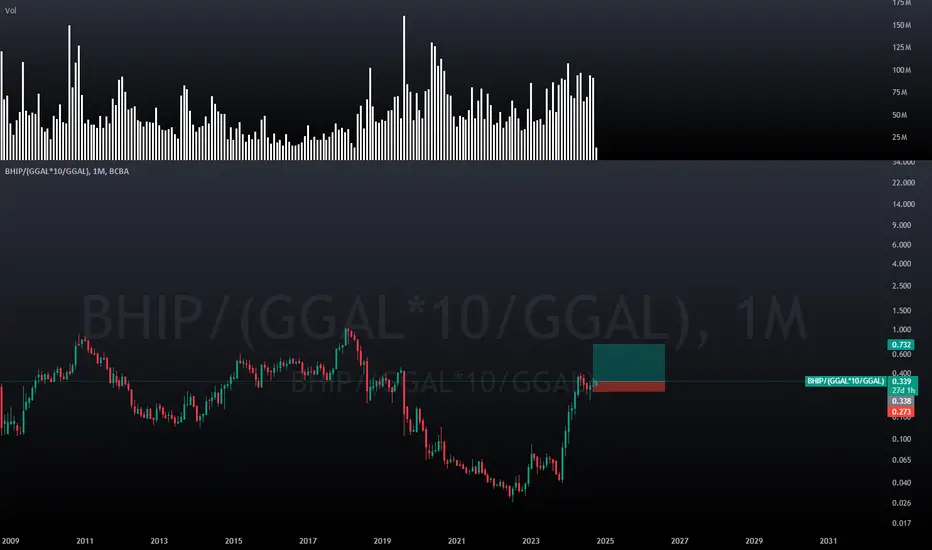
RATIO TXAR USD VS. MERVAL USDFrom the graph it is interpreted that the relative price of TXAR is at its lowest compared to the Merval shares as a whole. Which would suggest to us that it is behind schedule, this is just a ratio looking at other indicators, the stock still has a lot to go down, compared for example vs. The inflation of the last 5 years is much higher.
BCBA:TXAR
by francopezzelatto
XP INC CED EACH 2 REPR 1 | Chart & Forecast SummaryKey Indicators On Trade Set Up In General 1. Push Set Up 2. Range Set up 3. Break & Retest Set Up Notes On Session # XP INC CED EACH 2 REPR 1 Double Formation | A+ Set Up * Wedge Structure | Double Bottom Alignment | Subdivision 1 * 012345 Main Structure On Hold | Support=0 | Subdivision 2 Active Sessions On Relevant Range & Elemented Probabilities; London(Upwards) - NYC(Downwards) Conclusion | Trade Plan Execution & Risk Management On Demand; Overall Consensus | Sell
BCBA:XPShort
by UnknownUnicorn87383881
Sea Limited Cedear each 32 REP 1 ADRKey Indicators on Trade Set Up in General 1. Push Set Up 2. Range Set up 3. Break & Retest Set Up # Sea Limited Cedear each 32 REP 1 ADR - Rising Wedge & Falling Wedge * Retracement * Angle 1 & 2 Active Sessions on Relevant Range & Elemented Probabilities; London(Upwards) - NYC(Downwards) Conclusion | Trade Plan Execution & Risk Management on Demand; Overall Consensus | Buy
BCBA:SELong
by UnknownUnicorn87383881
Is EEM completing a bullish Bat pattern?EEM is trending lower but emerging markets such as China have great growth companies. A bullish Bat pattern could be finishing to develop and we should watch for a buy in the 8700-9000 area.
BCBA:EEMLong
by Dataludus
$BHIP ArgentinaThis Argentine Bank is going above the Ichimoku Cloud in 1W TF. Looks really bulllish as the rest of the Argentine Index.
BCBA:BHIPLong
by AP314
1
SPY: Continuity of the upward trendContinuity of the uptrend on SPY as you can see on the chart once the resistance line is broken forcefully by a large green candle and followed by a large green volume.
BCBA:SPYLong
by PAZINI19
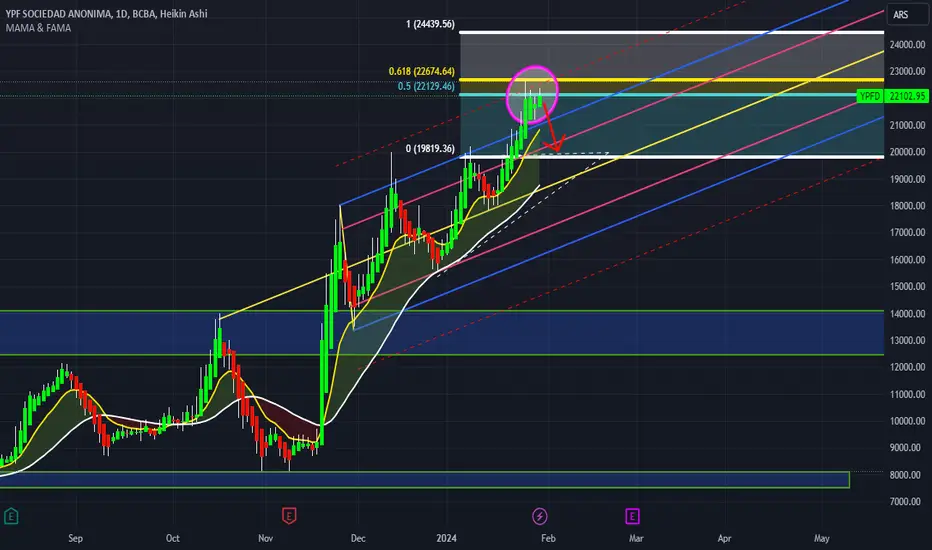
YPF SOCIEDAD ANONIMA in dayYPF SOCIEDAD ANONIMA I do not recommend buying stocks now. The market reaches the Fibonacci extension level and the highest level in pitfork
BCBA:YPFDShort
by elbahraouii
$BMA NYSE:BMA set to reach $35, multipyling its value x11 in US dollar.
BCBA:BMA
by fersileo
YPF SOCIEDAD ANONIMA will be in sidewaysThe chart pattern shows the stock will continue to be in sideways .
BCBA:YPFD
by MarxBabu
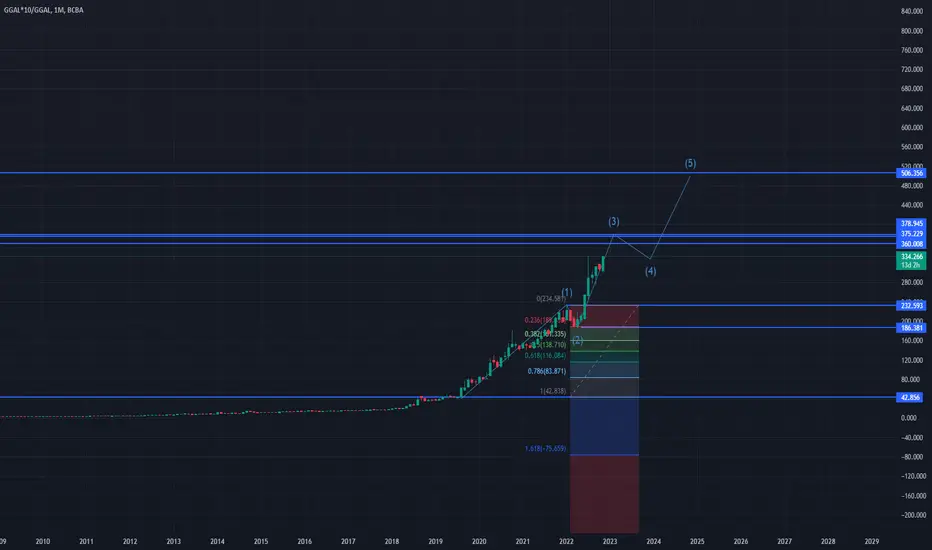
ARGENTINA GGAL MEPBullish pattern in Argentina MEP GGAL - target 376$
BCBA:GGALLong
by algomoneyfest
Updated
12345678910111213141516171819
…999

Made by humans

Select market data provided by ICE Data Services. Select reference data provided by FactSet. Copyright © 2026 FactSet Research Systems Inc.Copyright © 2026, American Bankers Association. CUSIP Database provided by FactSet Research Systems Inc. All rights reserved. SEC filings and other documents provided by Quartr.© 2026 TradingView, Inc.

SOC 2 CompliantGDPR Compliant
More than a product
  • Supercharts
Screeners
  • Stocks
  • ETFs
  • Bonds
  • Crypto coins
  • CEX pairs
  • DEX pairs
  • Pine
Heatmaps
  • Stocks
  • ETFs
  • Crypto coins
Calendars
  • Economic
  • Earnings
  • Dividends
  • IPOs
More products
  • News Flow
  • Portfolios
  • Fundamental Graphs
  • Yield Curves
  • Options
  • Macro Maps
  • Pine Script®
  • MCP Server
Apps
  • Mobile
  • Desktop
Community
  • Social network
  • Wall of Love
  • Refer a friend
  • Creator program
  • House Rules
  • Moderators
Ideas
  • Trading
  • Education
  • Editors' picks
Pine Script
  • Indicators & strategies
  • Wizards
  • Freelancers
  • Marketplace
Tools & subscriptions
  • Features
  • Pricing
  • Market data
  • Gift plans
Trading
  • Overview
  • Brokers
  • Brokers comparison
  • The Leap
Special offers
  • CME Group futures
  • Eurex futures
  • US stocks bundle
About company
  • Who we are
  • Space mission
  • Blog
  • Help Center
  • Careers
  • Media kit
Merch
  • Tarot cards for traders
  • The C63 TradeTime
Policies & security
  • Terms of Use
  • Disclaimer
  • Privacy Policy
  • Cookies Policy
  • Accessibility Statement
  • Trust Center
  • Security tips
  • Bug Bounty program
  • Status page
Business solutions
  • Widgets
  • Charting libraries
  • Lightweight Charts™
  • Advanced Charts
  • Trading Platform
Growth opportunities
  • Advertising
  • Brokerage integration
  • Partner program
  • Education program
Community
  • Social network
  • Wall of Love
  • Refer a friend
  • Creator program
  • House Rules
  • Moderators
Ideas
  • Trading
  • Education
  • Editors' picks
Pine Script
  • Indicators & strategies
  • Wizards
  • Freelancers
  • Marketplace
Business solutions
  • Widgets
  • Charting libraries
  • Lightweight Charts™
  • Advanced Charts
  • Trading Platform
Growth opportunities
  • Advertising
  • Brokerage integration
  • Partner program
  • Education program
Look FirstLook First