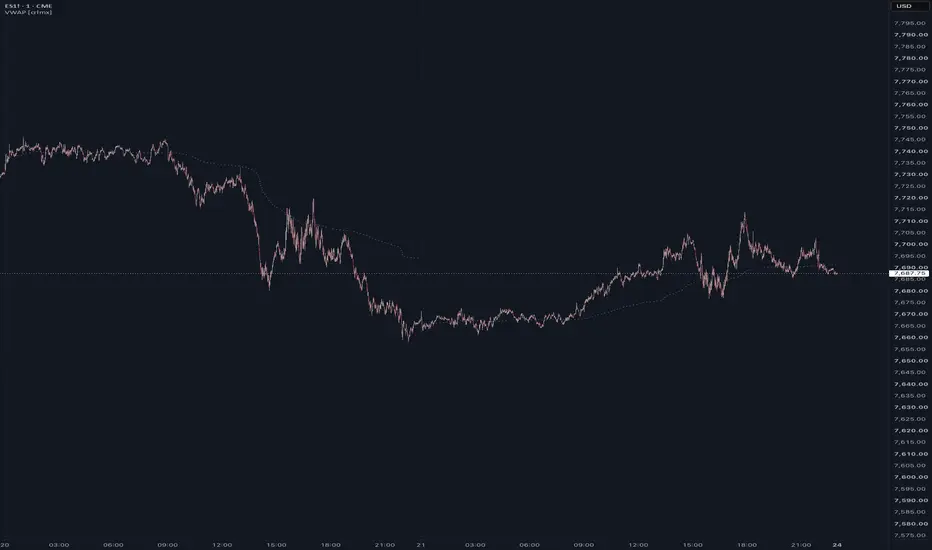
VWAP [crlmx] Flexible Volume Weighted Average Price (VWAP) for clean
volume-weighted fair value benchmark and trend direction.
Key Features
- Adjustable VWAP Anchor
- 30min, 1H, 2H, 4H, 8H, 12H, D, W, M, Q, Y
- Sessions New York, London, Asia, with adjustable time
- Clean session breaks, no skews in VWAP line
- Period limit fearure (default 3) hides older periods
- Streamlined inputs/UI brought to you by crlmx
Trading Applications
- Intraday anchors (30min-12H): scalping and day trading
- Daily anchor: traditional intraday analysis
- Weekly/Monthly/Quarterly: swing trading context
- Yearly: long-term fair value
- Configuration examples:
Scalping: 30min-1H anchor | Limit: 5-10 | Bands: On | Multiplier: 1.0-1.5
Intraday: Day anchor | Limit: 3-5 | Bands: On | Multiplier: 1.0-2.0
Swing: Week-Month | Limit: 3-5 | Bands: Off | VWAP line only
Position: Quarter-Year | Limit: 3 | Bands: Off | Fair value reference
Version History
v1.56 (Latest - 22 Feb 2026)
- VWAP display limit feature: shows set amount of periods
- Added Market Sessions
- Streamlined input panel organisation
Gösterge

Gösterge

Gösterge

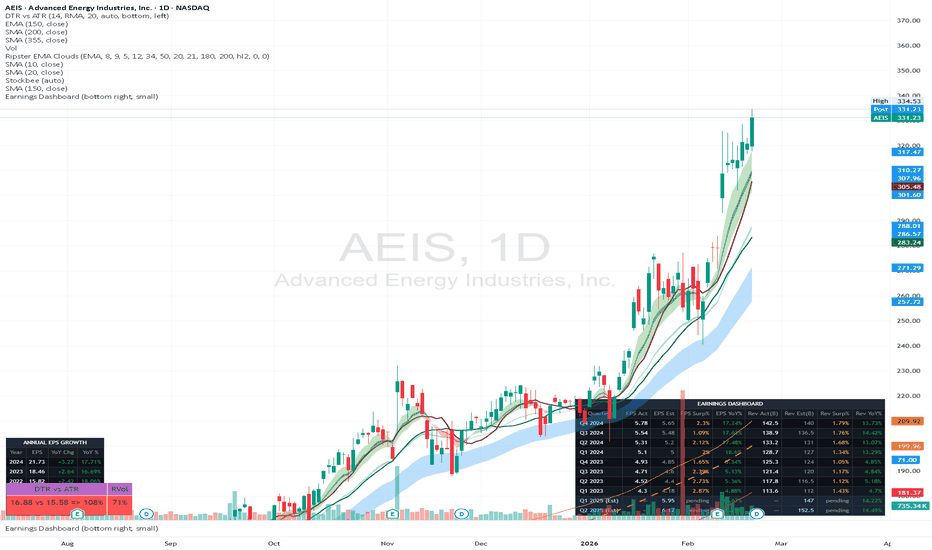
Code 33 - 3 qts of acceleration (YoY) for EPS, Sales, & MarginsMark Minervini's Code 33 screen, from his "Trade Like a Stock Market Wizard" book, helped him look for potentially powerful growth stocks that have 3 straight quarters of EPS (diluted) + Sales + NPMs growth on a YoY basis. I figured I create and share it as a script because as far as I know, TradingView lacks the ability to screen for fundamental acceleration, which here would be defined as consecutive quarterly growth on a YoY comparison basis (comparing Q1 of 2025 to Q1 of 2024; not comparing Q1 of 2025 to Q4 of 2024).
Acceleration is a trademark for techno-fundamentalists such as Minervini, O'Neil, Weinstein, and the list goes on. Now, you will not only be able to see this on your charts, but you can also use this on the Pine Beta Screener to filter for stocks that meet one or more of the criteria. Just set the filter condition to equal "1".
*A quick note on the code: TradingView doesn't have a native 'Net Profit Margin' identifier that isolates strict Fiscal Quarter (FQ) data without smoothing it into a Trailing Twelve Months (TTM) format. Because true YoY acceleration requires raw quarterly comparisons, I coded the script to manually calculate the exact quarterly margin by dividing FQ Net Income by FQ Total Revenue. This ensures the YoY acceleration signal is 100% accurate to the specific quarter.
I am not a coder by any means but I always wanted to have this available to me so after playing around with Gemini's pro LM, you should be able to see and screen stocks like this going forward. Maybe in the future, I will edit it for aesthetic purposes or add more to allow for even more detailed screening especially for CANSLIM investors like myself. I also made it open-source as well so if you prefer different metrics, it should not be too difficult to take this script into a LM of your choice and make it your own.
Happy trading.
NYSE:ASX Gösterge

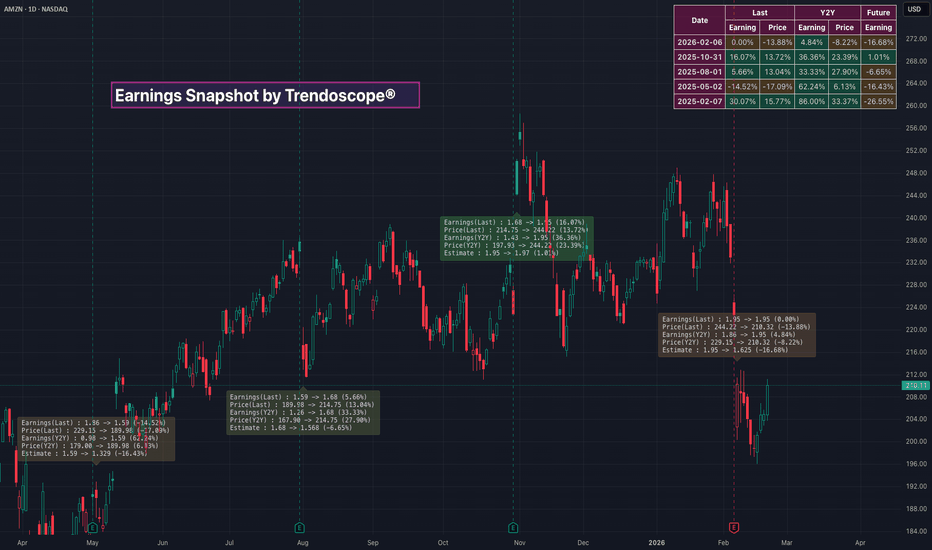
Earnings Snapshot [Trendoscope]🎲 Overview
The Earnings Snapshot is a custom indicator designed to provide traders and investors with a quick, visual overview of a stock's earnings performance and its impact on price action. This tool automates the analysis of earnings reports by fetching historical and future earnings data, calculating growth metrics for both earnings and price changes, and presenting the information in an intuitive table format on the chart. It also adds interactive labels at key earnings dates for detailed breakdowns.
During the earning season, I was trying to understand the earnings and revenue growth of microsoft in comparison with thier price growth. This involved tidious process of taking scereenshot of multiple earning reports and then drawing correlations between them.
This script eliminates the tedium of manual data gathering and visualization. It focuses on key metrics like actual vs. estimated earnings, year-over-year (Y2Y) comparisons, and future estimates, while highlighting how these events correlate with price movements. Currently, the script handles earnings per share (EPS) data effectively, but revenue details are not included due to ongoing technical challenges with the available data interfaces in Pine Script. Future updates may incorporate revenue analysis once we find an effective way to present this data.
This indicator is ideal for fundamental analysis, earnings season preparation, or post-earnings reviews, helping users spot patterns such as earnings surprises, growth trends, or price reactions.
🎲 Key Features
Earnings Data : Retrieves actual, estimated, and standardized EPS from TradingView's built-in request.earnings function.
Growth Calculations : Computes percentage changes in earnings and price compared to the previous quarter (Last), year-over-year (Y2Y, based on 4 quarters back), and future estimates.
Visual Table Display : A customizable table in the top-right corner showing dates, growth percentages, and color-coded indicators (lime for positive growth, orange for negative).
On-Chart Infomration : Based on the settings, users can enable presentation of earnings, price and the growth data on chart.
Historical Depth : Configurable history lookback (up to 24 quarters) to analyze past earnings.
Tooltip Mode: For a cleaner chart, labels show a score summary with full details available on hover.
Future Earnings Integration: Includes upcoming EPS estimates and their projected growth from the last actual earnings.
🎲 Display Modes
🎯Tooltip Mode
If we select tooltip mode, it is better to chose the label size as either large or huge for better visibility. In tooltip mode, the data is not directly presented on the screen. Instead, we display the calculated score on the earnings release bar. The earnings and price growth info will show up upon hovering on the printed score value.
🎯Text Mode
In case of text mode, all the calculated earnings and price growth data is printed directly on the chart. This will provide easier access to the data. However, it fills the chart. It is usefull for people who do not use additional indicators on the same chart or someone who trades mainly based on the earnings reports.
🎯Tabular Data
Tabular data presents the growth of Earnings and Price based on last quarter as well as Y2Y along with growth of estimated earnings. The table can be hidden through input settings.
🎲 Diving Deep
🎯Information Gathered and Presented
At present, we have tried collating and presenting following information for every earnings.
Q2Q Earnings Growth
Q2Q Price Growth
Y2Y Earnings Growth
Y2Y Price Growth
Q2Q Future Estimated Earning Growth
🎯 Calculation of Score and Color coding
When in text mode, the information of earnings and price growth are printed on the chart completely. These displays are color coded based on a calculated score. You can also see the score directly on the chart when the display mode is tooltip mode. Let us try to understand how this score is calculated.
Score is nothing but combination of different factors of price and earnings growth. Following conditions are considered for the calculation.
If Earnings growth is positive, add 1 else reduce the score by 1
If price growth is positive, add 1 else reduce the score by 1
If Earnings growth percent is higher than price growth percent, then add 1, else reduce the score by 1
Similar calculations are repeated for Y2Y earning and price growth. Finanlly the score also looks at if the future estimated earning is expected to increase from current actual earnings or is it expected to reduce.
Since there are 7 factors, the score can vary from -7 to +7. Higher the score, the greener the text background will be and lesser the score, the text background will turn more towards red.
🎯 Limitations
Assumes quarterly earnings; irregular reporting schedules may affect Y2Y accuracy.
Historical depth is limited to 24 quarters to avoid performance issues, but can be adjusted.
Works best on daily/weekly timeframes where earnings bars are visible.
No alerts or backtesting integration; this is purely a visualization tool.
🎯 Example of Interpretations
A green label with positive growth in both earnings and price suggests a strong beat with bullish reaction.
Orange cells in Y2Y might indicate slowing growth despite a recent beat.
Negative future estimates could signal caution for upcoming reports.
If you encounter issues or have suggestions, feel free to provide feedback. This script aims to streamline your manual analysis—happy trading! Gösterge
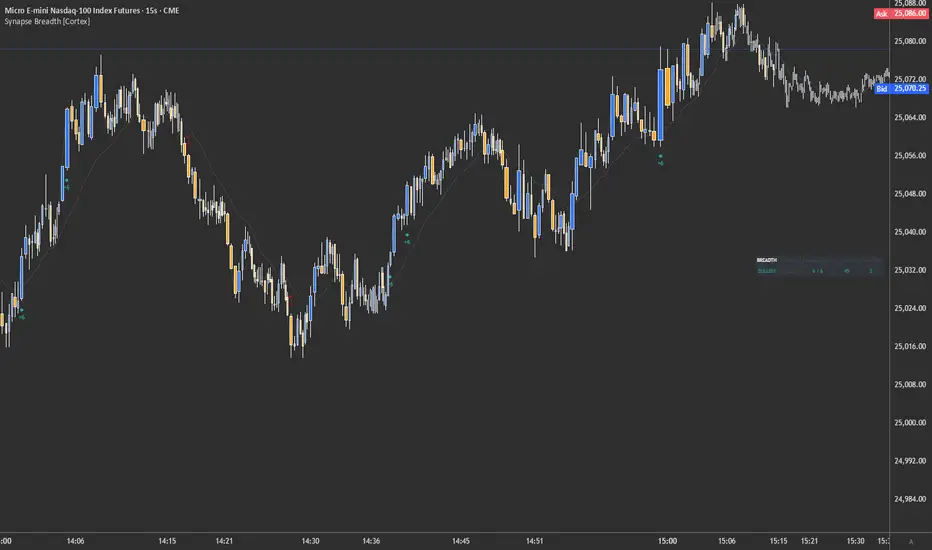
Synapse Node: Heavyweight BreadthOverview
The Synapse Node: Heavyweight Breadth is a sophisticated market sentiment engine designed for the Cortex Suite. It analyzes the "internals" of the NASDAQ-100 by tracking the real-time trend alignment of the six most influential heavyweights: AAPL, MSFT, NVDA, AMZN, META, and GOOGL. By combining equity breadth with institutional footprint data, it provides a high-conviction filter for intraday trading.
Core Features
1. Heavyweight Breadth Scoring (6-Factor)
The script monitors the six major stocks that dictate market direction.
The Score: Each stock contributes +1 (Bullish) or -1 (Bearish) based on its alignment with a 20-period EMA.
Aggregated Sentiment: This results in a score ranging from -6 to +6, representing the true internal strength of the market.
Institutional Alignment: Signals only fire when the breadth score meets a user-defined threshold and aligns with the institutional footprint.
2. Footprint Alpha (1-Second Precision)
Under the hood, the node processes 1-second footprint data to detect Delta Anomalies.
It tracks aggressive buying and selling pressure.
High-conviction signals require "Anomalous Delta" (Delta exceeding the Sigma threshold) to confirm that big money is participating in the breadth move.
3. Integrated HUD (Cortex Monochrome)
A sleek, non-intrusive Heads-Up Display (HUD) provides real-time data at a glance:
Breadth Bias: Instant visual confirmation of market direction.
Pulse Tier: A quantified weight (1-3) showing the current conviction level.
1S Delta: Real-time institutional volume flow tracking.
4. Synapse Matrix Bus (Protocol 200.PBCCC)
As a component of the Cortex Suite, this node outputs a specialized signal onto the Matrix Bus:
Pulse (P): 3.0 (Max 6/6 Breadth + Anomaly), 2.0 (Strong), 1.0 (Moderate).
Bias (B): Decoded as 1 (Bull) or 2 (Bear).
Confidence (C): A normalized percentage (up to 95%) based on the breadth consensus.
How to Use
The Lead Indicator: Use this node as your primary "Green Light" filter. Avoid longs when Breadth is negative, and avoid shorts when Breadth is positive.
Contextual Confluence: When the score hits +/- 6, it indicates a "Heavyweight Sweep," representing a high-probability institutional trend day.
Bridge Integration: When used with the execution bridge, this node prevents "fake-out" entries by ensuring the underlying market internals support the trade.
Settings
Breadth Threshold: Set the minimum number of stocks (e.g., 4 out of 6) required to fire a signal.
Footprint sigma: Adjust sensitivity to aggressive institutional volume.
Bridge Mode: Streamlines visuals for use in automated or semi-automated execution setups Gösterge

Gösterge
Gösterge

FundaMetrics Fundamentals v6FundaMetrics Fundamentals - View Fundamentals on a Single Pane with different scales!
FundaMetrics Fundamentals transforms raw SEC filings into a visual, scalable dashboard. By pulling deep-shelf corporate data directly onto your chart, it allows investors to bridge the gap between technical price action and fundamental reality. Whether you are a value investor looking for "cash-backed" safety or a growth trader monitoring revenue momentum, this script provides an institutional-grade toolkit for evaluating a company's true worth.
Data is available as soon as it drops into TV DB, then the script extracts and analyzes!
Give it a like if you like it!
📊 The Dynamic Scaling Matrix
The most powerful feature of FundaMetrics is the Output Scaling dropdown . It allows you to view the same financial data through four entirely different lenses:
⚖️ Per Share: Translates the balance sheet to a single share. If a stock is trading at $100 and your Cash Line is $20, you are effectively buying $20 of raw cash with your share.
📈 % of Market Cap: Shows what percentage of the company's total valuation is backed by a specific metric.
🎯 % of Revenue (Margin Analysis): Flattens Revenue to a 100% baseline. This turns your chart into a Margin Dashboard, showing how much cash is kept or debt is carried relative to every dollar of sales.
🔢 Actuals (M/B/T): Displays raw accounting numbers for verification and macro-scale analysis, such as in Millions, Billions or Mega company, Trillions!
🛡️ The Financial Pillars (The Lines)
🟠 Golden Line: Enterprise Value (The "True Price Tag")
While Market Cap only tells you what the stock market thinks the company's shares are worth, Enterprise Value tells you what it would actually cost to buy the entire business outright.
The Formula: Market Cap + Total Debt – Cash
The Logic: You pay the base price (Market Cap), inherit the baggage (Debt), and pocket the register (Cash).
Selecting the Scale
If set to " Actuals ": Shows the exact total cost to buy the company (e.g., Apple's E-Value hovers around $3 Trillion).
If set to " Per Share ": If a stock trades at $100 but "Per Share E-Value" is $150, the company carries heavy debt relative to its price.
If set to " % of Revenue ": Shows how expensive the company is vs. sales. At 500%, the company is valued at 5x annual revenue.
🟣 Purple Line: Liquidity (Short-Term Runway)
Liquidity measures a company's short-term financial runway. It tells you whether a company can pay its immediate bills without taking new loans or issuing stock.
The Formula: Total Current Assets – Accounts Payable
The Logic: Subtracting immediate bills from short-term assets gives you the raw liquid buffer.
Selecting the Scale
If set to " Actuals ": Shows the raw dollar amount of the company's short-term cushion.
If set to " Per Share ": Shows how much of your purchase price per share is backed by highly liquid capital.
If set to " % of Market Cap ": Shows what % of total valuation is backed by the safety net.
If set to " % of Revenue ": Shows the buffer relative to sales moving through the door.
🟢 Cash (The War Chest)
"Cash is King." This represents the absolute most liquid assets at a company's immediate disposal.
The Formula: Cash + Cash Equivalents (Option to include Short & Long-term investments
The Logic: A growing green line means a "fortress balance sheet" with dry powder for dividends, buybacks, or acquisitions.
Selecting the Scale
If set to " Actuals ": Shows the raw size of the bank account (e.g., Apple's ~$160B+ cash pile).
If set to " Per Share ": If the stock is $100 and Cash is $20, the actual business is only costing you $80.
If set to " % of Market Cap ": Shows how much of the price tag is backed by pure cash.
If set to " % of Revenue ": Shows how much cash the company hoards relative to the sales it brings in.
🔴 Debt (The Financial Weight)
Represents everything the company owes to outside parties.
The Formula: (Total Liabilities) × -1
The Logic: We multiply by -1 to force the red line below the zero line, creating a "visual mirror" against Cash.
Selecting the Scale
If set to " Actuals ": Shows the raw scale of total obligations.
If set to " Per Share ": Shows the amount of corporate baggage you inherit with every share you buy.
If set to " % of Market Cap ": A leverage ratio showing if the company owes more than it is worth.
If set to " % of Revenue ": Shows how suffocating the debt is relative to incoming sales.
🔵 Revenue (The Top Line Engine)
The total amount of money brought in before any expenses or taxes are paid.
The Logic: Management can't fake revenue growth. If this line goes up, customers are buying.
Selecting the Scale
If set to " Actuals ": Shows the sheer scale of the sales machine (e.g., Walmart's $600B+ annual sales).
If set to " Per Share ": Shows Revenue Per Share (RPS). Great for checking if a stock is overhyped vs. its sales.
If set to " % of Market Cap ": The inverse of the Price-to-Sales (P/S) ratio.
If set to " % of Revenue ": The line becomes a flat 100% baseline, turning the chart into a "Margin Dashboard."
🛠️ Additional Features
🟡 P/E Ratio: Dynamic valuation multiple that automatically annualizes quarterly earnings.
🔵 Earnings Anchor ("E"): Interactive dots. Hover to see the report date, Free Cash Flow, Dividends, and Working Capital in the tooltip
📋 Smart Matrix Legend: An auto-adjusting on-chart table that defines your current scaling and visibility settings.
🚫 Intraday Protection: Automatically hides on low timeframes to prevent data distortion.
📜 Credits & Disclaimer
Credits: Inspired by the foundational work of TradingView user 'sjakk'. It was old and incredibly slow so rewrote the entire thing from scratch!
Disclaimer: For educational purposes only. Not financial advice. We are not responsible for miscalculations or misguided numbers. By using this script, you agree to not hold BrightSlides LLC accountable for incorrect data. Do your own research. Gösterge

Gösterge

Liquidity Radar# Liquidity Radar
## Overview
Liquidity Radar is a Smart Money Concepts (SMC) indicator that visualizes where institutional liquidity rests in the market. It combines automatic market structure detection (BOS & CHoCH), a thermal liquidity heatmap, dynamic order blocks, and fair value gaps into a single, performance-optimized overlay.
**Free & Open Source** — no invite-only access, no paywall. Full source code, fully transparent.
## The Concept: Why Liquidity Matters
In institutional trading, **liquidity pools** form above swing highs and below swing lows — these are clusters of stop-loss orders from retail traders. Smart money targets these pools to fill large positions. Understanding where liquidity rests gives you an edge in anticipating price movements:
- **Swing High Liquidity** — Stop-losses from short sellers sit above swing highs
- **Swing Low Liquidity** — Stop-losses from long buyers sit below swing lows
- **Liquidity Sweeps** — When price takes out a swing level to grab these stops, it often reverses
The indicator automates the detection and visualization of these key levels.
## Core Features
### 1. Thermal Liquidity Heatmap
The signature feature. Liquidity zones appear at every confirmed swing high and swing low with a thermal color gradient:
- **Fresh zones** — Warm colors (orange/yellow) indicate high relevance
- **Aging zones** — Cool colors (purple/blue) indicate decreasing relevance as time passes
- **Volume-weighted intensity** — Zones formed on high-volume bars appear more intense
- **Auto-cleanup** — Zones fade out over a configurable decay period and are removed when price sweeps through them
### 2. Market Structure Detection (BOS & CHoCH)
Automatic swing high/low detection using pivot-based logic:
- **BOS (Break of Structure)** — Price breaks a prior swing level in the trend direction (continuation). Shown as dashed lines.
- **CHoCH (Change of Character)** — Price breaks a prior swing level against the trend (potential reversal). Shown as solid lines with thicker width.
- Color-coded: Cyan/Teal = bullish, Magenta/Pink = bearish
### 3. Dynamic Order Blocks
Institutional supply and demand zones rendered as semi-transparent boxes:
- **Bullish OB** — The last bearish candle before a strong bullish move (at swing lows)
- **Bearish OB** — The last bullish candle before a strong bearish move (at swing highs)
- Configurable mitigation threshold — controls how much price must penetrate the block before it is considered mitigated
- Auto-removed when price closes through the block
### 4. Fair Value Gaps (FVG)
Three-candle inefficiency detection:
- Bullish FVG: Gap between candle 1's low and candle 3's high
- Bearish FVG: Gap between candle 1's high and candle 3's low
- ATR-based noise filter removes insignificant gaps
- Auto-removed when price fills the gap
- Default: OFF (toggle on in settings)
### 5. Premium / Discount Zones
Based on the current swing range:
- **Premium Zone** (upper half) — Light red background
- **Discount Zone** (lower half) — Light green background
- **Equilibrium Line** (50%) — Dashed amber line
- Default: OFF (toggle on in settings)
## Dashboard
A compact, dark-themed info panel displaying:
- **Trend** — Current market direction (Bullish / Bearish / Neutral)
- **Structure** — Last detected structure signal (BOS or CHoCH)
- **Liq. Heat** — How many liquidity zones are near the current price (High / Medium / Low)
- **Volume** — Above or below 20-period average
- **Momentum** — RSI(14) status (Overbought / Neutral / Oversold)
- **Next Zone** — Nearest liquidity zone with price level and distance in percent
## Auto-Timeframe Adaptation
All parameters automatically adjust to your chart timeframe:
| Timeframe | Swing Lookback | Heatmap Decay |
|-----------|---------------|---------------|
| 1-5 min | 6 | 100 bars |
| 15 min | 10 | 80 bars |
| 30 min | 12 | 80 bars |
| 1 Hour | 15 | 60 bars |
| 4 Hour | 22 | 50 bars |
| Daily | 35 | 40 bars |
| Weekly+ | 50 | 30 bars |
You can switch to manual mode for full control.
## Alert Types (7)
1. Bullish BOS — Break of Structure confirmed (continuation up)
2. Bearish BOS — Break of Structure confirmed (continuation down)
3. Bullish CHoCH — Change of Character detected (potential reversal up)
4. Bearish CHoCH — Change of Character detected (potential reversal down)
5. Bullish Liquidity Sweep — Swing high liquidity taken
6. Bearish Liquidity Sweep — Swing low liquidity taken
7. Price Entering Order Block — Price enters a bullish or bearish OB zone
## Settings
**Market Structure:**
- Show BOS / CHoCH (on/off)
- Auto Swing Lookback (on/off)
- Manual Swing Lookback (3-100)
- BOS / CHoCH line styles and width
**Liquidity Heatmap:**
- Show Heatmap (on/off)
- Auto Decay Period (on/off)
- Manual Decay (10-500 bars)
- Zone Width (ATR multiplier)
- Volume-Weighted Intensity (on/off)
- Max Active Zones (4-20)
**Order Blocks:**
- Show Order Blocks (on/off)
- Max OBs per Side (1-6)
- Mitigation Threshold (0.0-1.0)
**Fair Value Gaps:**
- Show FVGs (on/off, default OFF)
- Min FVG Size (ATR multiplier)
- Max Active FVGs (2-15)
- FVG Extend (bars)
**Premium / Discount:**
- Show Zones (on/off, default OFF)
- Zone Transparency
**Dashboard:**
- Show Dashboard (on/off)
- Position (Top Right / Top Left / Bottom Right / Bottom Left)
- Size (Tiny / Small / Normal)
**Visual Settings:**
- All 5 colors fully customizable
- Watermark (on/off)
## Non-Repainting
All signals are calculated on confirmed (closed) bars only. Pivot detection inherently requires N bars of confirmation on each side. BOS/CHoCH signals fire on the bar where the break occurs, after the swing point is already confirmed. What you see is what happened — no hindsight bias.
## Works On
- Crypto (BTC, ETH, SOL, ...)
- Forex (EUR/USD, GBP/JPY, ...)
- Stocks (AAPL, TSLA, NVDA, ...)
- Futures & Indices (NQ, ES, SPX, ...)
- Any timeframe from 1 minute to Monthly
## Disclaimer
This indicator is for educational and informational purposes only. It does not constitute financial advice. Always do your own research and manage your risk. Past performance does not guarantee future results. Trading involves substantial risk of loss. Gösterge

Gösterge

Gösterge

Gösterge

Gösterge

Gösterge

Gösterge

Higher Timeframe Previous Candle LevelsWhat it does
This indicator draws the Open, High, Low, and Close levels of the most recently completed candle from a user-selected higher timeframe directly onto your current chart as horizontal reference lines. Each level is labeled with its name and exact price and optionally printed on the price scale for at-a-glance reference.
The key word is *completed* — it always references the previous fully closed candle on the chosen timeframe, never the still-forming one. This eliminates repainting and ensures the levels you see are historically locked.
How it works
The script uses `request.security()` with `open `, `high `, `low `, and `close ` on the selected higher timeframe, combined with `lookahead=barmerge.lookahead_off`. The ` ` offset targets the candle that has already closed (not the one currently forming), and disabling lookahead prevents any future data from leaking into historical bars. This is a non-repainting, structurally safe approach to multi-timeframe data retrieval.
The four price levels are rendered as persistent line and label objects that update only on the last bar of the chart (`barstate.islast`), keeping the drawing lightweight. Each level (High, Low, Open, Close) can be independently toggled, colored, and labeled.
Underlying concept
Higher-timeframe OHLC levels from the most recent closed candle act as intraday support, resistance, and directional bias markers. This is rooted in the institutional concept that completed macro candles define the structural "playing field" for price action on lower timeframes:
- The High and Low of the previous higher-timeframe candle define the range that was accepted by the market. A break above the high or below the low signals range expansion — a potential momentum move. Price remaining inside signals consolidation or rotation.
- The Open represents where institutional positioning began for that macro period. Price trading above the open suggests bullish control since the session/period started; below it, bearish.
- The Close reflects where the market settled in it, is the consensus price at the end of that macro period. Comparing current price to the previous close gives a quick read on whether the market is continuing or reversing relative to the last macro decision.
Together, these four levels create a structural framework: they tell you where the boundaries are, who was in control, and where the market agreed to settle. Watching how price reacts at these levels on lower timeframes — whether it respects, rejects, or breaks through them — provides high-probability context for entries, exits, and bias direction.
How to use it
1. Set the "Macro Timeframe" to the higher timeframe you want to reference (e.g., 4H while trading on 15m or 5m charts; Daily while trading on 1H; Weekly while swing trading on 4H).
2. The indicator immediately draws the previous completed candle's OHLC as horizontal lines.
3. Use the High and Low as potential breakout/breakdown or rejection zones. If price approaches the previous 4H high and stalls, that's a potential short-term reversal. If it drives through with volume, that's range expansion.
4. Use the Open as a directional bias filter. If you're scalping the 5-minute chart and price is above the previous 4H open, favor long setups. Below it, favor shorts.
5. Use the Close as a gauge of continuation vs. reversal. If the market opens a new macro candle and immediately moves away from the previous close, that's a sign of fresh directional intent.
6. Toggle individual levels on/off depending on your strategy. Some traders only need the High/Low range; others want the full OHLC picture.
What makes it original
Unlike multi-timeframe indicators that draw entire candles, session boxes, or pivot systems, this script focuses exclusively on the single most recently completed higher-timeframe candle — the one that has the most immediate relevance to current price action. It gives that single candle full visual treatment with individually customizable lines (style, thickness, color), independently togglable OHLC levels, freely positionable labels (left or right side, adjustable offset), and optional price-scale display. The emphasis is on clean, distraction-free, single-candle structural context rather than cluttering the chart with historical multi-timeframe data.
It is fully non-repainting by design — the combination of ` ` offset and `lookahead_off` ensures no future data influences the displayed levels.
Suitable markets and trading styles
This indicator works on any market — forex, crypto, equities, indices, commodities, futures — anywhere that higher-timeframe structure provides meaningful context for lower-timeframe execution.
It is particularly suited for:
- Intraday scalping (1m–5m charts referencing 1H or 4H completed candles) — using the macro OHLC as scalp entry/exit boundaries and directional filters.
- Intraday momentum/breakout trading** (5m–15m charts referencing 4H or Daily candles) — watching for High/Low breaks as range expansion triggers.
- Swing trading (1H–4H charts referencing Daily or Weekly candles) — using macro close-to-close behavior and high/low range context for position bias.
It is not designed for long-term investing or position trading where single-candle reference levels lose relevance over multi-week or multi-month holding periods.
Disclaimer
This indicator is a visualization tool for higher-timeframe structural context. It does not generate buy or sell signals and should not be used as a standalone trading system. Always use it in conjunction with your own analysis, risk management, and trading plan. Past price structure does not guarantee future price behavior. Trading involves significant risk of loss.
Gösterge

Strateji

Gösterge

Gösterge
Gösterge

Gösterge