SEDAT XI Crypto AI BIAS ENGINE-iphone v2.0 ** ⚡SEDAT XI Crypto AI BIAS ENGINE⚡
The **SEDAT XI Crypto AI BIAS ENGINE** is a multi-asset cryptocurrency dashboard designed to help traders quickly identify where momentum, trend, and participation are aligning across the market.
Rather than focusing on a single chart, the dashboard continuously scans major cryptocurrencies and summarizes the information into an easy-to-read institutional-style interface. It combines trend analysis, breakout detection, momentum, volume activity, and RSI into one compact view, making it easier to prioritize the strongest opportunities.
### Features
• Multi-asset crypto scanner (BTC, ETH, SOL, ADA, XRP, SHIB)
• AI-style bias engine with Bullish, Bearish, Strong Trend, and Breakout detection
• Institutional volume activity meter
• Momentum score with color-coded strength
• RSI momentum confirmation
• Live current price display
• Final trade bias summary
• Mobile-friendly dashboard mode
• Adjustable dashboard size and screen placement
The goal is simple: reduce chart clutter and provide a fast market overview so traders can spend less time searching and more time focusing on high-quality setups.
This indicator is designed for educational and informational purposes. It does not predict future price movements or guarantee profitable trades. Always combine its signals with sound risk management and your own market analysis.
Thank you for checking out **SΞDAT XI Crypto AI BIAS ENGINE**. I hope it becomes a valuable part of your trading workflow. Feedback and constructive suggestions are always welcome as the project continues to evolve.
Gösterge

Trend Health [FEELS]A trend rarely dies suddenly. It fades first: the move gets inefficient and counter-trend candles grow heavier. Trend Health paints that fading straight onto a supertrend-style ATR trail, and tightens the stop while it happens.
The band is saturated green or red while the trend is strong. As health decays the color drains toward amber, an amber dot prints where the dying starts, and the trail contracts under price so a weak trend exits earlier than a fixed stop would.
QUICK START
Add it to a chart and read the color. Bright band: trend intact, trail at full width. Fading band: trend losing quality, stop contracting. Amber band: dying trend, elevated flip risk. Scroll the history: most flips carry an amber warning dot some bars before them. The strip along the bottom compresses the full health history into one regime line, and the label at the right edge shows direction, state and the current health score.
HOW IT WORKS
Two layers: a health score, and a trail that consumes it.
Health score, computed every bar over the Health lookback window:
1. Directional efficiency. Kaufman efficiency ratio (net move divided by the sum of absolute bar-to-bar moves), zeroed when the net move points against the active trend, normalized so a reading of 0.5 counts as fully efficient.
2. Momentum side. RSI distance from the 50 line in the direction of the trend, scaled over 25 points.
3. Impulse asymmetry. Candle bodies printed with the trend versus against it over the window. When counter-trend bodies grow, this component decays before price structure breaks.
These three form the core score (weights 0.45 / 0.30 / 0.25). The displayed health adds a fourth read, the distance between price and the trail in ATR units, at 25 percent weight. The score is EMA-smoothed and resets on every flip.
The trail is a ratchet ATR stop built from scratch. Base width is ATR times the multiplier. With Adaptive tightening on, the effective multiplier is scaled by the core score, so a healthy trend trails at full width while a dying trend gets a progressively tighter stop. The distance component is excluded from the core on purpose, otherwise tightening would lower the score and tighten further in a loop. Toggle it off and you get a classic fixed-width trail; the health engine then only drives the color.
HOW TO USE
- Color is the instruction. Enter or hold on a saturated band, tighten manually or stand aside on amber.
- The dying alert fires when health crosses under the threshold while the trend is still running. On past data many flips were preceded by exactly this transition. Treat it as a condition read, not a forecast.
- Four alerts: flip up, flip down, trend dying, trend recovered.
- Designed on 4H to 1W. Works on any symbol and timeframe; on low timeframes expect more flips, especially in ranges with adaptive mode on.
PARAMETERS
- ATR length / ATR multiplier: trail geometry at full health.
- Adaptive tightening: health-driven contraction of the trail, on by default.
- Health lookback: window for the efficiency, momentum and asymmetry reads.
- Health smoothing: EMA on the raw score.
- Dying threshold: below this level the trend counts as dying; drives the amber floor, the warning dot, the label and the alert.
- Display toggles: trend fill, bar coloring, flip markers, dying warnings, health ribbon, status label.
- Sizing: marker size, label size and trail width are adjustable.
NOTES
- The trail state confirms at bar close. On the live bar the level and color can update until close.
- Health describes the present condition of the trend. It does not predict future prices.
- A dying warning is a condition mark, not an exit signal: health can recover and the trend can resume. Sharp reversals can flip a trend straight from high health without any warning printed.
- Adaptive mode trades later giveback for earlier exits, so in choppy ranges it flips more often than a fixed trail. That is the design, not a defect.
ORIGINALITY
The ratchet ATR trail is a classic public-domain concept reimplemented from scratch. What is original here is the three-component health model, the gradient mapping of that score onto the trail, bars and ribbon, and the feedback of the score into the stop width itself, which makes the flip points measurably different from a standard fixed-factor trail. RSI and the efficiency ratio are not displayed as separate indicators; they exist only as inputs to one scoring model. This is a single system, not a mashup. Gösterge

Gösterge

Participation-Adjusted Momentum [TradeDots]Participation-Adjusted Momentum
Summary
This indicator computes a momentum oscillator that has been adjusted by participation quality . Raw momentum (standardized rate-of-change) is multiplied by a quality blend derived from volume percentile, close-location alignment within the bar, and range-per-volume efficiency. The intent is to differentiate strong momentum supported by participation from moves that look impressive on price alone but occur on thin volume or wide ranges with little net travel. The histogram is colored by one of five interpretable states (Strong Bull, Strong Bear, Thin, Quiet Accumulation, Noisy) so users see at a glance whether to trust a momentum reading.
What is original here
Momentum oscillators (rate-of-change, MACD, RSI) and volume oscillators (volume percentile, MFI) are widely available. This script's contribution is the deliberate combination into a single adjusted reading, plus the five-state classification that maps raw-momentum / participation combinations to labelled regimes. The "Quiet Accumulation" state (low momentum but rising volume percentile) and the "Thin" state (strong momentum but low participation) are specifically called out because they are the most actionable readings — both indicate that the price reading and the order-flow reading disagree, and that disagreement deserves a label.
How it works
Each bar, the following quantities are computed.
Raw momentum. Rate-of-change of close over a configurable length, then z-scored (subtract the mean, divide by the standard deviation) over the normalization lookback. The result is approximately bounded but can exceed plus or minus 3 in extreme moves.
EMA slope. A 50-period EMA's change over a configurable lookback, min-max normalized to 0-100. Used as a secondary directional bias (computed and exposed as a hidden plot, but not directly added to the displayed oscillator).
Volume percentile. Volume rank over the normalization lookback (typically 100 bars).
Close-location value. Where the close sits within the bar's high-low range, expressed as a percentage. For an upward-direction reading, a close near the bar's high indicates buyers won the bar; for a downward-direction reading, a close near the bar's low indicates sellers won.
Participation. Volume percentile (divided by 100) multiplied by direction-aligned close-location value (also normalized to 0-1). Result is in ; higher means "good participation".
Range per volume. Bar range divided by volume. High range per volume means a wide candle moved on thin flow — typical of news spikes, illiquid prints, or false moves. The percentile rank of range-per-volume is inverted (low range-per-volume gives a high "efficiency score") and used as a quality factor.
Quality blend. A weighted combination: 0.4 * participation + 0.4 * range_efficiency + 0.2. The +0.2 floor ensures that even with zero participation and zero efficiency, the adjusted momentum retains 20% of the raw signal so the oscillator does not flatline completely.
Adjusted momentum = raw momentum × quality blend.
State classification (mutually exclusive):
Strong Bull : raw momentum at or above +threshold and participation at or above 0.55
Strong Bear : raw momentum at or below −threshold and participation at or above 0.55
Thin : absolute raw momentum at or above threshold and participation below 0.35 — momentum without volume, a warning state
Quiet Accumulation : absolute raw momentum below the quiet threshold and volume percentile above the quiet-volume floor — flat price but rising participation
Noisy / Low Quality : the catch-all when none of the above apply
The histogram bar color reflects the current state.
Repainting and data integrity
All factors are computed on confirmed bar values; alerts are gated by barstate.isconfirmed. No request.security() calls are made — the script operates entirely on the chart timeframe.
How to read the chart
The primary plot is the adjusted-momentum histogram, colored by state.
A thin overlay line shows the same value with continuous color for easy zero-line reading.
Reference lines at zero and at ±1 standard deviation provide context for how extreme the current reading is.
Hidden plots expose raw momentum, participation, volume percentile, and direction so they are available in the Data Window.
The dashboard panel shows the current state in the header, then numeric readings for raw momentum (in z-units), adjusted momentum, volume percentile, participation, range efficiency, and the quality blend.
Inputs
Inputs are grouped into three sections.
Core Settings : ROC length, percentile / z-score lookback, EMA slope length, slope lookback bars, strong-momentum z-threshold, quiet-accumulation maximum z, quiet-accumulation minimum volume percentile.
Visual Settings : zero-line toggle, ±1σ band toggle, dashboard toggle, panel position and size, panel background color.
Any Alert() function call conditions : per-alert toggles.
Alerts
Four alert conditions are provided, each firing on the first bar the state is entered:
Strong Bull Momentum
Strong Bear Momentum
Quiet Accumulation Detected
Momentum Without Volume (the "Thin" warning state)
Each is declared via alertcondition() and is fired programmatically through alert() when the corresponding input toggle is enabled, with alert.freq_once_per_bar_close. Alert messages include {{ticker}} and {{interval}} placeholders.
How to use this script
This is a confirmation indicator. It does not generate entries on its own.
When considering an entry on price strength alone, check this indicator. A Strong Bull or Strong Bear state confirms that volume and close location support the move.
The "Thin" state is a warning. A breakout that prints during a Thin reading should be treated more cautiously than the same breakout during Strong Bull.
The Quiet Accumulation state can identify periods of base-building before a move and is useful as a "watchlist" signal.
Use alongside a setup-specific indicator for entry timing.
Limitations and honest caveats
Volume quality varies dramatically between markets. On crypto exchanges, wash-trading and bot-driven order flow can produce misleading volume percentile readings. Apply with awareness.
Z-score normalization requires the lookback to contain a representative variety of states. On instruments with strong regime changes, early-bar z-scores may be unreliable until the lookback fills.
The close-location alignment factor reads single-bar close behavior. On gappy markets or after market closes, the alignment may not reflect intraday order flow.
The script does not signal direction independently; it adjusts and labels momentum that is already present.
The +0.2 floor in the quality blend is a design choice to avoid flat-lining the oscillator. Users who want a strict "zero adjustment when participation is zero" reading can set the participation weights higher and adjust the floor by modifying the source code.
Disclaimer
This script is published for informational and educational purposes. It is not investment advice and is not a recommendation to buy or sell any instrument. Adjusted momentum is a descriptive measure, not a prediction of future price. Users are solely responsible for their own trading decisions and risk management.
Gösterge

Multi-Indicator Confluence Strategy Automator [MarkitTick]💡 A comprehensive, multi-dimensional technical analysis suite engineered to evaluate market conditions through a rigorous synthesis of trend, momentum, volatility, and cross-asset correlation metrics. Designed for traders who require a systematic approach to market entry and risk management, this script aggregates signals from multiple proven indicators and applies advanced statistical filters to minimize false positives. By unifying foundational technical analysis with advanced mathematical concepts like the Hurst exponent and momentum inflation, this tool provides a highly objective, data-driven environment for evaluating market structure and defining structured trade parameters.
✨ Originality and Utility
Standard trading methodologies often rely on isolated indicators, which can lead to high failure rates in dynamic market environments. The originality of this script lies in its robust confluence engine, which demands simultaneous alignment across multiple independent market dimensions before generating a signal.
Instead of merely stacking moving averages, this suite integrates a strict Boolean gating system that evaluates:
A primary directional baseline derived from a Hull Moving Average combined with an Average True Range volatility buffer.
A directional movement and momentum confirmation matrix utilizing the Average Directional Index and Commodity Channel Index.
Dynamic volume filtering to ensure market participation supports the price action.
Advanced statistical gating mechanisms, including confluence decay, regime detection, and cross-asset correlation analysis.
This utility is exceptionally valuable for systematic traders, as it translates complex, multidimensional market data into a highly legible, unified dashboard while automatically projecting risk-adjusted stop-loss and take-profit levels dynamically based on current market volatility.
🔬 Methodology and Concepts
● The Confluence Engine
The core of this strategy revolves around a scoring system that evaluates bullish or bearish alignment. A valid signal requires a minimum confluence score, calculated by assessing the following core components:
• Baseline Trend
The script utilizes a Hull Moving Average to determine the primary market bias. To eliminate noise, a volatility buffer equivalent to a fraction of the Average True Range is applied, ensuring that only definitive breakouts beyond the baseline are considered valid directional shifts.
• Directional Movement (ADX/DMI)
The first confirmation layer relies on the Average Directional Index alongside the Directional Movement Indicators. A trend is only considered active if the ADX exceeds a user-defined threshold, and the relationship between the positive and negative directional indicators defines the bias.
• Momentum Oscillators (CCI)
The second confirmation layer employs the Commodity Channel Index to measure the current price level relative to an average price level over a given period. Bullish or bearish confirmation requires the CCI to pierce specific upper or lower thresholds.
• Volume Validation
A volume filter ensures that signals are backed by significant market interest. The current period's volume must exceed a rolling exponential moving average of historical volume, multiplied by a strict sensitivity factor.
• Advanced Gating Filters
Confluence Decay: A time-based penalty system that degrades the value of a signal if the confluence state persists for too long without triggering an entry, preventing late entries into exhausted trends.
Hurst Regime Detector: Classifies the market as trending or mean-reverting, gating signals that conflict with the overarching statistical regime.
Momentum Inflation Ratio: Normalizes current price velocity against historical volatility to detect and filter out exhaustion spikes.
Cross-Asset Lead-Lag: Computes the Pearson correlation against a secondary asset to confirm macroeconomic or sector-wide alignment before entry.
🎨 Visual Guide
The script employs a highly intuitive visual hierarchy designed to keep the chart clean while providing maximum data density.
● Chart Elements
• Heatmap Candles
The standard price candles are color-coded based on the baseline trend state. Bullish bars are colored a vibrant teal, bearish bars are marked in a distinct red, and neutral states default to a muted slate blue. This visual heuristic allows traders to instantly recognize the dominant market regime without processing raw numerical data.
• Signal Markers
When all confluence conditions and advanced gates are met, the script plots distinct entry markers: small upward-pointing triangles below the bar for long signals, and downward-pointing triangles above the bar for short signals.
• Risk Management Levels
Upon a confirmed signal, the script dynamically draws horizontal lines representing the trade parameters:
Entry Line: A dashed, neutral-colored line projecting the exact trigger price.
Stop Loss (SL): A dashed, red line projected against the trend based on a multiple of the Average True Range.
Take Profit (TP1, TP2, TP3): Three dotted, green lines representing scaled exit targets, dynamically calculated using expanding volatility multiples.
Each line is accompanied by a precise price label anchored to the right side of the chart.
● The Information Dashboard
A comprehensive table is anchored to the top right of the screen. It displays the real-time status of the Baseline, Confirm 1, Confirm 2, Volume, Exit status, and the aggregate Score. Furthermore, it outputs the exact values for ADX, ATR, Decay Age, Hurst Exponent, Momentum Inflation, Baseline Distance-Integral, and Lead-Lag Correlation, using a color-coded text system (Green for bullish/favorable, Red for bearish/unfavorable, Yellow for warnings).
📌 Note : the best way to resolve visual overlap is to navigate to the Object Tree and drag the indicator above the main chart layer, or simply hide the native candles in your chart settings.
📖 How to Use
● Interpreting Signals
Traders should monitor the chart for the appearance of the signal triangles. Because the script utilizes a strict minimum gap requirement between signals, traders will not be overwhelmed by repetitive alerts during a sustained trend.
● Executing Trades
Once a signal appears, the script automatically projects the optimal Entry, Stop Loss, and three Take Profit levels on the chart. Traders can use these exact price labels to populate their exchange order tickets or algorithmic routing software.
● Managing Positions
The built-in Exit Indicator, driven by a faster CCI calculation, will trigger an alert when counter-trend momentum builds, providing an objective reason to manually close or trail stops on an active position before the hard stop loss is hit.
● Dashboard Monitoring
Use the dashboard table to gauge the overall health of the trend. If the Confluence Score drops or the Confluence Decay percentage reaches high levels, it is highly advisable to tighten stops on existing positions, as the mathematical probability of trend continuation has diminished.
⚙️ Inputs and Settings
● Core Indicator Tuning
Baseline HMA Length: Adjusts the sensitivity of the primary trend filter.
ADX/DMI Length & Threshold: Defines how strong a trend must be to pass the first confirmation gate.
CCI Length & Threshold: Sets the momentum required for the second confirmation gate.
Volume RMA Length & Multiplier: Configures the strictness of the volume participation filter.
● Risk Parameters
ATR Length: The lookback period for volatility measurement.
SL ATR Mult: The multiplier applied to the ATR to define the stop-loss distance.
TP1, TP2, TP3 ATR Mult: The multipliers defining the three scale-out profit targets.
● Advanced Filter Settings
Confluence Decay: Toggles the time penalty system and defines the maximum bars before full decay.
Hurst Regime Detector: Toggles regime filtering and sets the threshold for trending vs. mean-reverting environments.
Momentum Inflation Ratio: Toggles velocity normalization and sets the threshold ratio for exhaustion alerts.
Cross-Asset Lead-Lag: Defines the correlation ticker, correlation lookback window, and minimum Pearson threshold.
🔍 Deconstruction of the Underlying Scientific and Academic Framework
● Rescaled Range Analysis and the Hurst Exponent
This script integrates a specialized implementation of the Hurst Exponent, a statistical measure originally developed in hydrology, to classify financial time series data. It calculates the cumulative deviation of the asset's price from its Simple Moving Average over a defined rolling window. By identifying the maximum and minimum cumulative deviations, the script establishes the range, which is then normalized against the standard deviation of the price series to compute the rescaled range ratio. The final Hurst value is derived logarithmically. A value significantly greater than 0.5 mathematically confirms a persistent, trending regime, while a value below 0.5 indicates an anti-persistent, mean-reverting environment.
● Momentum Inflation via Volatility Normalization
The script tackles the academic problem of momentum illusion, where sheer point movement is mistaken for structural momentum, by normalizing absolute price speed against the Average True Range. It then compares this normalized current velocity against a rolling historical average of normalized velocity. If the resulting ratio exceeds the user-defined threshold, the script identifies the movement as mathematically over-extended, gating further entries to prevent buying the top or selling the bottom of a volatility spike.
● Cross-Asset Correlation Dynamics
To account for macroeconomic interconnectedness, the script employs a rolling Pearson correlation coefficient between the primary asset and a defined leading indicator. By analyzing the covariance of the two assets relative to the product of their standard deviations over a specific window, it mathematically verifies if the broader sector or macroeconomic environment supports the localized signal.
● Distance-Integral Calculations
The Baseline Distance-Integral utilizes a rolling mathematical sum of the spatial delta between the closing price and the moving average. This integral provides a quantifiable area-under-the-curve measurement, offering deeper insight into the cumulative kinetic energy of a trend rather than relying solely on point-in-time cross signals.
⚠️ Disclaimer
All provided scripts and indicators are strictly for educational exploration and must not be interpreted as financial advice or a recommendation to execute trades. We expressly disclaim all liability for any financial losses or damages that may result, directly or indirectly, from the reliance on or application of these tools. Market participation carries inherent risk where past performance never guarantees future returns, leaving all investment decisions and due diligence solely at your own discretion. Gösterge

Gösterge

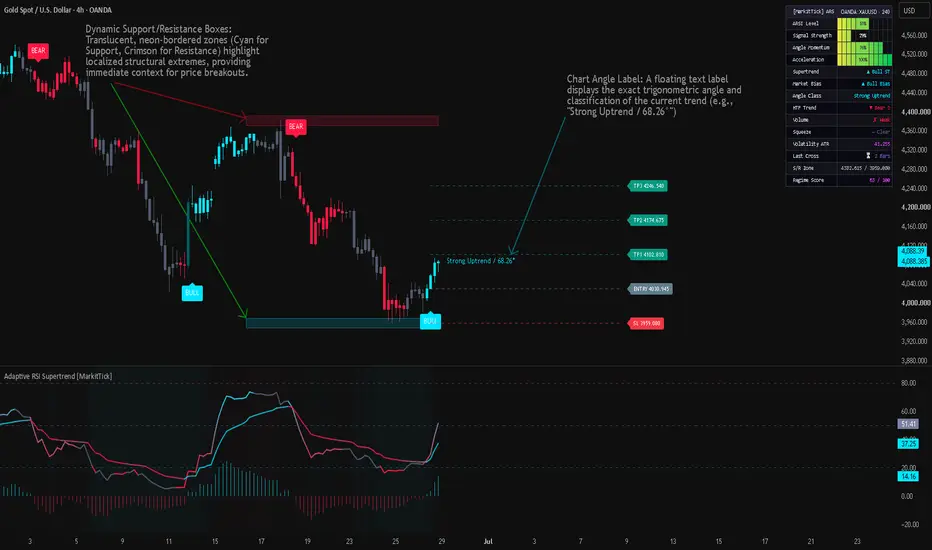
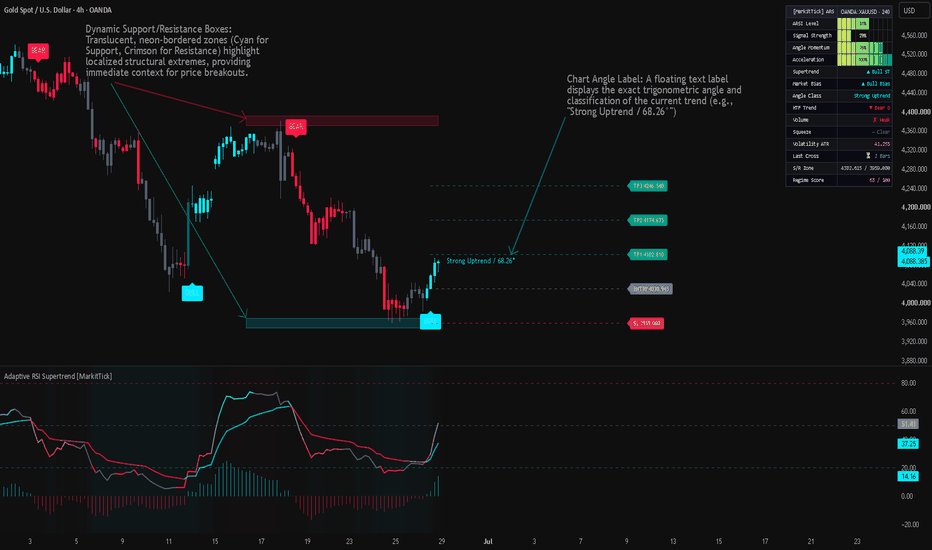
Adaptive RSI Supertrend [MarkitTick]💡 A highly advanced, multi-dimensional momentum and volatility tracking ecosystem designed for professional market analysis. Rather than relying on traditional price-based trailing stops, this indicator projects a volatility-banded Supertrend directly onto an Adaptive Relative Strength Index (ARSI). This creates an incredibly responsive momentum oscillator that dynamically adjusts its own thresholds based on underlying market kinematics. By integrating high-order digital signal processing filters, higher timeframe confirmations, and volume-weighted validation, this tool provides a comprehensive, terminal-style perspective on market regime, momentum acceleration, and localized price extremes without succumbing to the noise typical of standard oscillators.
✨ Originality and Utility
The standard Relative Strength Index is frequently plagued by false signals, erratic whipsaws during consolidation, and a failure to contextualize momentum within broader structural trends. This script resolves these systemic inefficiencies through a deliberate and mathematically sound synthesis of disparate analytical domains. The combination of an ARSI with a localized Supertrend is not an arbitrary pairing; it solves the problem of static overbought/oversold boundaries. By mapping average true range (ATR) bands onto the RSI itself, the indicator creates dynamic, breathing support and resistance levels for momentum. Furthermore, the integration of advanced smoothing algorithms (Kalman and LLAMA) strips out high-frequency noise, ensuring that crossovers between the ARSI and the Supertrend-derived Merged Line represent statistically significant momentum shifts rather than fleeting market anomalies. This unified framework replaces the need for an overlapping array of disparate indicators, offering a singular, high-contrast dashboard for absolute market clarity.
🔬 Methodology and Concepts
The internal architecture of this tool is built upon several synchronized analytical layers, heavily optimized to protect the integrity of the underlying logic while delivering seamless visual output.
● Adaptive Momentum Core
At the heart of the script is the ARSI, which abandons traditional static lookbacks in favor of a responsive differential tracking model. It evaluates the absolute range of price action against directional movement, feeding these differences through a recursive smoothing engine. This results in an oscillator that remains highly sensitive to genuine trend initiation while heavily penalizing sideways chop.
● Digital Signal Processing (DSP) Filters
The raw momentum data is processed through user-selectable DSP algorithms to extract the true signal from market noise. The Kalman Filter dynamically estimates the true state of momentum by balancing process noise against measurement noise, adapting instantly to volatility spikes. Alternatively, the LLAMA filter applies an efficiency-ratio-driven alpha scaling model, tightening its smoothing factor during periods of low efficiency and relaxing it during strong directional bursts.
● Oscillator-Bound Supertrend
Instead of applying a Supertrend to price, the script calculates a specialized ATR based on the frame-to-frame variance of the ARSI. It then projects upper and lower deviation bands around the ARSI, maintaining a directional bias based on trailing breakouts. The resulting baseline is then averaged with the DSP-filtered signal to create the "Merged Line," serving as the ultimate zero-lag trailing threshold for momentum.
● Multi-Factor Regime Scoring
The script continuously evaluates the broader market context by scoring four distinct components: the absolute level of the ARSI, the trigonometric angle of the ARSI trajectory, the state of the oscillator Supertrend, and the relationship of price to a macroeconomic baseline moving average. These factors are normalized and aggregated into a 0-100 Regime Score, offering a unified metric of trend health.
🎨 Visual Guide
The visual presentation is engineered for high-contrast, dark-mode optimized aesthetics, providing immediate, terminal-style data processing without chart clutter.
● Chart Elements
Color-Matched Candles: Price candles are painted based on the kinetic relationship between the ARSI and its signal line. Neon Cyan indicates strong bullish momentum, Dark Teal indicates weak bullish momentum, Deep Crimson indicates strong bearish momentum, and Maroon denotes weak bearish pressure. Slate Gray represents a neutral momentum state.
Dynamic Support/Resistance Boxes: Translucent, neon-bordered zones (Cyan for Support, Crimson for Resistance) highlight localized structural extremes, providing immediate context for price breakouts.
Trade Projection Labels: When crossover signals fire, dashed projection lines emerge, extending forward to display precisely calculated Entry (Slate), Stop Loss (Crimson), and multi-tiered Take Profit (Neon Green) levels based on dynamic risk-to-reward parameters.
Chart Angle Label: A floating text label displays the exact trigonometric angle and classification of the current trend (e.g., "Strong Uptrend / 45.2°").
● Oscillator Pane Elements
Adaptive RSI Line: Plotted with a dynamic gradient that transitions from Deep Crimson (extreme weakness) to Neon Cyan (extreme strength), instantly conveying momentum depth.
Merged Signal Line: A distinct Neon Purple to Deep Pink gradient line acting as the trailing support/resistance for the ARSI.
Divergence Histogram: Translucent Cyan and Red histogram bars plot the delta between the ARSI and the Merged Line, visualizing the acceleration or deceleration of momentum crosses.
Background Shading: The oscillator pane background shifts to a deep blue/purple tone during overbought (above 80) and oversold (below 20) extremes. A striking Electric Gold background illuminates periods where momentum enters a highly compressed "Squeeze" state.
Signal Markers: Crisp "BULL" (Cyan) and "BEAR" (Red) text labels appear on the oscillator when fully validated crossovers occur.
● The Analytics Dashboard
A fixed, dark-background HUD presents granular telemetry using segmented block bars and color-coded text for rapid scannability:
ARSI Level: Percentage reading of the current momentum state.
Signal Strength: Block visualization of the DSP-filtered baseline.
Angle Momentum & Acceleration: Metrics tracking the velocity and delta-velocity of the trend trajectory.
Supertrend & Market Bias: Text readouts indicating the dominant structural direction.
HTF Trend & Volume: Validation checks displaying the alignment of higher timeframes and localized volume surges.
Volatility ATR & Last Cross: Precise numerical readouts of market expansion and the duration since the last major signal.
Regime Score: The composite 0-100 metric, color-coded from Crimson (Bear) to Neon Magenta (Transition) to Cyan (Bull).
📖 How to Use
Identify Momentum Regime: Monitor the Dashboard's Regime Score. A score above 70 combined with a Neon Cyan ARSI line indicates an environment where long positions are statistically favored.
Trade the Crossover: Wait for the ARSI to cross the Merged Line. Validated crosses will generate a distinct "BULL" or "BEAR" label. Check the Dashboard to ensure the Volume Filter and HTF Trend are aligned (marked with a green checkmark).
Navigate Squeezes: When the oscillator background turns Electric Gold, the market is experiencing a severe volatility contraction. Avoid initiating new positions during the squeeze. Wait for the background color to clear, accompanied by an Alert indicating a Squeeze Breakout, before trading the subsequent expansion.
Manage Risk via Trade Labels: Upon a valid signal, utilize the automatically projected Entry, SL, and TP lines on the main chart to structure your position sizing according to the script's ATR-derived risk mechanics.
⚙️ Inputs and Settings
ARSI & Signal Lengths: Controls the primary lookback periods for the oscillator and its baseline.
Signal Filter Type: Select between RMA, Kalman Filter, or LLAMA to dictate the specific mathematical model used for noise reduction.
Supertrend ATR Length & Factor: Adjusts the sensitivity and width of the volatility bands applied to the oscillator.
Volume Filter Multiplier: Determines the threshold required for volume validation (e.g., 1.5 requires volume to be 50% above its moving average).
HTF Timeframe: Defines the higher timeframe used for macro-trend alignment (defaults to Daily).
Squeeze Angle Threshold: The maximum absolute angle permitted to trigger a volatility contraction state.
Trade Labels (Risk:Reward): Allows fine-tuning of the Stop Loss padding and the precise ratios for TP1, TP2, and TP3 targets.
🔍 Deconstruction of the Underlying Scientific and Academic Framework
This indicator relies on a robust foundation of applied mathematics and digital signal processing. The core methodology employs non-linear dynamic state estimation. Unlike standard moving averages that suffer from inherent group delay, the integration of algorithms akin to the Kalman filter allows the script to recursively project the next state of momentum and update that projection based on incoming price data. This minimizes lag while aggressively smoothing standard deviation anomalies.
Furthermore, the application of volatility banding (ATR) directly to an bounded oscillator (RSI) represents a shift from price-domain analysis to momentum-domain analysis. By calculating the variance of the momentum itself, the script acknowledges that momentum has its own distinct volatility profile, independent of price action. The kinematics of the trend are evaluated using trigonometric functions to derive the slope (velocity) and the rate of change of the slope (acceleration). This multidimensional approach ensures that signals are not generated merely by price crossing a threshold, but by a mathematically validated shift in the kinetic energy of the market.
⚠️ Disclaimer
All provided scripts and indicators are strictly for educational exploration and must not be interpreted as financial advice or a recommendation to execute trades. We expressly disclaim all liability for any financial losses or damages that may result, directly or indirectly, from the reliance on or application of these tools. Market participation carries inherent risk where past performance never guarantees future returns, leaving all investment decisions and due diligence solely at your own discretion. Gösterge
Gösterge

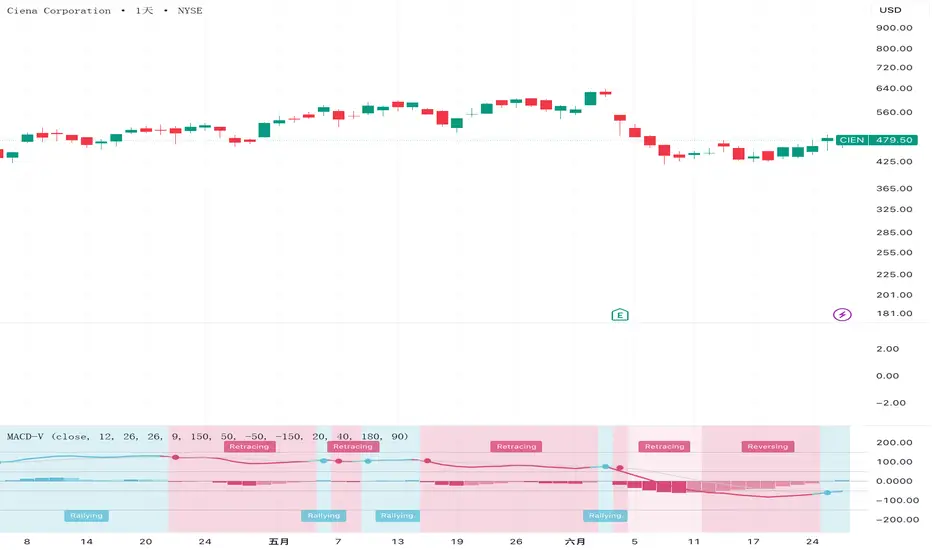
MACD-V (Volatility-Normalised Momentum)A faithful implementation of MACD-V, the volatility-normalised momentum indicator introduced by Alex Spiroglou in his Charles Dow Award–winning paper (CMT Association, 2022; SSRN 4099617).
Classic MACD has a structural flaw: because it is the raw difference of two price EMAs, its values are tied to the price scale, so the same reading means different things on different symbols and in different volatility regimes — and a level that signals "overbought" on one chart is meaningless on another. MACD-V fixes this by dividing the MACD line by ATR:
MACD-V = × 100
Normalising by volatility makes the output comparable across instruments and across time. The same threshold levels then carry the same meaning everywhere, which is what makes a fixed "momentum lifecycle" map possible.
Momentum lifecycle
The MACD-V line is read against fixed levels rather than just its sign. Spiroglou's roadmap uses +150 / +50 / −50 / −100 / −150 to divide momentum into stages — overbought, rallying, rebounding, retracing, pullback, declining, oversold. Strong trends live above +150 (the line is unbounded, so it can reach 200+); pullbacks in an uptrend often hold near −100. The histogram (MACD-V minus its signal line) has its own ±40 extremes on a separate, smaller scale.
What this implementation adds (all optional)
A label is printed whenever the line moves into a new lifecycle stage, so the transitions are visible without reading levels off the axis.
Optional background shading collapses the seven stages into three momentum bands using the study's neutral zone — up above +50, ranging within ±50, down below −50 — so a label can read "Rebounding" while the background stays neutral.
A four-colour histogram coloured by both sign and slope, so a fading move is visible before it flips sign.
Dots at MACD-V / signal-line crosses.
The two threshold ranges (the line's ±150/±50 and the histogram's ±40) are split into separate, independently toggled groups, and every level is an input so you can adjust them.
Notes
The default thresholds are Spiroglou's published levels, which are meaningful precisely because the series is ATR-normalised. The Source input defaults to close but accepts any series. This is a momentum/context tool, not a trade signal and not financial advice.
Credit: the MACD-V concept and its lifecycle levels are the work of Alex Spiroglou, DipTA(STA), CFTe. This script is an independent implementation of the published formula and roadmap.
Gösterge

DAX Universe Relative Strength [JS]DAX Universe Relative Strength
This indicator compares the current stock with an equal-weighted German stock market benchmark consisting of DAX, MDAX, SDAX and TecDAX.
Instead of comparing a stock only with one single index, the script creates a broader DAX Universe benchmark by calculating the average performance of the four major German equity indices over a selected lookback period.
The goal is to identify whether a stock is showing relative strength or relative weakness versus the broader German stock universe.
How it works:
1. The script measures the performance of the current stock over the selected comparison period.
2. It measures the performance of DAX, MDAX, SDAX and TecDAX over the same period.
3. It calculates the equal-weighted average performance of these four indices.
4. It compares the stock’s performance with this benchmark.
5. The result is plotted as a relative strength line.
Interpretation:
- RS above 0:
The stock is outperforming the DAX Universe benchmark.
- RS below 0:
The stock is underperforming the DAX Universe benchmark.
- RS above its moving average:
Relative strength is improving.
- RS below its moving average:
Relative strength is weakening.
- Strong RS signal:
The stock is above the benchmark, above its RS moving average, and the RS moving average is rising.
This indicator is designed as a filter, not as a standalone buy or sell signal.
For pullback and swing trading, I use it to identify stocks that are stronger than the broader German market. A strong RS reading does not mean that a stock should be bought immediately. It only means that the stock deserves attention and may be worth adding to a watchlist.
A complete trade setup should also include:
- constructive trend structure
- price above important moving averages
- controlled pullback
- declining selling pressure
- clear pivot or trigger
- defined stop-loss
- attractive risk/reward ratio
The indicator includes:
- relative strength line
- moving average of the RS line
- zero line
- histogram
- background highlighting
- interpretation label
- alert conditions for RS changes
Suggested use cases:
- screening German stocks
- comparing DAX, MDAX, SDAX and TecDAX stocks
- identifying potential market leaders
- filtering pullback candidates
- avoiding stocks with persistent relative weakness
Important:
This script is for educational and analytical purposes only. It does not provide investment advice, buy signals or sell signals. Always combine relative strength analysis with your own chart analysis, risk management and trading plan. Gösterge

RSI Divergence ScoutRSI Divergence Scout is a pivot-based RSI divergence study designed to mark potential disagreement between price movement and RSI momentum directly on the price chart.
The purpose of this script is to make bullish and bearish RSI divergences easier to see without requiring a separate oscillator pane or a large visual dashboard.
What the script detects
The study looks for two common RSI divergence conditions:
Bullish RSI divergence
A bullish divergence is detected when:
– price forms a confirmed pivot low below the previous confirmed pivot low
– RSI forms a higher value compared with the RSI value at the previous pivot low
– the previous RSI value was below the lower RSI context threshold
This can suggest that downside momentum is weakening, even though price has made a lower low.
Bearish RSI divergence
A bearish divergence is detected when:
– price forms a confirmed pivot high above the previous confirmed pivot high
– RSI forms a lower value compared with the RSI value at the previous pivot high
– the previous RSI value was above the upper RSI context threshold
This can suggest that upside momentum is weakening, even though price has made a higher high.
How the calculation works
The script uses confirmed pivot highs and pivot lows.
For bearish divergence, it compares the current confirmed pivot high with the previous confirmed pivot high:
– current pivot high price is higher than the previous pivot high price
– current RSI value is lower than the previous RSI value
– the previous RSI value is above the upper RSI context threshold
For bullish divergence, it compares the current confirmed pivot low with the previous confirmed pivot low:
– current pivot low price is lower than the previous pivot low price
– current RSI value is higher than the previous RSI value
– the previous RSI value is below the lower RSI context threshold
When a divergence is detected, the script draws a dashed line between the two relevant price pivots and places a label on the current confirmed pivot. The label can also show the RSI value at that pivot.
Why pivot confirmation matters
The script waits for a pivot high or pivot low to be confirmed using the selected left/right pivot sensitivity.
This means a signal appears only after the pivot is confirmed, not at the exact live high or low. This delay is intentional. It helps reduce noise and avoids marking every small candle fluctuation as a swing point.
Inputs
RSI length
Controls the RSI calculation period.
Pivot left bars
Controls how many bars to the left are required for pivot confirmation.
Pivot right bars
Controls how many bars to the right are required for pivot confirmation.
Higher pivot values produce fewer signals and focus on larger swings. Lower values produce more signals and make the script more sensitive to smaller price movements.
Upper RSI context threshold
Used as a context filter for bearish divergence. The previous pivot high RSI must be above this threshold.
Lower RSI context threshold
Used as a context filter for bullish divergence. The previous pivot low RSI must be below this threshold.
Display settings
The script allows bullish and bearish divergence labels to be shown or hidden independently. Pivot-to-pivot lines and RSI values on labels can also be enabled or disabled.
Alerts
The script includes basic alert conditions for bullish and bearish RSI divergence.
Because the script uses confirmed pivots, alerts trigger only after the pivot confirmation process is complete.
How to use it
RSI divergence should be treated as an early warning signal, not as a complete trade trigger.
A divergence can show that momentum is changing, but it does not confirm that price must reverse. In strong trends, multiple divergences can appear before price actually changes direction.
This study is most useful when combined with additional market context, such as:
– trend structure
– support and resistance
– volume behavior
– higher-timeframe direction
– risk management rules
Limitations
The script does not predict future price direction.
It does not generate complete buy or sell signals.
Pivot-based signals appear only after the pivot is confirmed.
Divergence can fail during strong trends, low-liquidity conditions or news-driven price movement.
The study should be used as one part of a broader analysis process.
Educational content only. Not financial advice.
Gösterge

Swing Momentum Pullback Strategy + ChecklistSwing Momentum Pullback Strategy + Checklist
This indicator is a complete swing trading system designed to help traders identify
trend breakouts and low-risk momentum pullbacks, optimized for the Daily Timeframe.
The script combines a long-term trend filter, automated resistance detection, and
specific entry triggers into a single chart overlay, along with a real-time Strategy
Checklist Dashboard that confirms setups at a glance.
─────────────────────────────────
🎯 CORE COMPONENTS
─────────────────────────────────
▸ Trend Filter (Purple Line)
200-period Simple Moving Average (SMA). Acts as the long-term trend filter.
Long setups are only considered when price is above this line.
▸ Momentum Guide (Orange Line)
8-period Exponential Moving Average (EMA). Tracks short-term momentum.
In strong trends, price tends to "ride" this line. Entries are sought when
price pulls back to test this area.
▸ Multi-Month Resistance Line (Orange Horizontal)
Automatically plots the highest price over a user-defined lookback period (in months).
Instantly visualizes the key resistance level a stock must break out above.
▸ Strategy Checklist Dashboard
A real-time table that evaluates Trend, Resistance, and Momentum conditions to
display a clear ✅ ENTER, 🚀 GAP UP, or ⏳ WAIT signal.
─────────────────────────────────
🛠 HOW IT WORKS — TWO SETUPS
─────────────────────────────────
1. The Daily Gap Up ("GAP" Label)
Fires when a stock gaps up with strong overnight momentum.
• Open is at least X% above the prior day's Close (adjustable, default 3%)
• Open is above the prior day's High
• Price must be above the 200 SMA
→ Marked with a green "GAP" label on the chart
2. The Trend Pullback ("ENTER" Signal)
A trend-following entry to join an existing move at lower risk.
• Stock is in an uptrend (above 200 SMA)
• Price dips down to touch or test the 8 EMA
• Candle shows a pullback (red candle or lower close) — confirms we're buying
a dip, not chasing a top
→ Dashboard "Action Signal" turns orange and displays ✅ ENTER
─────────────────────────────────
📋 CHECKLIST DASHBOARD — READINGS
─────────────────────────────────
Trend (> 200 SMA):
🟢 Bullish — Price is in an uptrend. Safe to look for entries.
🔴 Bearish — Price is below the 200 SMA. Stay out.
Above Resistance?:
🟢 Breakout — Price has cleared the multi-month resistance line.
⚪ --- — Price is currently below the key breakout level.
Near 8 EMA?:
🟢 Yes — Price is near the value zone for a potential pullback entry.
Action Signal:
🚀 GAP UP — Strong momentum gap detected.
✅ ENTER — Valid pullback entry confirmed.
⏳ WAIT — No qualifying setup on the current bar.
─────────────────────────────────
⚙️ SETTINGS
─────────────────────────────────
- Momentum EMA Length — Default: 8. Controls pullback line sensitivity.
- Trend SMA Length — Default: 200. Long-term trend filter period.
- Gap Up % Threshold — Default: 3.0%. Minimum overnight gap to trigger signal.
- Resistance Lookback (Mo.) — Default: 3. Months used to find the key resistance level.
- Table Position — Move the checklist dashboard to any corner of your chart.
─────────────────────────────────
⚠️ DISCLAIMER
─────────────────────────────────
For educational purposes only. Not financial advice.
Always manage your risk and use a stop loss. Gösterge

Velocity Hybrid Oscillator (VHO)🚀 VELOCITY HYBRID OSCILLATOR
The Velocity Hybrid Oscillator (VHO), engineered by gunebak4n, is a dual-momentum normalization and trend velocity detection framework designed to isolate high-probability cyclical turning points and structural trend regimes.
VHO is built on the principle that true market velocity cannot be captured by a single momentum lookback or absolute price changes alone. By structurally merging the trend-following smoothing of the Price Momentum Oscillator (PMO) with the reactive cyclicality of the Relative Strength Index (RSI), and processing both through a rolling Min-Max normalization matrix, the system projects multi-dimensional momentum fields onto a fixed boundary.
Unlike conventional oscillators that frequently pin at extremes or trigger premature counter-trend signals during strong expansions, VHO normalizes relative strength and price velocity over a wide structural lookback, anchoring the final hybrid signal to a highly scannable, noise-filtered trend baseline.
💡 CORE DESIGN PRINCIPLE
🧭 Multi-Dimensional Momentum Convergence
VHO interprets market momentum not as an isolated price derivative, but as a convergence of absolute velocity (PMO) and internal strength velocity (RSI). True trend shifts emerge when these two fields align within a normalized range.
🧬 Absolute Velocity–Internal Strength–Smoothing Model
The system evaluates three interacting structural layers:
• Absolute Velocity: Double-smoothed Price Momentum Oscillator tracking rate of change.
• Internal Strength: Relative Strength Index tracking gains versus losses.
• Min-Max Normalization: Rescaling both metrics to a dynamic 144-period lookback.
The mathematical aggregation of these layers defines the final hybrid trend line.
💡 KEY FEATURES
📊 Double-Smoothed Absolute Velocity (PMO)
The system extracts clean, absolute price velocity by calculating a custom Price Momentum Oscillator. This process applies two sequential exponential moving averages to custom daily rate-of-change inputs, effectively filtering out high-frequency market noise before normalization.
🧪 Cyclical Internal Strength Layer (RSI)
To capture real-time overbought and oversold conditions without lagging the underlying price discovery, the system integrates a classical relative strength layer, subsequently smoothed by a simple moving average to align its frequency with the PMO.
📦 Dynamic Min-Max Normalization Matrix
To prevent standard indicator drift and pinning, both the raw PMO and smoothed RSI values are dynamically rescaled between 0 and 100 based on a fixed rolling lookback. This anchors all historical data points to identical relative boundaries.
📈 Velocity Hybrid Line Aggregation
The normalized absolute velocity and normalized internal strength are synthesized into a single "Sharp Line," which is then subjected to an exponential smoothing filter to generate the final, high-conviction "Hybrid Line."
🧠 Asymmetric Color & Directional Logic
The main signal line features an adaptive, four-state color architecture that reacts instantly to directional changes relative to the 50-midline pivot, shifting hue based on whether the velocity is expansionary or decaying.
🎨 Structural Divergence Detection Engine
VHO automatically maps multi-factor divergence signals across structural price action. High-probability continuation or reversal points are highlighted by identifying localized asymmetries where price makes new extremes while the Hybrid Line prints decaying peaks or troughs.
🔬 MATHEMATICAL STRUCTURE
Price Rate of Change (ROC):
ROC = ((Close - Close ) / 1) * 100
Double-Smoothed PMO:
PMO = EMA(EMA(ROC, Length1), Length2)
PMO_Raw = (PMO + PMO_Signal) / 2
RSI Internal Strength:
RSI = ta.rsi(Source, Length)
RSI_MaRaw = SMA(RSI, RSI_MA_Length)
Min-Max Normalization Function (f_normalize):
Min = Lowest(Source, Length)
Max = Highest(Source, Length)
f_normalize = 100 * (Source - Min) / max(Max - Min, 0.000001)
Hybrid Line Aggregation:
SharpLine = (f_normalize(PMO_Raw, n) + f_normalize(RSI_MaRaw, n)) / 2
HybridLine = EMA(SharpLine, k)
Divergence Signal Matrix:
BearishDiv = ta.rising(High, 5) and ta.falling(HybridLine, 5) and HybridLine > 70
BullishDiv = ta.falling(Low, 5) and ta.rising(HybridLine, 5) and HybridLine < 30
This structure ensures that cyclical overextended states are measured against a standardized historical baseline, rather than floating nominal boundaries.
🛠️ USAGE FRAMEWORK
1. Midline Pivot Evaluation
Treat the 50 level as the structural axis of equilibrium. Hybrid Line values sustained above 50 dictate a dominant bullish regime, while values below 50 confirm bearish structural control.
2. Directional Velocity Scaling
Monitor the four-state line coloration. A bright cyan (#00ffbb) or bright red (#ff5252) signal line denotes maximum acceleration in trend direction, while darker tones indicate velocity decay or potential consolidation.
3. Symmetrical Overextended Extremes
Utilize the 70 and 30 dashed reference levels to identify standard overbought and oversold thresholds. The dotted 90 and 10 parameters act as absolute extreme volatility caps.
4. Multi-Factor Divergence Validation
When the system prints red (bearish) or green (bullish) circles on the Hybrid Line, cross-reference these divergence zones with major support/resistance levels to time high-probability counter-trend reversals.
5. Regime Background Filtering
Leverage the optional "Trend Background" fill to maintain clear macro-bias context, allowing short-term hybrid fluctuations to be scaled within the overarching directional environment.
⚙️ SYSTEM CHARACTERISTICS
• Dual-engine absolute and internal velocity integration
• Fixed-boundary rolling Min-Max normalization matrix
• Four-state direction-and-regime sensitive line coloring
• Automatic high-probability divergence mapping
• Multi-layered zone fill for enhanced visual scannability
• Fully parameterized smoothing filters to match any operational asset class
📌 CREDIT
Velocity Hybrid Oscillator (VHO) is developed by gunebak4n as a structural momentum normalization and trend velocity detection framework for TradingView.
The system is designed for identifying statistically significant cyclical shifts emerging from multi-factor momentum compression, rather than isolated price-action breakouts.
⚠️ DISCLAIMER
VHO is a probabilistic analytical model. It does not predict market outcomes or guarantee trading performance. All signals must be interpreted within a disciplined risk management framework and validated with broader market context. Gösterge
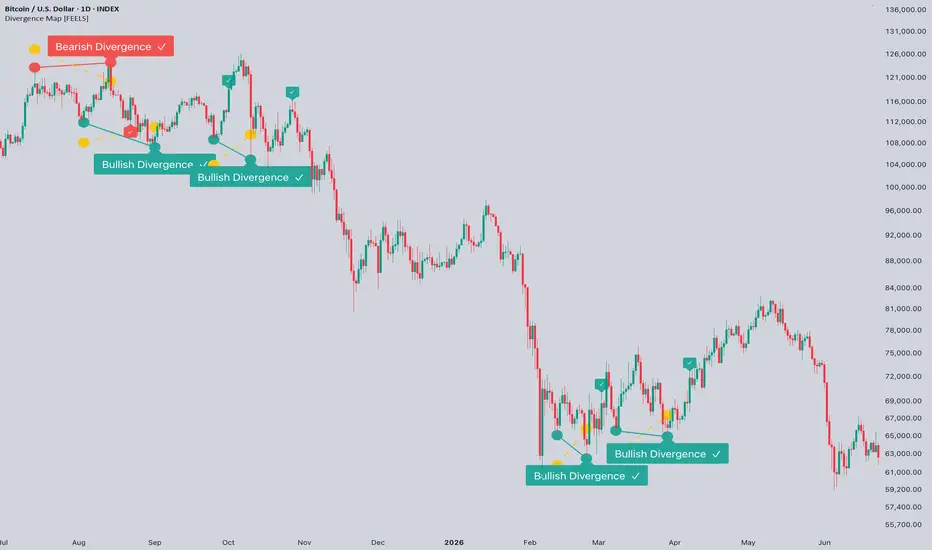
Divergence Map [FEELS]Price up, strength not.
Divergence Map marks every spot where price made a new high or low but the volume delta behind it didn't agree. Across the whole chart, not just the right edge.
OVERVIEW
Each divergence is drawn as a pair of crossing lines on the price pane: the line through the two price swings, and a second line whose opening reflects the volume delta behind those swings, widening in proportion to the strength gap so the disagreement is visible at a glance. A new high with weaker delta is marked at the top, a new low with weaker selling is marked at the bottom. Most divergence tools push a delta line into a separate panel and leave you to eyeball the slopes; this keeps the comparison on price, as one shape, for the whole chart.
HOW IT WORKS
1. Per-bar delta uses the standard bar-direction proxy: a bar closing up counts its volume as positive, a bar closing down as negative, a flat bar as zero. These are summed into a cumulative volume delta. Pine has no true tick order flow on historical bars, so this proxy is what the calculation is built on, and the logic is designed around its limits.
2. The cumulative delta is measured against its own recent trend (its value minus a moving average of itself), so divergences are read against recent flow rather than the all-time drift of a running total.
3. Swing highs and lows are found with a symmetric pivot of configurable length. A swing is used only once it is confirmed by that many closed bars on each side.
4. A top divergence is recorded when a confirmed swing high is above the previous swing high while the trend-adjusted delta at the new swing sits below its reading at the previous one. A bottom divergence is the mirror. The test compares the relative direction of delta between two swings rather than an absolute value, which is what lets it tolerate the proxy.
5. Strength is the size of that delta gap, scaled by its recent range and reported 0 to 100. A minimum-strength input hides weak readings.
6. Each divergence is then tracked for an outcome. By default it is scored from the bar it actually becomes visible (one swing length after the swing, since a swing cannot be known before then), and judged symmetrically from there: whichever comes first within the window, a reversal of the set size in its direction is a check, the same move against it is a cross. The size is taken from volatility by default (a multiple of ATR), so it scales with the timeframe; it can be switched to a fixed percent. An event also fails if price closes back through the swing that defined it. This removes the look-back head start, so the hit rate in the dashboard is descriptive of how these divergences have actually behaved, not a promise about the next one.
HOW TO USE
- Read the shape, not a number. Two lines opening apart at a top means price rose while delta did not; at a bottom, price fell while selling did not.
- The check or cross on each past event shows whether the expected reversal followed, so the chart carries its own record on the symbol and timeframe you are viewing.
- During a strong, clean trend the map stays mostly empty. That is expected: divergences appear at exhaustion, not inside a healthy trend.
- Raise minimum strength to keep only the clearer events. Swing length sets how major the marked swings are. Reversal percent and window define what counts as a resolved reversal. Turn off Remove swing lag to see the look-back figure instead of the real-time one.
PARAMETERS
- Swing length: bars per side to confirm a swing.
- Min strength: hides divergences below this 0 to 100 score.
- Delta smoothing and strength window: detrend the delta and scale the strength score.
- ATR reversal and Reversal ATR: size the reversal by volatility so the threshold scales with the timeframe (about 5% daily, around 15% weekly); turn off to use the fixed Reversal percent.
- Reversal percent and reversal window: the fixed-percent threshold and the bars allowed for a resolved reversal.
- Remove swing lag: scores each event from the bar it becomes visible and judges it symmetrically, giving a realistic hit rate instead of the look-back one.
- Labels, label and dot size, line width, colors, strength line on or off, mark hit on chart, dashboard position.
REPAINT NOTE
A swing is confirmed one swing length after it forms, which is how pivots work, and a divergence is recorded only on closed bars using that confirmed swing. Once a divergence and its lines are drawn they do not move, and the check or cross is added later on closed bars as the outcome settles. The only live element is the dashboard. No higher-timeframe or external data requests are used.
ORIGINALITY
This is original work and the source is open. It is not a wrapper around a built-in oscillator and it does not plot delta in a separate pane. The comparison is kept on the price pane as one crossing shape, applied across full history, with a built-in record of whether each marked divergence was followed by a reversal, scored from the bar it actually became visible. The honest treatment of the delta proxy, comparing relative slope rather than absolute flow, is part of the design.
Descriptive tool for studying divergence behaviour. It is not financial advice and does not predict price. Gösterge

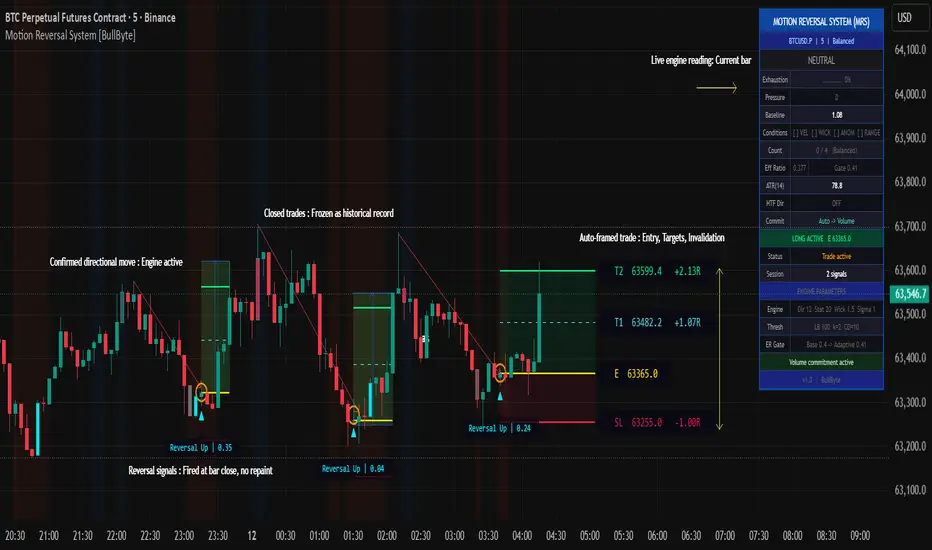
Motion Reversal System [BullByte]Motion Reversal System (MRS) - Trend-Failure Bar Detector with Adaptive Pressure Meter, Multi-Mode Signal Engine, and Complete Trade-Level Framework
---
Why This Indicator Exists
Most reversal indicators fall into one of two failure modes. Either they fire constantly in ranging markets because they have no directional filter, or they only confirm reversals long after price has already turned because they rely on lagging momentum oscillators. Motion Reversal System (MRS) was built to solve both problems in a single coherent engine.
MRS is one engine with one purpose: identify the precise bar at which a confirmed trend structurally fails - the moment commitment fades, the bar itself rejects further advance, and the move's energy reverses. From that bar, MRS automatically frames the trade with entry, two targets, and a stop loss, then manages the full trade lifecycle to closure.
---
What Makes This Not a Mashup
A mashup combines independent indicators that each output their own signal, then layers them visually. MRS is the opposite. Every component of MRS feeds into a single decision: "Is the current bar a trend-failure bar?" Remove any one component and the engine stops working correctly.
- The Directional Gate decides IF a trend is present (no trend = no exhaustion to detect)
- The Four Failure Conditions decide IF the current bar is structurally failing that trend
- The Signal Mode decides HOW STRICT the failure must be
- The Pressure Meter provides a live visual reading of building reversal pressure
- The Trade Level Engine decides WHERE to enter, stop, and target
- The HTF Filter decides WHETHER higher-timeframe context confirms the call
These are not independent indicators. They are stages of one detection pipeline. Each stage exists because the next stage cannot function without it.
---
The Engine - How It Actually Works
Stage 1 - Directional Gate (Kaufman Efficiency Ratio, Self-Adapting)
The script computes Kaufman's Efficiency Ratio (ER) over a rolling window. ER measures net price displacement divided by the total path price traveled. Values near 1.0 indicate pure trending motion; values near 0.0 indicate pure noise.
A fixed ER threshold would work well on one instrument and fail on another, so MRS adapts the gate dynamically. The threshold becomes the rolling mean of the ER series plus half a standard deviation, with a user-defined floor. This means the gate raises itself during volatile sessions and lowers during quiet sessions automatically. No re-tuning per instrument.
Only bars that occur inside a confirmed directional move (gate passed + minimum ATR displacement satisfied) are evaluated for failure. This single design choice eliminates the largest source of false signals: exhaustion calls in choppy ranges where there is no trend to exhaust.
Stage 2 - Four Failure Conditions (Evaluated at Bar Close)
For every bar inside a confirmed trend, MRS evaluates four orthogonal failure conditions:
C1 - Velocity Reversal: The bar closed against the direction of the confirmed trend. This is the most basic failure signal. A bull trend bar that closes red, or a bear trend bar that closes green.
C2 - Wick Rejection: The trend-side wick (upper wick in a bull trend, lower wick in a bear trend) is at least N times the size of the bar's body. This measures intra-bar rejection - buyers or sellers pushed price further in the trend direction and were defeated within the same bar.
C3 - Commitment Anomaly: The bar's commitment value (measured via volume-weighted body strength when volume is reliable, or wick-rejection ratio when it is not) is at least N standard deviations below the recent trend's commitment baseline. The current bar is statistically anomalous compared to what the trend has been producing.
C4 - Range Expansion: The bar's true range is at least N times ATR. Filters out small doji bars where wick rejection and velocity reversal become meaningless from microstructure noise.
These four conditions are orthogonal - they measure different physical properties of the bar. C1 measures direction. C2 measures intra-bar struggle. C3 measures volume/commitment. C4 measures magnitude. When multiple conditions align on the same bar, the signal reflects a greater degree of structural confluence - though no combination of conditions guarantees a reversal.
Stage 3 - Signal Mode (Strictness Selector - THE ACTUAL SIGNAL GATE)
This is the decisive gate that determines whether a signal fires. The user chooses how many of the four conditions must align:
Conservative - All 4 conditions required. Rarest signals, highest structural confluence. Best for swing traders, low-noise sessions, or those who prefer fewer signals with stronger multi-condition alignment.
Balanced (default) - Any 3 of 4 conditions required. Middle ground for most users and most timeframes. Allows one condition to be absent if the other three are strong.
Aggressive - Velocity Reversal (C1) is mandatory plus at least one other condition (minimum 2 of 4 total). Most signals, fewer conditions required per signal. Best for scalpers, active intraday traders, or those who prefer earlier detection at the cost of more false positives.
When the chosen condition count is satisfied at bar close, a signal fires. The Pressure Meter (Stage 5) is a separate visual reading and does not gate signals.
Stage 4 - Commitment Measurement (Volume-Aware with Auto Fallback)
Commitment measures how decisively the market voted on each bar. MRS supports three measurement modes:
Auto (recommended) - Uses volume-weighted commitment on instruments with real volume data (crypto, futures, stocks with traded volume). Automatically falls back to wick-rejection ratio on indices and synthetic feeds where reported volume is meaningless. The dashboard surfaces whichever method is actually active.
Volume - Forces volume-weighted measurement. Useful when you want to lock the method explicitly. Silently falls back to wick if data is missing, with a dashboard warning.
Wick - Forces wick-rejection ratio regardless of volume availability. Best for spot Gold (XAUUSD), forex, or any instrument where you don't trust the broker's volume feed.
Stage 5 - Adaptive Pressure Meter (Live Visual Reading)
The pressure meter is the dashboard's live reading of building reversal pressure. It is always populated whenever a trend is confirmed, regardless of whether the four-condition gate has been met. This gives the trader a continuous sense of how strong the reversal pressure has been building.
The meter is normalized against an adaptive baseline calculated from its own rolling history (mean + multiplier x stdev). The dashboard percentage shows where the current meter sits relative to that baseline.
Important: the baseline is a visual reference only. It does not gate signals. The signal authority is the Signal Mode condition count described in Stage 3. The meter and baseline simply help the trader monitor when conditions are increasingly aligned before they actually trigger.
Stage 6 - Higher Timeframe Confirmation (Optional Filter)
When enabled, the engine cross-checks every signal against the directional state of a higher timeframe. A reversal signal on the chart timeframe is marked "Strong" when the higher timeframe direction agrees with the chart trend being reversed against. For example: chart is in a confirmed bull move, HTF is also bullish, and a bear reversal signal fires - this is HTF-Strong, because the HTF confirms the bull trend that is being exhausted.
If the HTF direction disagrees with the chart trend (e.g., chart is in a bull move but HTF is already bearish), the signal is marked "Weak" - visually dimmed but not suppressed. The trader still sees the call but is warned that the HTF backdrop does not align with the underlying chart trend being detected.
The HTF uses request.security with lookahead = barmerge.lookahead_off, eliminating future-data leak across timeframes. The HTF series itself naturally evolves as each HTF candle forms (this is standard Pine behavior), so the script treats HTF as a confirmation filter rather than a guarantee of HTF-bar finalization. The signal trigger itself remains chart-bar-close only.
Stage 7 - Trade Level Engine (Complete Lifecycle)
When a signal fires, the engine automatically computes and draws:
- Entry: signal-bar close
- Stop Loss: fixed ATR distance from entry (not score-scaled - strong signals deserve tighter stops, not wider ones)
- Target 1: intermediate reference level, ATR distance scaled by signal strength (visual only, does not close trade)
- Target 2: decisive level, ATR distance scaled by signal strength (closes the trade on hit)
While the trade is active, four colored horizontal lines extend from the signal bar to the current bar, with monospace pill labels showing the price and R:R for each level. Two zone fills (green Entry to TP2 reward zone, red Entry to SL risk zone) make the risk/reward geometry visible at a glance.
The trade closes when either TP2 or SL is touched at bar close (intra-bar wicks that retreat before close do NOT close the trade). Same-bar TP2/SL tie is resolved as SL hit (conservative backtest assumption).
After closure, the trade-level lines freeze in place as historical record. Labels and fills vanish to keep the chart clean. The cooldown counter starts. By default, all four lines (Entry, SL, TP1, TP2) persist as historical traces for richest backtest visibility. The "Keep TP1/TP2 Historical Lines" input can be turned off to delete TP1/TP2 lines on closure and roughly double the number of historical trades the chart can hold before Pine's 500-line cap is reached.
---
Signal Timing - No Repaint
All signal generation and trade closure is gated to confirmed (closed) bars via barstate.isconfirmed.
- A reversal signal triangle and label appear only at the close of the signal bar
- Entry, SL, TP1, TP2 levels are computed from the signal bar's close
- Trade closure (TP2 / SL hit) is evaluated only after the candle finalizes - intra-bar wicks that retreat before close do not trigger closure
The trade-off is up to one bar of timing on closure for cases where price spikes through a level intra-bar and retraces. The gain is realistic backtest visuals and zero repaint at every stage of the trade lifecycle. This is an intentional architectural choice for honest behavior over flashy intra-bar firing.
---
How to Read the Chart
Signal Markers
Bull Reversal (detected inside a confirmed bear move, reversal up signaled): small cyan triangle below the bar.
Bear Reversal (detected inside a confirmed bull move, reversal down signaled): small red triangle above the bar.
Important: a bearish reversal signal fires inside a confirmed bull move. The signal detects exhaustion of the prevailing trend - not confirmation of a new one. The dashboard will show BULL MOVE while a short is active. This is correct behavior - you are trading the exhaustion of that bull move.
A monospace pill label sits beside each triangle showing the failure score (e.g., "Reversal Up | 2.45"). Higher numbers indicate stronger structural confluence across the four conditions.
When HTF Confirmation is enabled and HTF disagrees with the signal, the triangle and label appear in a dimmed color with "(HTF)" appended to the label text. The signal is still visible but is visually de-emphasized.
Trade Level Lines
Once a signal fires, four horizontal lines appear extending from the signal bar:
- Entry (yellow, solid): the price at which the signal was generated (signal-bar close)
- Target 1 (cyan, dashed): intermediate reference level, visual only
- Target 2 (green, solid): decisive level - trade closes when this is hit at bar close
- Stop Loss (red, solid): risk level - trade closes when this is hit at bar close
Pill labels at the right end of each line show the exact price and R:R distance.
Zone Fills
- Green soft fill between Entry and TP2: the reward zone
- Red soft fill between Entry and SL: the risk zone
At a glance, the green:red ratio visualizes the trade's risk-to-reward geometry.
Directional Background
- Subtle blue tint: a bull trend is confirmed
- Subtle red/orange tint: a bear trend is confirmed
- No tint: no confirmed direction (chop)
Bar Coloring (Exhaustion Gradient)
When the exhaustion meter rises above the trigger threshold (default 50% of baseline), bars are tinted on a gradient:
- Cool color (cyan/red): exhaustion is building but moderate
- Bright color (red on bull trend, cyan on bear trend): exhaustion has reached or exceeded the baseline - conditions for a signal are increasingly met, though no signal fires until the condition count gate is satisfied at bar close
Historical Trade Traces
After a trade closes, by default all four trade-level lines (Entry, SL, TP1, TP2) remain on the chart as a permanent historical record. This builds a visual log of every prior MRS detection directly on the chart. The "Keep TP1/TP2 Historical Lines" input can be turned off if you want to conserve Pine's line-object cap.
---
How to Read the Dashboard (Full Mode)
The dashboard is the live diagnostic panel. Every row tells you something specific about the current state of the engine. From top to bottom:
Row 0 - Title: "MOTION REVERSAL SYSTEM (MRS)" - confirms the indicator name.
Row 1 - Context: ticker symbol, chart timeframe, and active Signal Mode.
Row 2 - Directional State: BULL MOVE / BEAR MOVE / NEUTRAL - large text, colored. Tells you whether a confirmed trend is currently in effect. When a trade is active against the current trend (e.g., short open during a bull move), this row appends "SHORTING EXHAUSTION" or "LONGING EXHAUSTION" so the dashboard reads as a coherent statement rather than an apparent contradiction.
Row 3 - Exhaustion bar: a 10-segment text-based pressure bar with percentage. Shows how close the live meter is to the adaptive baseline. Color escalates from gray to teal to purple to bright red/cyan as pressure builds.
Row 4 - Pressure: numerical value of the live exhaustion meter.
Row 5 - Baseline: the adaptive baseline value (mean + k x stdev) the meter is compared against. Visual reference only - does not gate signals.
Row 6 - Conditions: which of the four failure conditions are currently satisfied. " VEL WICK ANOM RANGE" means C1, C2, C4 are firing; C3 is not.
Row 7 - Count: how many of 4 conditions are firing, with current Signal Mode in parentheses. This is the actual signal authority - when the count satisfies the Signal Mode rule, a signal fires.
Row 8 - Eff Ratio: the current Kaufman Efficiency Ratio value, with the adaptive gate level next to it. Shows whether the directional gate is passing.
Row 9 - ATR: current ATR value at the configured length. Reference for understanding trade-level distances.
Row 10 - HTF Dir: current higher-timeframe directional state, OR "INVALID HTF (set higher than chart)" warning if user has misconfigured the HTF input.
Row 11 - Commit: which commitment measurement method is currently active (Auto -> Volume, Auto -> Wick fallback, etc.), with warning indicator if forced mode silently fell back.
Row 12 - Active Trade Status: "NO ACTIVE TRADE" or "LONG ACTIVE E " / "SHORT ACTIVE E " - color-coded.
Row 13 - Status: "Ready for signal" / "Cooldown: N bars" / "Trade active" - tells you whether the engine can fire a new signal right now.
Row 14 - Session: count of signals fired in the current session (resets daily).
Rows 15 to 19 - Engine Parameters reference: live readouts of the directional window, lookback periods, threshold parameters, ER gate values, and current commitment status. Useful for verifying your settings are applied as expected.
Row 20 - Version and Author footer.
Mobile / Minimal Dashboard Mode
For phone and tablet users, switching "Dashboard Mode" to "Minimal (Mobile)" collapses the dashboard to a single-column 5-row compact layout with larger fonts: Title, State, Exhaustion, Conditions, and Trade Status. Diagnostics are hidden for screen-space efficiency.
---
Default Settings Explained
- Directional Window: 12 bars - measures Efficiency Ratio over a 12-bar lookback
- Directional Threshold (Base): 0.40 - minimum ER for trend confirmation, adapted upward dynamically
- Min Move Size: 1.5 ATR - net displacement must be at least 1.5 ATR for a trend to qualify
- Trend Statistics Lookback: 20 bars - sample size for computing commitment baseline statistics
- Wick Rejection Ratio: 1.5 - trend-side wick must be at least 1.5x the body to count as rejection
- Commitment Anomaly Sigma: 1.0 - current commitment must be at least 1.0 standard deviation below trend mean
- Min Range Expansion: 1.2 ATR - current bar range must be at least 1.2x ATR
- Signal Mode: Balanced - any 3 of 4 conditions required
- Baseline Lookback: 100 bars - rolling history for pressure meter statistics
- Baseline Multiplier: 2.0 - baseline = mean + 2.0 x stdev
- ATR Length: 14 - standard ATR period
- Commitment Mode: Auto - volume on real-volume instruments, wick on indices
- Post-Closure Cooldown: 10 bars - wait 10 bars after trade closure before new signal
- Stop Loss Distance: 1.5 ATR - base SL distance from entry
- Target 1 Distance: 1.5 ATR - T1 at 1:1 with SL
- Target 2 Distance: 3.0 ATR - T2 at 1:2 with SL
- Score-Weight Nudge: 0.3 - stronger signals widen targets by up to 30%
- Min Label Spacing: 0.35 ATR - minimum vertical gap between pill labels for readability
---
Recommended Usage by Trader Profile
Scalper (1m to 5m): Aggressive mode, Cooldown 5 to 8 bars, HTF Confirmation on 15m. Signal frequency will be higher in Aggressive mode; use the dashboard pressure meter to monitor building exhaustion between signals.
Intraday Trader (5m to 30m): Balanced mode (default), Cooldown 10 bars, HTF Confirmation on 1h to 4h. The default settings were designed with this profile in mind as a starting reference point.
Swing Trader (1h to 4h): Conservative mode, Cooldown 15 to 20 bars, HTF Confirmation on Daily. Few signals, maximum condition confluence required.
Position Trader (Daily and above): Conservative mode, HTF Confirmation on Weekly. Signals are rare; when they fire, all four structural failure conditions have aligned on a higher timeframe bar.
---
Recommended Markets
- Crypto (Spot and Perpetuals): well-suited - high volume data availability, clean microstructure, MRS auto-selects volume-weighted commitment
- Index Futures (NQ, ES, NIFTY futures): well-suited - real traded volume available, strong directional character
- FX Majors: usable with Wick commitment mode forced (broker volume is unreliable)
- Spot Gold (XAUUSD): use Wick mode explicitly - most brokers report tick count as volume which is meaningless
- Cash Indices (NIFTY, SPX index): MRS auto-detects index type and routes to Wick mode; verify Commit row on dashboard
---
A Real-World Example Walkthrough
This walkthrough is a constructed illustration of how the engine behaves. It does not represent a historical trade or a performance result.
Scenario: BTCUSDT 15m chart, Balanced mode, Auto commitment.
Bars 1 to 20: Price climbs in a steady bull move. Dashboard shows BULL MOVE, Efficiency Ratio 0.55, Pressure Meter 0.20 (low). No signals fire because exhaustion is not building.
Bar 21: A large green candle prints - Range Expansion (C4) fires but the bar closes strong (no Velocity Reversal C1), and commitment is normal (no C3). Only 1 of 4 conditions. No signal.
Bars 22 to 24: Three smaller green bars with shrinking bodies. The Pressure Meter ticks up to 0.55 (moderate). Bar coloring activates softly. Dashboard "Conditions" row shows - only Wick Rejection is firing intermittently. No signal yet.
Bar 25: A red bar prints with a long upper wick and large range. All four conditions fire:
- C1 Velocity Reversal: bar closed red (against bull trend)
- C2 Wick Rejection: upper wick is 1.8x the body
- C3 Commitment Anomaly: bar's commitment is 1.4 standard deviations below the trend baseline
- C4 Range Expansion: bar range is 1.6x ATR
Dashboard shows "Conditions: VEL WICK ANOM RANGE | Count: 4/4". Pressure Meter reads 1.15.
A red bear reversal triangle prints above the bar with the label "Reversal Down | 3.42". Trade-level lines automatically draw:
- Entry (yellow): 64,210.50 (signal-bar close)
- SL (red): 64,422.00 (1.5 ATR above entry, since this is a short)
- T1 (cyan dashed): 63,999.00 (1.5 ATR x score-scale below entry)
- T2 (green): 63,576.00 (3.0 ATR x score-scale below entry)
Green reward fill appears Entry to T2, red risk fill Entry to SL. Dashboard "Active Trade" row turns red: "SHORT ACTIVE E 64,210.50". Dashboard "Directional State" row reads: "BULL MOVE | SHORTING EXHAUSTION".
Over the next several bars, price drops. The trade-level lines extend bar-by-bar. Dashboard " Status " reads "Trade active". No new signals fire because one trade is already open.
Bar 32: In this example, price reaches T2 at 63,576.00 on this bar's close. The trade closes at the target level. Labels and zone fills vanish. The trade-level lines freeze at bar 32 as historical record. Dashboard "Status" switches to "Cooldown: 10 bars".
Bars 33 to 42: Cooldown period. No new signals possible.
Bar 43: Cooldown complete. Dashboard "Status" reads "Ready for signal". The engine will evaluate the next qualifying bar for failure conditions.
---
Chart Examples
These screenshots show the indicator in use at specific moments in time. They are provided for visual reference only and do not represent performance results or forward-looking outcomes.
1. MRS detected a trend-failure bar inside a confirmed bull move on BTCUSDT 5m. Range expansion (C4) fired as exhaustion pressure reached the adaptive baseline (1.28 vs 1.03). Balanced mode gated the short at bar close - entry 62,553.3, SL 62,681.9, T2 62,273.6 (T2 distance: 2.17R).
2. MRS detected a trend-failure bar at the low of a confirmed bear move on NQ1! 5m. As the engine tracked displacement against path length (ER), exhaustion pressure crossed the adaptive baseline - failure score 0.48. Balanced mode gated the long at bar close - entry 30,553.75, SL 30,489.00, T2 30,706.50 (T2 distance: 2.36R).
---
Parameter Adjustment Guide
If you get too few signals:
- Switch Signal Mode to Aggressive
- Lower Wick Rejection Ratio (1.0 to 1.2)
- Lower Commitment Anomaly Sigma (0.7 to 0.9)
- Lower Min Range Expansion (1.0 to 1.1)
- Reduce Cooldown to 5
If you get too many false signals:
- Switch Signal Mode to Conservative
- Raise Wick Rejection Ratio (2.0 to 2.5)
- Raise Commitment Anomaly Sigma (1.3 to 2.0)
- Raise Min Range Expansion (1.5 to 2.0)
- Enable HTF Confirmation
- Raise Cooldown to 15 to 20
If the T2 zone is reached but price reverses sharply before bar close triggers closure:
- Reduce T2 Distance to 2.0 to 2.5 ATR
- Reduce Score-Weight Nudge to 0.1 (less target widening on strong signals)
If SL is hit too often:
- Increase Stop Loss Distance to 2.0 ATR
- Increase T1 and T2 proportionally to maintain R:R geometry
---
What This Indicator Does Not Do
- It does not execute trades. It is an indicator (overlay), not a strategy. Order placement and trade management decisions remain with the user.
- It does not predict the future. It identifies bars where a confirmed trend has structurally failed based on objective criteria.
- It does not eliminate losses. False signals will occur, especially in news-driven price spikes. Always size positions according to your own risk management rules.
- It does not work on every instrument equally well. Choppy low-liquidity assets produce noisier signals. Test on your specific market before relying on it.
- It does not replace discretionary judgment. Use MRS as one input in your decision process, not the only input.
---
Alerts Available
MRS Bull Reversal (Strong) - bullish reversal signal; HTF confirms the preceding bear trend
MRS Bull Reversal (HTF Weak) - bullish reversal signal; HTF does not confirm the preceding bear trend
MRS Bear Reversal (Strong) - bearish reversal signal; HTF confirms the preceding bull trend
MRS Bear Reversal (HTF Weak) - bearish reversal signal; HTF does not confirm the preceding bull trend
MRS Target 2 Hit - trade closure at T2 level
MRS Stop Loss Hit - trade closure at SL level
---
Disclaimer
This script is provided for educational and analytical purposes only. It is not financial advice, an investment recommendation, or a solicitation to trade. Past performance of any indicator or strategy does not guarantee future results. Trading involves substantial risk of loss. The author and TradingView are not liable for any losses or damages arising from use of this script. Always validate signals against your own analysis, conduct your own due diligence, and apply prudent risk management. Use at your own risk.
---
Open source under Mozilla Public License 2.0. Code is fully readable in the Pine Editor for those who want to study the math. Thank you.
- BullByte Gösterge

SQZ SCAN & EMA Ride Scanner - AshishShort Description
A dual-mode EMA9/21/50 trend-ride scanner with volume classification and a relative-strength "Grinder Mode" for stocks that trend without ever coiling tight enough to trigger a squeeze. Use alongside its companion, SQZ_SCAN, for momentum timing.
What it does
EMA Ride Scanner V2.a finds stocks in a clean, established uptrend and flags healthy pullback zones to buy — instead of chasing breakouts after the move has happened. Built on ideas from Qullamaggie's Episodic Pivot framework, Stockbee's price-neglect filter, and VCPSwing's 10/20-MA ride philosophy. It checks: EMA9>21>50 stack alignment, minimum ride duration, distance from 52-week low, and volatility contraction. Volume bars are color-coded as EP surges, distribution, or healthy dips.
Two modes (single toggle)
Standard Mode (toggle OFF) — for stocks that coil and release. Flags a 0-5% pullback to EMA9, ideally on light volume. Pair with SQZ_SCAN for the breakout-timing signal.
Grinder Mode (toggle ON) — for stocks that never coil. Some strong trends have such low, steady volatility that they never compress enough to trigger a squeeze — by the time SQZ_SCAN fires, they've already run too far from EMA9 to count as a dip. Grinder Mode drops the squeeze requirement and instead checks: low ATR, long ride above EMA21, and meaningful outperformance vs a benchmark index (momentum begets momentum). If price is also near EMA9/21, it flags a Grinder Setup.
Note: cloud-bounce count is shown for visual reference only, not used as a filter — low-ATR stocks often show very few bounces simply because they ride EMA9 continuously rather than dipping and recovering.
Companion: SQZ_SCAN
SQZ_SCAN (LazyBear Squeeze Momentum, normalized to % of price for cross-stock comparison) shows when volatility compression releases into a confirmed move — WATCH (squeeze building, qualifying bar count reached), EARLY FIRE (momentum just turned positive inside the squeeze), or BUY (squeeze fired + momentum green & rising + volume surge confirmed).
Workflow:
Screen with EMA Ride Scanner (Standard Mode) for clean pullback candidates.
Check SQZ_SCAN on each — prioritize WATCH/EARLY FIRE/BUY.
Separately, screen Grinder Mode for low-volatility names — don't require SQZ confirmation here, it structurally won't fire for this archetype.
Sanity-check on hourly before entry — only to rule out an active breakdown, not as a hard gate. Both indicators are daily-timeframe tools; hourly readings are noisy and shouldn't override a valid daily setup.
What this isn't
A screening tool, not a full trading system — no buy/sell signals, no risk management built in. Combine with your own entry timing, sizing, and stops. Gösterge

EMA Ride Scanner V2.a (Toggle) - AshishShort Description
A dual-mode EMA9/21/50 trend-ride scanner with volume classification and a relative-strength "Grinder Mode" for stocks that trend without ever coiling tight enough to trigger a squeeze. Use alongside its companion, SQZ_SCAN, for momentum timing.
What it does
EMA Ride Scanner V2.a finds stocks in a clean, established uptrend and flags healthy pullback zones to buy — instead of chasing breakouts after the move has happened. Built on ideas from Qullamaggie's Episodic Pivot framework, Stockbee's price-neglect filter, and VCPSwing's 10/20-MA ride philosophy.
It checks: EMA9>21>50 stack alignment, minimum ride duration, distance from 52-week low, and volatility contraction. Volume bars are color-coded as EP surges, distribution, or healthy dips.
Two modes (single toggle)
Standard Mode (toggle OFF) — for stocks that coil and release. Flags a 0-5% pullback to EMA9, ideally on light volume. Pair with SQZ_SCAN for the breakout-timing signal.
Grinder Mode (toggle ON) — for stocks that never coil. Some strong trends have such low, steady volatility that they never compress enough to trigger a squeeze — by the time SQZ_SCAN fires, they've already run too far from EMA9 to count as a dip. Grinder Mode drops the squeeze requirement and instead checks: low ATR, long ride above EMA21, and meaningful outperformance vs a benchmark index (momentum begets momentum). If price is also near EMA9/21, it flags a Grinder Setup.
Note: cloud-bounce count is shown for visual reference only, not used as a filter — low-ATR stocks often show very few bounces simply because they ride EMA9 continuously rather than dipping and recovering.
Companion: SQZ_SCAN
SQZ_SCAN shows when volatility compression releases into a confirmed move — WATCH (squeeze building), EARLY FIRE (just released), or BUY (released + volume confirmed). NOTE: As with most indicators, this is a lagging indicator on a daily timeframe, and accuracy reduces significantly on lower timeframes.
Workflow:
Screen with EMA Ride Scanner (Standard Mode) for clean pullback candidates.
Check SQZ_SCAN on each — prioritize WATCH/EARLY FIRE/BUY.
Separately, screen Grinder Mode for low-volatility names — don't require SQZ confirmation here, it structurally won't fire for this archetype.
Sanity-check on hourly before entry — only to rule out an active breakdown, not as a hard gate. Both indicators are daily-timeframe tools; hourly readings are noisy and shouldn't override a valid daily setup.
What this isn't
A screening tool, not a full trading system — no buy/sell signals, no risk management built in. Combine with your own entry timing, sizing, and stops. Gösterge

Peak Activity Range Pro + SignalsPeak Activity Range Pro + Signals is an advanced price action indicator that automatically identifies high-activity trading zones where buyers and sellers have shown strong participation. These zones can help traders monitor potential support, resistance, breakout, and retest opportunities across multiple markets.
The indicator continuously analyzes recent price action to locate areas where momentum slows, reversals develop, or consolidation occurs before significant market moves.
Features
• Automatic Bullish Activity Zones
• Automatic Bearish Activity Zones
• Dynamic Supply & Demand Areas
• Retest Detection
• Zone Strength Classification
• Bullish & Bearish Reaction Markers
• Automatic Zone Extension
• Expired Zone Removal
• Optional EMA Trend Filter
• Multi-Timeframe Compatible
• Non-Repainting Zone Detection
How It Works
The indicator scans recent candles to detect areas where price experienced significant buying or selling activity. When a bullish accumulation zone is confirmed, a Buy Activity Range is created and projected forward until it is invalidated When bearish distribution is detected, a Sell Activity Range is generated to highlight potential resistance. As price revisits these areas, traders can monitor reactions for continuation or reversal confirmation.
Zone Colors
🟢 Bullish Activity Range
* Potential demand
* Buyer participation
* Retest support
🔴 Bearish Activity Range
* Potential supply
* Seller participation
* Retest resistance
Recommended Timeframes
Scalping
• M5
• M15
Intraday
• M30
• H1
Swing Trading
• H4
• Daily
Indicator Highlights
• Automatic Activity Range Detection • Smart Zone Projection • Clean Chart Layout
• Lightweight Performance • Configurable Sensitivity • Adjustable Zone Width • Retest Confirmation • Visual Buy/Sell Bias • Suitable for Trending and Ranging Markets
Suggested Trading Workflow
1. Identify the prevailing market trend.
2. Wait for price to return to an activity range.
3. Watch for confirmation such as a rejection candle, market structure shift, or momentum signal.
4. Manage risk using appropriate stop-loss and position sizing.
Notes
This indicator is designed as an analytical tool to highlight historical price activity zones. It should be used alongside your own trading plan, market structure analysis, and risk management. Like all technical indicators, it does not predict future price movements or guarantee profitable trades. Gösterge

Gösterge

Gösterge

Gösterge
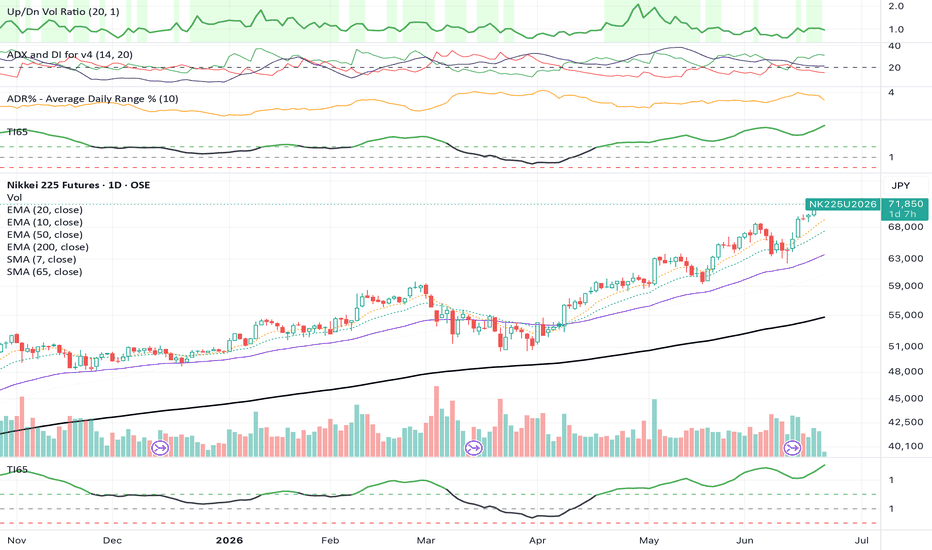
DUAL MOMENTUMdual momentum
dual momentum is a visual momentum oscillator built to compare a fast momentum line and a slow momentum line inside a symmetric oscillator range.
the goal of this tool is to help traders read momentum expansion, momentum compression, bullish pressure, bearish pressure, crossovers, overbought areas and oversold areas in a clean separate pane.
this indicator is not a strategy and does not place trades. it does not predict the future and does not guarantee buy or sell signals. it is designed as a technical analysis tool for reading momentum context.
main idea
dual momentum uses a normalized price calculation to transform price movement into a bounded oscillator.
the fast line reacts more quickly to price movement.
the slow line reacts more slowly and gives a smoother momentum reference.
when the fast line is above the slow line, momentum is generally stronger on the bullish side.
when the fast line is below the slow line, momentum is generally stronger on the bearish side.
the distance between both lines helps show whether momentum is expanding or compressing.
what the indicator displays
fast momentum line
slow momentum line
bullish and bearish gradient fill
fast and slow spread ribbon
higher and lower flow bands
bull and bear rails
optional cross triangles
ob and os text markers
glow effect
separate buy and sell alert conditions
how to read the oscillator
the oscillator is centered around zero.
above zero, momentum is generally stronger.
below zero, momentum is generally weaker.
when the fast line crosses above the slow line, bullish momentum may be increasing.
when the fast line crosses below the slow line, bearish momentum may be increasing.
when both lines are far from zero, momentum is extended.
when both lines return toward zero, momentum is cooling down.
input guide
engine
source
selects the price source used for the main calculation.
common choices are close, open, high, low, hl2, hlc3 or ohlc4.
normalization window
sets how many bars are used to normalize price movement.
a higher value creates a smoother and more stable oscillator.
a lower value makes the oscillator more reactive but also more sensitive to noise.
fast smoothing
controls the speed of the fast momentum line.
lower values make the fast line react quickly.
higher values make the fast line smoother.
slow smoothing
controls the speed of the slow momentum line.
lower values make the slow line more reactive.
higher values make the slow line smoother and slower.
amplitude
controls how much the oscillator expands vertically.
higher values make the lines move farther from zero.
lower values keep the lines closer to the center.
range cap
sets the maximum positive and negative range of the oscillator.
this keeps the display symmetrical and prevents the lines from expanding too far.
flow bands
show higher / lower bands
shows or hides the upper and lower flow bands.
these bands help visualize where the oscillator is moving inside its higher and lower zones.
band length
sets the calculation length used for the flow bands.
a higher value makes the bands smoother.
a lower value makes the bands more reactive.
band smoothing
smooths the flow band calculation.
higher smoothing reduces noise.
lower smoothing reacts faster.
band inner edge
controls how deep the flow bands extend toward the center.
higher values create tighter bands.
lower values create larger bands.
bull / bear fill
gradient fill under line
shows or hides the bull and bear gradient fill around the oscillator.
this fill helps identify whether the oscillator is leaning bullish or bearish.
gradient transparency
controls the visibility of the gradient fill.
higher values make the fill lighter.
lower values make the fill stronger.
fast / slow spread ribbon
shows the colored ribbon between the fast and slow lines.
when fast is above slow, the ribbon uses the bullish color.
when fast is below slow, the ribbon uses the bearish color.
ribbons
show bull / bear rails
shows or hides the rail markers at the top and bottom of the oscillator pane.
these rails help show when the fast and slow spread becomes strong enough.
rail min strength
sets the minimum strength required before the rails appear.
higher values show fewer rail signals.
lower values show more rail signals.
signals
show cross triangles
shows or hides triangle markers when the fast line crosses the slow line.
this input is off by default to keep the chart cleaner.
show ob / os text
shows or hides overbought and oversold text markers.
the script displays only text markers, without boxes.
ob text appears above the upper rail.
os text appears below the lower rail.
overbought level
sets the level where the script can mark an ob event.
an ob event appears when the fast line crosses above this level.
oversold level
sets the level where the script can mark an os event.
an os event appears when the fast line crosses below this level.
glow
neon glow
shows or hides the glow around the fast and slow lines.
glow intensity
controls the strength of the glow.
higher values make the glow stronger.
lower values make it softer.
colors
fast / bull color
sets the color of the fast line and bullish visuals.
slow / bear color
sets the color of the slow line and bearish visuals.
buy triangle color
sets the color of the bullish triangle when cross triangles are enabled.
ob / os gold
sets the color of the ob and os text markers.
signals and alerts
buy condition
a buy condition happens when the fast line crosses above the slow line.
this does not mean automatic entry.
it only means the fast momentum line moved above the slow momentum line.
sell condition
a sell condition happens when the fast line crosses below the slow line.
this does not mean automatic exit or short entry.
it only means the fast momentum line moved below the slow momentum line.
ob condition
an ob condition happens when the fast line crosses above the overbought level.
this can show strong upside extension.
os condition
an os condition happens when the fast line crosses below the oversold level.
this can show strong downside extension.
beginner tutorial
step 1: start with the default settings
keep the default settings at first.
the default setup gives a balanced view between speed and smoothness.
step 2: watch the fast and slow lines
the fast line reacts first.
the slow line confirms the broader momentum direction.
when fast is above slow, bullish momentum is stronger.
when fast is below slow, bearish momentum is stronger.
step 3: use the zero line as balance
when both lines are above zero, momentum is generally positive.
when both lines are below zero, momentum is generally negative.
when both lines are close to zero, the market may be neutral or compressing.
step 4: read the spread ribbon
the ribbon between fast and slow shows the momentum spread.
a wider ribbon means stronger separation.
a smaller ribbon means momentum is compressing.
step 5: read the rails
rails appear when the fast and slow difference becomes strong enough.
bull rails show stronger bullish spread.
bear rails show stronger bearish spread.
step 6: use ob and os as extension warnings
ob means the fast line has reached an overbought extension area.
os means the fast line has reached an oversold extension area.
these markers are not automatic reversal signals.
they only show that momentum reached an extreme area.
step 7: use cross triangles only when needed
cross triangles are off by default.
turn them on only if you want visual markers for fast and slow crosses.
for a cleaner chart, keep them disabled and focus on the lines and ribbon.
step 8: confirm with price action
before using any signal, check the price chart.
look for trend direction, support and resistance, market structure, candle close and volume reaction.
do not use the oscillator alone.
example 1: bullish momentum shift
the fast line crosses above the slow line.
the spread ribbon turns bullish.
the oscillator is moving above zero.
this can suggest that bullish momentum is increasing.
a beginner should then check if price is also making higher highs or higher lows.
example 2: bearish momentum shift
the fast line crosses below the slow line.
the spread ribbon turns bearish.
the oscillator is moving below zero.
this can suggest that bearish momentum is increasing.
a beginner should then check if price is also making lower highs or lower lows.
example 3: overbought extension
the fast line crosses above the overbought level.
the script prints ob text above the rail.
this means momentum is stretched upward.
it does not mean price must reverse immediately.
a beginner should wait for rejection, loss of momentum or a structure shift before making any decision.
example 4: oversold extension
the fast line crosses below the oversold level.
the script prints os text below the rail.
this means momentum is stretched downward.
it does not mean price must reverse immediately.
a beginner should wait for support reaction, momentum recovery or a structure shift before making any decision.
example 5: compression before expansion
the fast and slow lines move close together near zero.
the spread ribbon becomes small.
this can show momentum compression.
if the fast line later separates strongly from the slow line, momentum may begin expanding again.
recommended beginner workflow
first, identify the market trend on the price chart.
second, check whether the oscillator is above or below zero.
third, compare the fast line with the slow line.
fourth, read the spread ribbon.
fifth, check for ob or os extension.
sixth, confirm with support, resistance, structure and candle close.
seventh, define risk before any trade idea.
best use cases
reading momentum direction
spotting momentum expansion
spotting momentum compression
watching fast and slow line crosses
identifying overbought and oversold extensions
supporting trend continuation analysis
supporting reversal watch zones
building simple momentum alerts
important notes
ob does not automatically mean sell.
os does not automatically mean buy.
cross triangles are only visual momentum markers.
the oscillator should be used with price action and risk management.
higher settings make the tool smoother.
lower settings make the tool faster.
no indicator can guarantee future market direction.
risk note
this indicator is for technical analysis and educational market study only. it does not provide financial advice, investment advice or guaranteed trading signals. all signals, levels, labels and alerts are references that require independent confirmation and proper risk management.
Gösterge

[Viprasol] Real Relative StrengthOverview
This indicator is based on the open-source "Real Relative Strength" (RRS) concept, which measures how an asset is performing against a benchmark after normalising for volatility. The original plots ATR-normalised relative momentum versus a benchmark (e.g. SPY) with zero-cross arrows and strong/weak zones. This version keeps that calculation and adds RRS/price divergence detection, a second-benchmark agreement filter, a signal cooldown, an RRS acceleration read, and a compact dashboard.
How It Works
Real Relative Strength (from original concept):
Relative momentum = (asset momentum − benchmark momentum) / average ATR × multiplier, where momentum is close − close for both the asset and the benchmark, and the divisor is the average of the asset and benchmark ATR. The result is smoothed with an EMA. Positive = the asset is outperforming the benchmark on a volatility-adjusted basis; negative = underperforming. Strong/weak zones mark RRS beyond a configurable level.
Divergence (new):
Using pivots on the smoothed RRS, a bearish divergence is flagged when RRS makes a lower pivot high while price makes a higher high; bullish when RRS makes a higher pivot low while price makes a lower low.
Second-Benchmark Agreement (new):
Optionally compute RRS against a second benchmark and only confirm a zero-cross when both agree in sign — a confluence filter against single-benchmark noise.
Signal Cooldown (new):
A minimum bar gap between confirmed zero-cross signals to prevent clustering.
RRS Acceleration (new):
The bar-to-bar change in smoothed RRS, shown as a rising/falling momentum read in the dashboard.
What Is Original (Viprasol Additions)
1. RRS/price divergence detection (regular bullish and bearish).
2. Optional second-benchmark agreement filter on zero-cross signals.
3. Signal cooldown.
4. RRS acceleration (momentum-of-RRS) state.
5. Compact relative-strength dashboard.
Key Features
From the Original:
- ATR-normalised relative strength vs a benchmark
- EMA smoothing, zero-cross arrows, strong/weak zones, extreme background tint
Added in This Version (Viprasol):
- Divergence detection, dual-benchmark agreement, cooldown, acceleration read, dashboard
- Six alerts with dynamic {{ticker}}/{{close}}/{{interval}} messages
How to Use
1. Set the benchmark to match your asset class (SPY/QQQ stocks, IWM small-caps, BTCUSD crypto).
2. Above zero (aqua/green area) = outperforming; below zero (red area) = underperforming.
3. Zero-cross arrows mark fresh shifts; circles mark divergences; the strong/weak zones flag standout strength.
Recommended Starting Points:
- Intraday (15m-1H): Length 10-14
- Swing (Daily/4H): Length 14-20
- Use dual-benchmark agreement for higher-conviction crosses
These are starting points only — backtest and adjust before trading live.
Settings
Core: benchmark symbol, momentum length, ATR multiplier, RRS smoothing.
Confluence & Filters: 2nd-benchmark agreement (+ symbol), signal cooldown, strong/weak zone level.
Divergence: detect divergence toggle, pivot length.
Visuals: zero-cross arrows, RRS line, RRS area.
Dashboard: toggle and position.
Alerts
1. Bullish Cross — now outperforming the benchmark
2. Bearish Cross — now underperforming the benchmark
3. Strong Outperformance — RRS beyond the strong level
4. Strong Underperformance — RRS below the weak level
5. Bullish Divergence — RRS/price bullish divergence
6. Bearish Divergence — RRS/price bearish divergence
All alerts include {{ticker}}, {{close}}, and {{interval}}.
Limitations & Disclaimer
- RRS uses request.security for the benchmark; benchmark data quality and session alignment affect readings, especially across asset classes/exchanges.
- Divergence uses confirmed pivots, which lag by the pivot length.
- Relative strength shows leadership, not absolute direction — a rising RRS in a falling market only means the asset is falling less.
- Past performance does not guarantee future results. This indicator is for educational purposes only and is not financial advice. Always use proper risk management and test on historical data before trading live.
Credits & Attribution
Based on the open-source "Real Relative Strength" concept (community / SMB-style), which provided the ATR-normalised relative-momentum calculation, EMA smoothing, zero-cross signals, and strong/weak zones. Added by Viprasol: RRS/price divergence detection, optional second-benchmark agreement, signal cooldown, RRS acceleration, and the dashboard.
Published open-source per TradingView House Rules.
Gösterge