
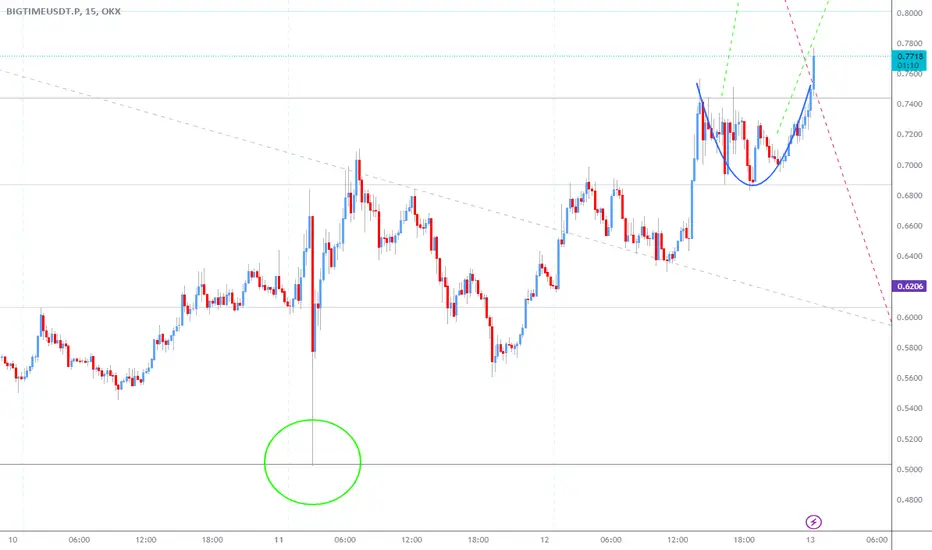
It's not a simple question and REALLY matters ALL of the time, so, finding a simple answer is a neat tool to have in the snuff-toolbox..
Here's the quickest, easiest down-n-dirry method for getting closer to an answer.
If you look at the ranging areas of the chart. The in-between, sideways, messy, wish-it-didn't-exist areas and draw a rough shape tracing the progression, then you'll likely notice either a "U" shape or an "n" shape (not everywhere, but at least one prominent one per section/timescale). You'll know if when you see it. Keep practicing and don't force it.
The U Shape can be reliably trusted to identify a Bullish trend, whilst the n Shape does the same when there's blood about.
Sound silly, right..
But it works.
And now you know..
Here's the quickest, easiest down-n-dirry method for getting closer to an answer.
If you look at the ranging areas of the chart. The in-between, sideways, messy, wish-it-didn't-exist areas and draw a rough shape tracing the progression, then you'll likely notice either a "U" shape or an "n" shape (not everywhere, but at least one prominent one per section/timescale). You'll know if when you see it. Keep practicing and don't force it.
The U Shape can be reliably trusted to identify a Bullish trend, whilst the n Shape does the same when there's blood about.
Sound silly, right..
But it works.
And now you know..
註釋
Shows up better on different timescales, so be sure to check on multiple candles to confirm..
免責聲明
這些資訊和出版物並非旨在提供,也不構成TradingView提供或認可的任何形式的財務、投資、交易或其他類型的建議或推薦。請閱讀使用條款以了解更多資訊。