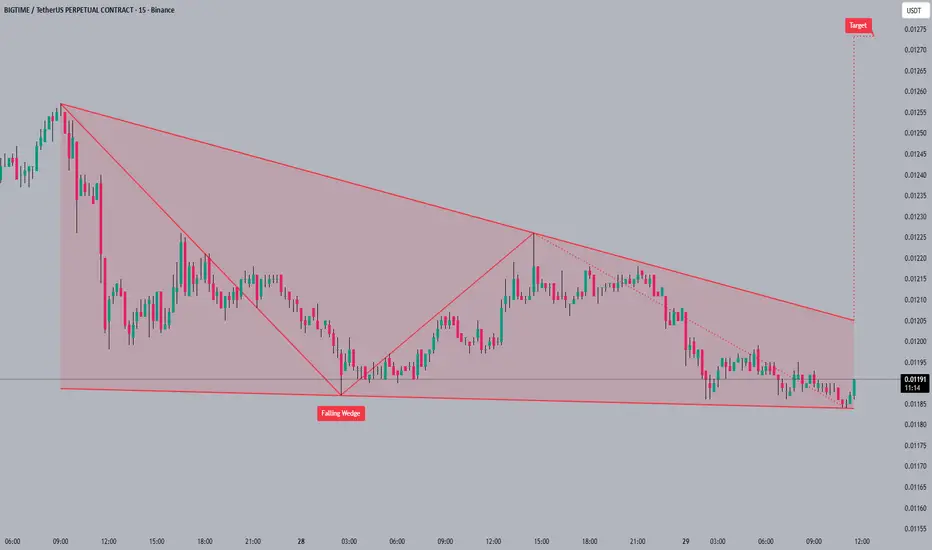
BIGTIME/USDT - Ready To Explode? Major Trendline Breakout?BIGTIME/USDT is starting to show signs of recovery after experiencing a long-term downtrend over the past several months. 🔥
On the 1D timeframe, price is currently testing a major descending trendline that has acted as strong resistance for a long time. Right now, the market is sitting at a critica
BIGTIMEUSDT Forming Bullish MomentumBIGTIMEUSDT is forming a clear bullish momentum pattern, a classic bullish reversal signal that often indicates an upcoming breakout. The price has been consolidating within a narrowing range, suggesting that selling pressure is weakening while buyers are beginning to regain control. With consistent
BIGTIMEUSDT 1DConsider buying a small bag of #BIGTIME. In case of a breakout above the resistance cluster, which includes the descending resistance, the Ichimoku Cloud, and the daily SMA50, the potential upside targets are:
🎯 $0.01474
🎯 $0.01666
🎯 $0.01822
🎯 $0.01978
🎯 $0.02199
🎯 $0.02481
⚠️ Always remember to
BIGTIMEUSDT UPDATEBIGTIME Technical Setup Pattern: Falling Wedge Breakout Current Price: $0.01300 Target Price: $0.01940 Target % Gain: 50.72% BIGTIME is breaking out of a falling wedge on the 1D timeframe with price pushing above resistance and showing early bullish momentum, structure suggests reversal after prolon
#BIGTIME#BIGTIME is currently trading at the bottom of a falling wedge pattern 📉. The falling wedge is a bullish pattern 🐂 that typically indicates a potential breakout to the upside. The next target for #BIGTIME after breaking out of the wedge is around 0.01275 🚀.
It's important to be patient and wait for
BIGTIME is on the verge of a price explosion (4H)The price has broken an important trendline, formed a bullish CH, and swept the liquidity pool at the bottom of the chart.
On the pullback to the two entry points we’ve marked, the position can be entered using DCA.
The targets are shown on the chart.
targets: 0.01406$ _ 0.01455$ _ 0.01501
A daily
BIGTIME Buy/Long Signal (4H)Considering that a large portion of the previous long shadow has been filled on the chart (the extended lower line marks the bottom of the previous long shadow), the chart is expected to move toward equilibrium, and we may see recovery moves.
Additionally, the strong bearish candle has been engulfe
See all ideas
Summarizing what the indicators are suggesting.
Oscillators
Neutral
SellBuy
Strong sellStrong buy
Strong sellSellNeutralBuyStrong buy
Oscillators
Neutral
SellBuy
Strong sellStrong buy
Strong sellSellNeutralBuyStrong buy
Summary
Neutral
SellBuy
Strong sellStrong buy
Strong sellSellNeutralBuyStrong buy
Summary
Neutral
SellBuy
Strong sellStrong buy
Strong sellSellNeutralBuyStrong buy
Summary
Neutral
SellBuy
Strong sellStrong buy
Strong sellSellNeutralBuyStrong buy
Moving Averages
Neutral
SellBuy
Strong sellStrong buy
Strong sellSellNeutralBuyStrong buy
Moving Averages
Neutral
SellBuy
Strong sellStrong buy
Strong sellSellNeutralBuyStrong buy
Displays a symbol's price movements over previous years to identify recurring trends.