
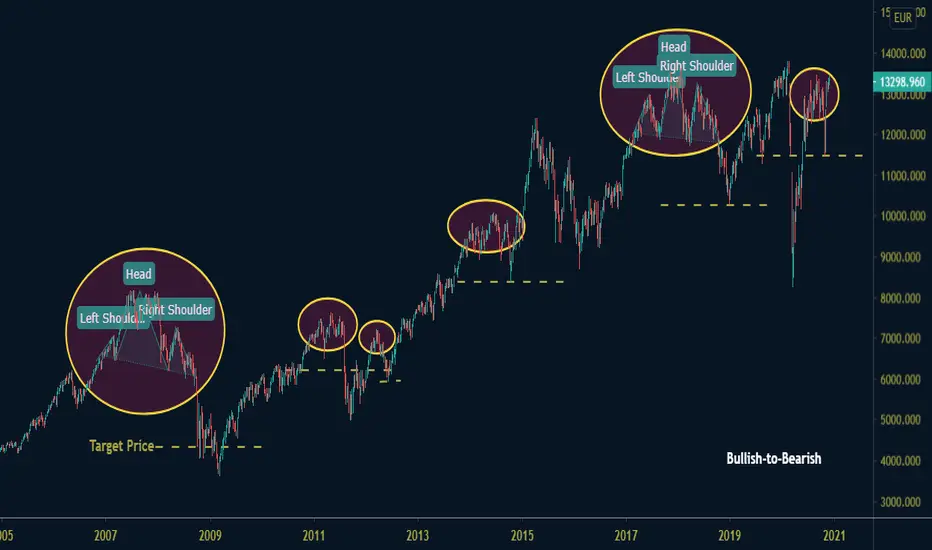
A Head and Shoulders pattern is a chart formation that appears as a baseline with three peaks, the outside two are close in height and the middle is highest. In Technical Analysis, it describes a specific chart formation that predicts a trend reversal. The head and shoulders pattern is one of the most used reversal patterns because of its good reliability.
Here the example of the DAX index, where the pattern has been effective 6 times in the last 13 years (Bullish-to-Bearish case).
Here the example of the DAX index, where the pattern has been effective 6 times in the last 13 years (Bullish-to-Bearish case).

免責聲明
這些資訊和出版物並非旨在提供,也不構成TradingView提供或認可的任何形式的財務、投資、交易或其他類型的建議或推薦。請閱讀使用條款以了解更多資訊。
免責聲明
這些資訊和出版物並非旨在提供,也不構成TradingView提供或認可的任何形式的財務、投資、交易或其他類型的建議或推薦。請閱讀使用條款以了解更多資訊。