
Stitch Fix is in the midst of an explosive rally, and now the shares are pulling back.
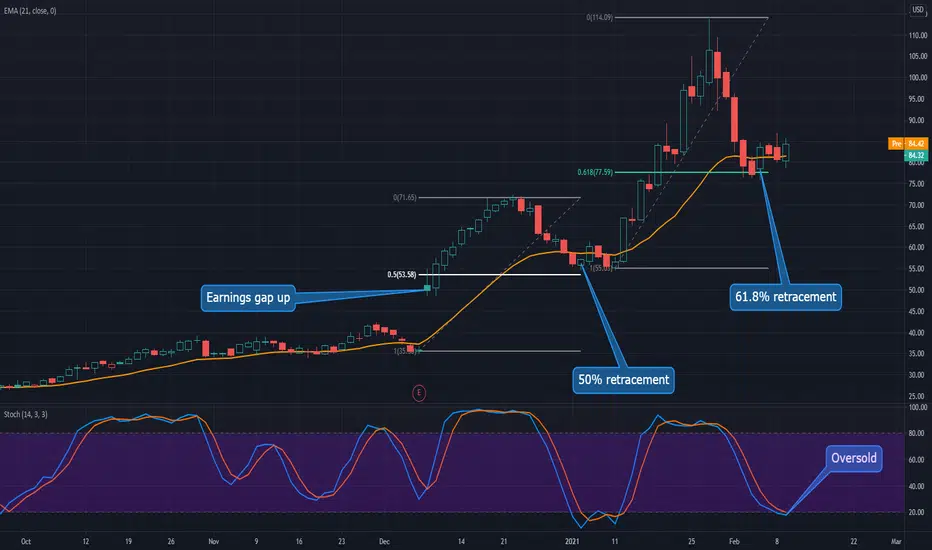
This chart compares the current pullback with the previous bounce that began on January 12.
First, notice that SFIX retraced about half its move between December 7-22. It’s currently relinquished a similar amount (61.8%) of its second move January 12-27. That may suggest the pullback has reached its limit.
Second, notice how price stabilized at the 21-day exponential moving average (EMA) in mid-January. It’s currently flattening around the same line.
Third, stochastics were oversold before the last bounce and now they’re returning to an oversold condition.
Traders might have wanted a deeper pullback toward the December high around $70, but stocks as bullish as SFIX don’t always oblige. It also has significant short interest (19 percent of the float in mid-January).
TradeStation is a pioneer in the trading industry, providing access to stocks, options, futures and cryptocurrencies. See our Overview for more.
This chart compares the current pullback with the previous bounce that began on January 12.
First, notice that SFIX retraced about half its move between December 7-22. It’s currently relinquished a similar amount (61.8%) of its second move January 12-27. That may suggest the pullback has reached its limit.
Second, notice how price stabilized at the 21-day exponential moving average (EMA) in mid-January. It’s currently flattening around the same line.
Third, stochastics were oversold before the last bounce and now they’re returning to an oversold condition.
Traders might have wanted a deeper pullback toward the December high around $70, but stocks as bullish as SFIX don’t always oblige. It also has significant short interest (19 percent of the float in mid-January).
TradeStation is a pioneer in the trading industry, providing access to stocks, options, futures and cryptocurrencies. See our Overview for more.

免責聲明
這些資訊和出版物並非旨在提供,也不構成TradingView提供或認可的任何形式的財務、投資、交易或其他類型的建議或推薦。請閱讀使用條款以了解更多資訊。
免責聲明
這些資訊和出版物並非旨在提供,也不構成TradingView提供或認可的任何形式的財務、投資、交易或其他類型的建議或推薦。請閱讀使用條款以了解更多資訊。