
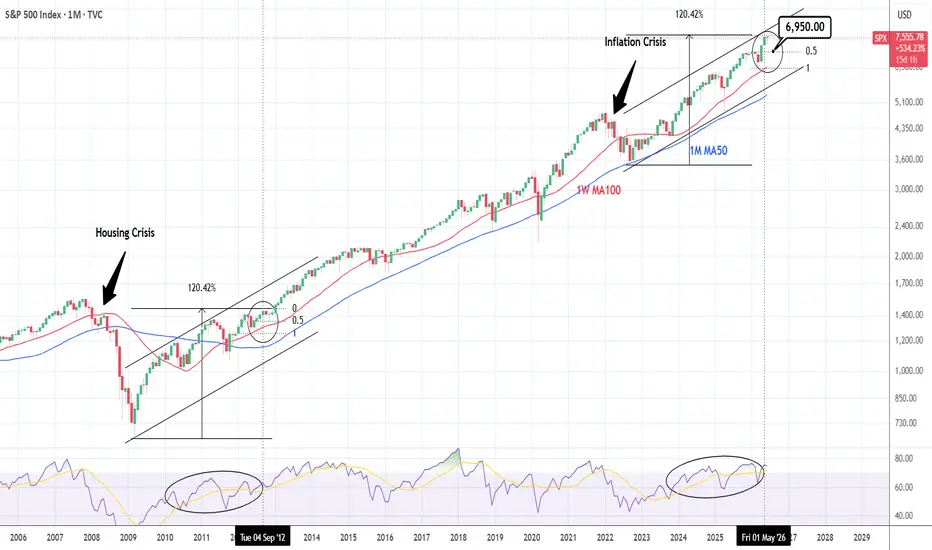
S&P500 turned bullish again on its 1D technical outlook (RSI = 62.929, MACD = 51.490, ADX = 31.929) with 1W RSI almost overbought (68.394) and 1M already significantly overbought (74.222). The amazing Bull Cycle that the index has enjoyed since the 2022 Inflation Crisis, is very similar to the one the followed the 2008 Housing Crisis. Both crisis bottoms produced Channel up patterns that, made +120.40% rises. Based on their current symmetry, the market could make a medium term pull back towards the 0.5 Fibonacci of the recent low and the 1W MA100, as it appears that we could be on a similar spot as September 2012. The identical 1M RSI fractals further validate that. Consequently, according to all the above, we are currently bearish, TP = 6,950.
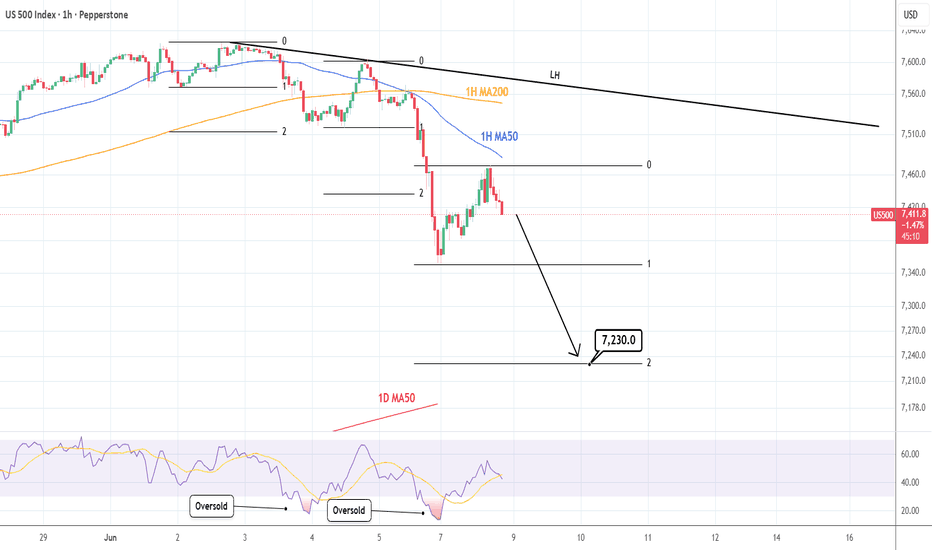
See how our prior idea has worked out:
## If you like our free content follow our profile to get more daily ideas. ##
## Comments and likes are greatly appreciated. ##
See how our prior idea has worked out:
## If you like our free content follow our profile to get more daily ideas. ##
## Comments and likes are greatly appreciated. ##

I trade Crypto, Forex, Indices & Commodities all from one account on PrimeXBT with TradingView charts
Register here👉 investingscope.s.gy/PrimeXBT
Contact me for Account Management (+15% monthly profit)
Telegram👉 t.me/investingscope
Register here👉 investingscope.s.gy/PrimeXBT
Contact me for Account Management (+15% monthly profit)
Telegram👉 t.me/investingscope
免責聲明
這些資訊和出版物並非旨在提供,也不構成TradingView提供或認可的任何形式的財務、投資、交易或其他類型的建議或推薦。請閱讀使用條款以了解更多資訊。
I trade Crypto, Forex, Indices & Commodities all from one account on PrimeXBT with TradingView charts
Register here👉 investingscope.s.gy/PrimeXBT
Contact me for Account Management (+15% monthly profit)
Telegram👉 t.me/investingscope
Register here👉 investingscope.s.gy/PrimeXBT
Contact me for Account Management (+15% monthly profit)
Telegram👉 t.me/investingscope
免責聲明
這些資訊和出版物並非旨在提供,也不構成TradingView提供或認可的任何形式的財務、投資、交易或其他類型的建議或推薦。請閱讀使用條款以了解更多資訊。