
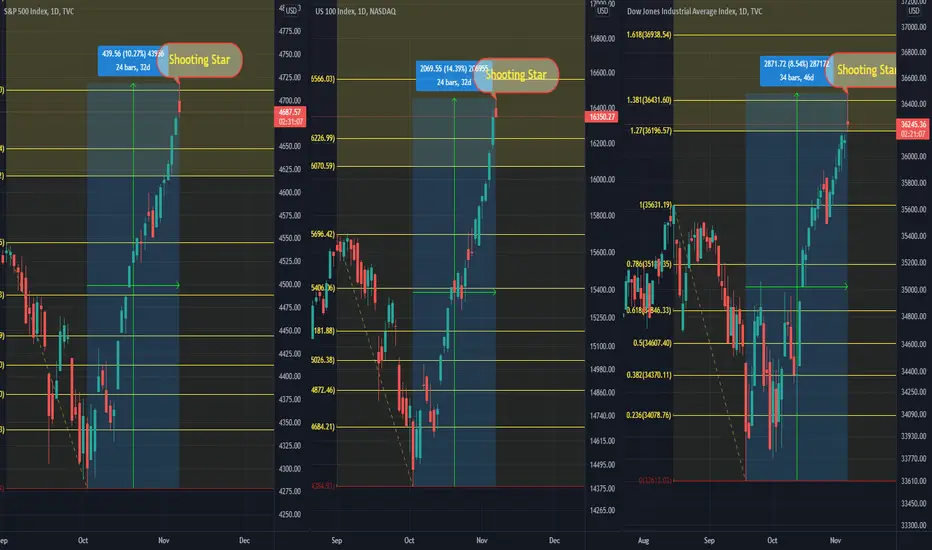
The past 24 days were one of the best trading weeks in 2021.
SPX gained +10%, Nasdaq 100 +14% and DJI +8.55 in this period.
However, Today's pattern is not good at all in short term..! I think we will see a correction in the next 1-2 weeks!
SPXU, SQQQ, and SDOW could be a good choice to hedge the portfolio or gain from a possible correction in short term!
What is a Shooting Star pattern?
A shooting star occurs after an advance and indicates the price could start falling.
The formation is bearish because the price tried to rise significantly during the day, but then the sellers took over and pushed the price back down toward the open.
Traders typically wait to see what the next candle (period) does following a shooting star. If the price declines during the next period they may sell or short.
If the price rises after a shooting star, the formation may have been a false signal or the candle is marking a potential resistance area around the price range of the candle. (Investopedia)
Best,
Moshkelgosha
DISCLAIMER
I’m not a certified financial planner/a certified financial analyst, an economist, a CPA, an accountant, or a lawyer. I’m not a finance professional through formal education. The contents on this site are for informational purposes only and do not constitute financial, accounting, or legal advice. I can’t promise that the information shared on my posts is appropriate for you or anyone else. By using this site, you agree to hold me harmless from any ramifications, financial or otherwise, that occur to you as a result of acting on information found on this site.
Reference Article:
https://www.investopedia.com/terms/s/shootingstar.asp
SPX gained +10%, Nasdaq 100 +14% and DJI +8.55 in this period.
However, Today's pattern is not good at all in short term..! I think we will see a correction in the next 1-2 weeks!
SPXU, SQQQ, and SDOW could be a good choice to hedge the portfolio or gain from a possible correction in short term!
What is a Shooting Star pattern?
A shooting star occurs after an advance and indicates the price could start falling.
The formation is bearish because the price tried to rise significantly during the day, but then the sellers took over and pushed the price back down toward the open.
Traders typically wait to see what the next candle (period) does following a shooting star. If the price declines during the next period they may sell or short.
If the price rises after a shooting star, the formation may have been a false signal or the candle is marking a potential resistance area around the price range of the candle. (Investopedia)
Best,
Moshkelgosha
DISCLAIMER
I’m not a certified financial planner/a certified financial analyst, an economist, a CPA, an accountant, or a lawyer. I’m not a finance professional through formal education. The contents on this site are for informational purposes only and do not constitute financial, accounting, or legal advice. I can’t promise that the information shared on my posts is appropriate for you or anyone else. By using this site, you agree to hold me harmless from any ramifications, financial or otherwise, that occur to you as a result of acting on information found on this site.
Reference Article:
https://www.investopedia.com/terms/s/shootingstar.asp

Use the following link to access trading ideas: patreon.com/SniperTraderStocks?utm_medium=unknown&utm_source=join_link&utm_campaign=creatorshare_creator&utm_content=copyLink
免責聲明
這些資訊和出版物並非旨在提供,也不構成TradingView提供或認可的任何形式的財務、投資、交易或其他類型的建議或推薦。請閱讀使用條款以了解更多資訊。
Use the following link to access trading ideas: patreon.com/SniperTraderStocks?utm_medium=unknown&utm_source=join_link&utm_campaign=creatorshare_creator&utm_content=copyLink
免責聲明
這些資訊和出版物並非旨在提供,也不構成TradingView提供或認可的任何形式的財務、投資、交易或其他類型的建議或推薦。請閱讀使用條款以了解更多資訊。