
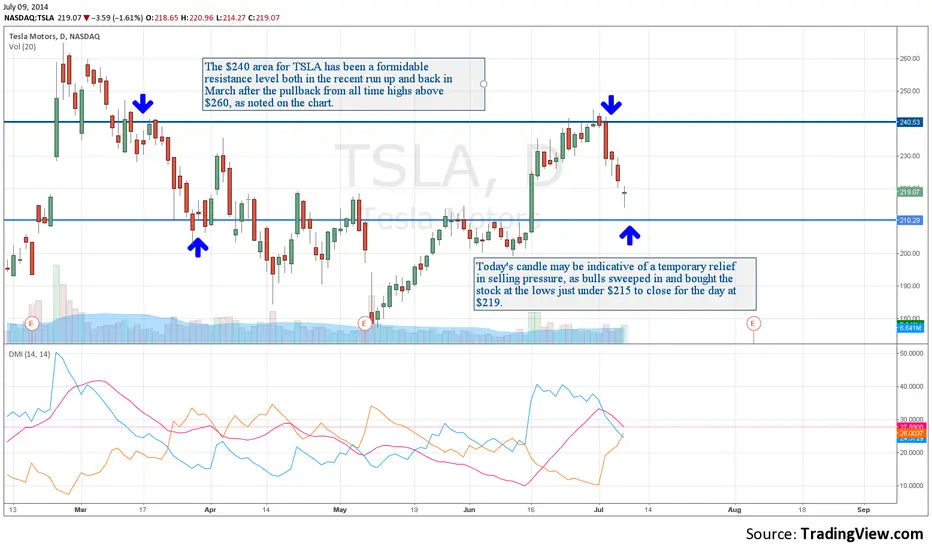
The $240 area for TSLA has been a formidable resistance level both in the recent run up as well as back in March after the pullback from all time highs above $260, as noted on the chart.
Today's candle may be indicative of a temporary relief in selling pressure, as bulls swept in and bought the stock at the lows just under $215 to close for the day at $219.
If the overall markets continue to pullback, it will be interesting to see if the stock can hold the $210 area, as this was the breakout level for June run up.
Blog post dated: 07/08/2014: syncubate.com/blog/2014/7/8/tsla-resistance-overhead
Today's candle may be indicative of a temporary relief in selling pressure, as bulls swept in and bought the stock at the lows just under $215 to close for the day at $219.
If the overall markets continue to pullback, it will be interesting to see if the stock can hold the $210 area, as this was the breakout level for June run up.
Blog post dated: 07/08/2014: syncubate.com/blog/2014/7/8/tsla-resistance-overhead

免責聲明
這些資訊和出版物並非旨在提供,也不構成TradingView提供或認可的任何形式的財務、投資、交易或其他類型的建議或推薦。請閱讀使用條款以了解更多資訊。