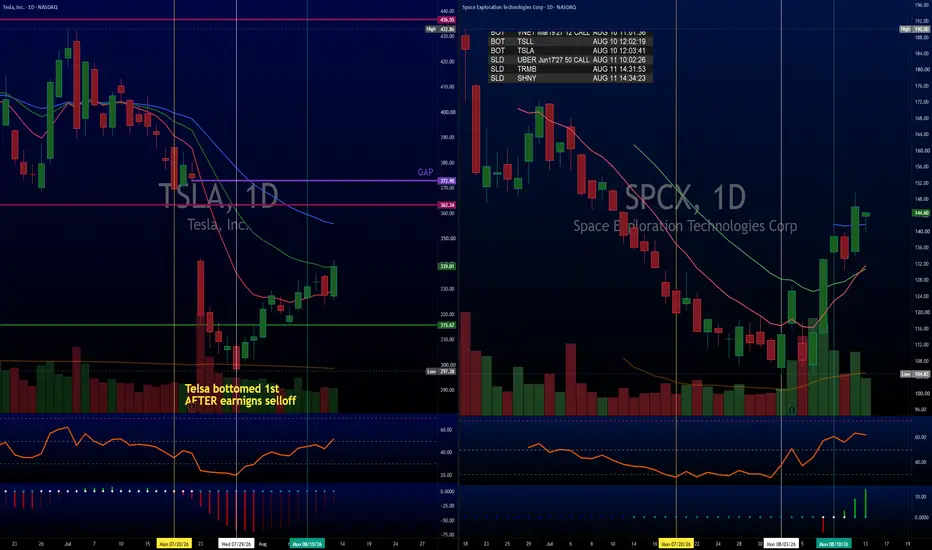
 SPCX Technical Setup
Strong momentum reversal: The chart setup has improved significantly after finding support near $105.
TTM Squeeze: Turned green, shows active increase in buying momentum.
RSI indicator: Leading the recovery, crossing above 50 and holding higher for multiple sessions.
Moving averages: Price reclaimed short term trend lines with a clear bullish crossover.
 TSLA Technical Setup
Catching up: TSLA set its floor first after the post earnings selloff and is steadily building higher lows.
RSI indicator: Strengthening quickly as it crosses back above the key 50 level.
TTM Squeeze: Histogram turned blue, which gives a green light that negative pressure is fading.
Moving averages: Trading above short term support lines, with a full bullish crossover remaining the next milestone.
The Takeaway
SPCX showed a sharper short term bounce, but TSLA continues to look like the better risk to reward play. Entering around the August 10 consolidation zone near $329. TSLA sits right underneath an unfilled earnings gap with proven fundamental support, making it the preferred core hold. OPINION.
TGtg!

免責聲明
這些資訊和出版物並非旨在提供,也不構成TradingView提供或認可的任何形式的財務、投資、交易或其他類型的建議或推薦。請閱讀使用條款以了解更多資訊。