
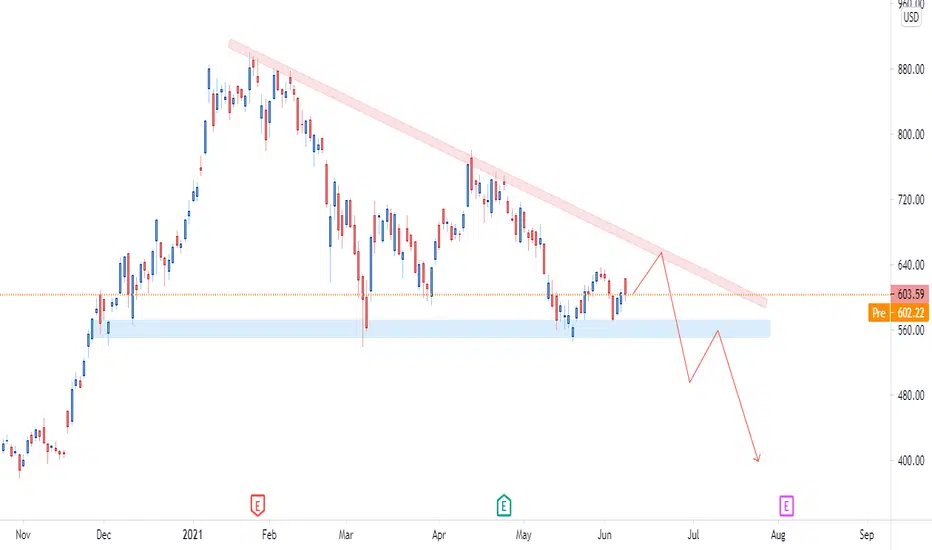
Here is our weekly outlook for Tesla stock. We can notice the descending triangle pattern right away from the first glance. The descending triangles usually indicate a bullish breakout. In our case the price is expected to hit down to 500$; however, this is most likely to be followed by a retest/correction at 550$. Overall, long-term our bias stays bullish on Tesla as they continue to open more factories; however, this doesn’t mean that we don’t monitor the market for better entries to our portfolio. If you’re looking to secure some profits and re-enter the trade a little further this is your sign to do so.

免責聲明
這些資訊和出版物並非旨在提供,也不構成TradingView提供或認可的任何形式的財務、投資、交易或其他類型的建議或推薦。請閱讀使用條款以了解更多資訊。