
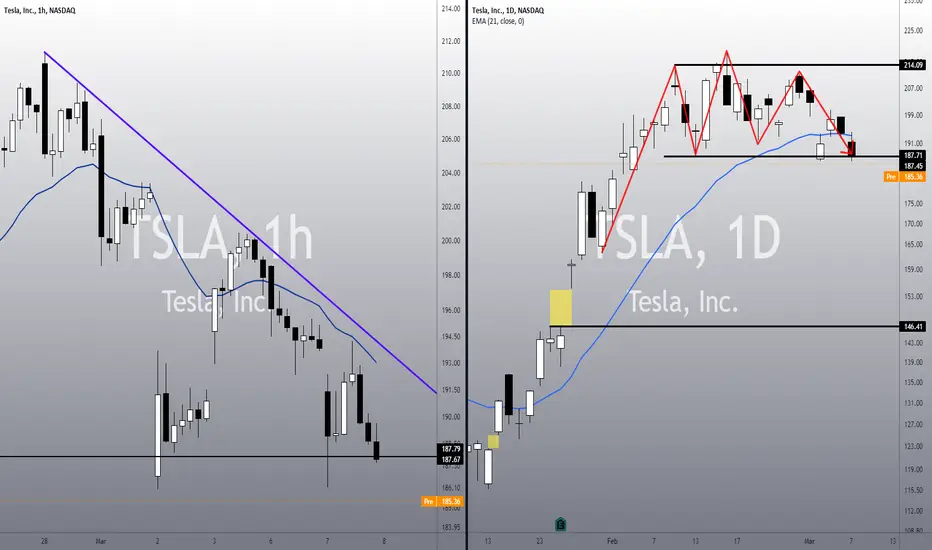
• TSLA is still dropping, and although it is in a support area, there’s no bullish reaction confirming a bottom sign yet;
• The key support is the $187, which is the baseline of a this congestion, and if TSLA loses it, we might see a bearish reversal structure;
• What’s more, the $187 could be the neckline of a Head & Shoulders chart pattern;
• If TSLA turns bearish, I see it filling the previous gap at $146 in the next few weeks;
• In order to avoid this scenario, TSLA would have to do a very good bullish reaction as soon as possible, and break its main resistance area;
• The main resistance area on TSLA is made by 3 resistances that are very close to each other: In the 1h chart, there’s the 21 ema and the purple trend line connecting the previous tops; In the daily chart, there’s the 21 ema. Only if TSLA breaks this resistance area we would see a frustration of this bearish thesis.
Remember to follow me to keep in touch with my daily analysis!

免責聲明
這些資訊和出版物並非旨在提供,也不構成TradingView提供或認可的任何形式的財務、投資、交易或其他類型的建議或推薦。請閱讀使用條款以了解更多資訊。