
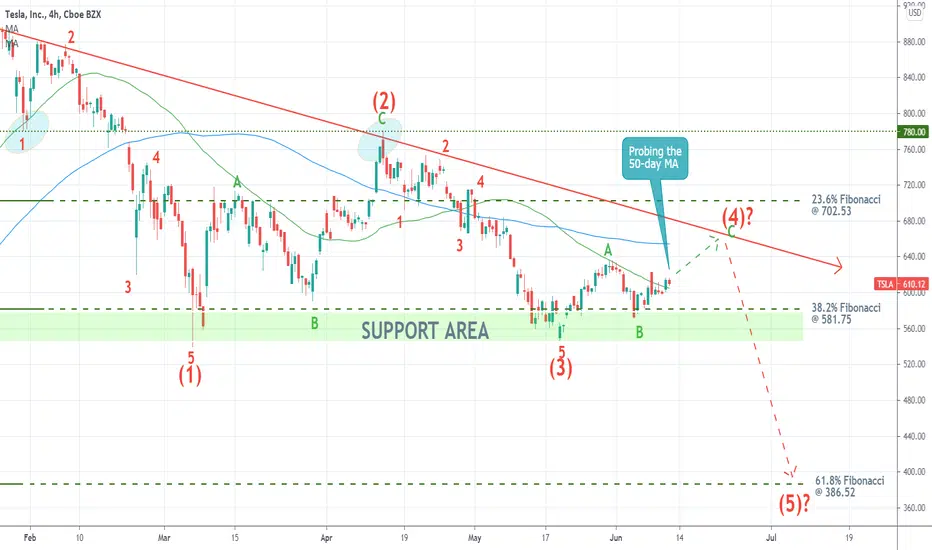
Tesla's shares are currently consolidating above the 38.2 per cent Fibonacci retracement level at 581.75.
Given the expectations of the Elliott Wave Theory, the price action could establish another upswing towards the descending trend line (in red). This would represent the second retracement leg (3-4) of the broader pattern.
A potential reversal from the trend line could entail a likely dropdown towards the 61.8 per cent Fibonacci retracement at 386.52. This would manifest the final impulse leg (4-5).
Given the expectations of the Elliott Wave Theory, the price action could establish another upswing towards the descending trend line (in red). This would represent the second retracement leg (3-4) of the broader pattern.
A potential reversal from the trend line could entail a likely dropdown towards the 61.8 per cent Fibonacci retracement at 386.52. This would manifest the final impulse leg (4-5).

免責聲明
這些資訊和出版物並非旨在提供,也不構成TradingView提供或認可的任何形式的財務、投資、交易或其他類型的建議或推薦。請閱讀使用條款以了解更多資訊。