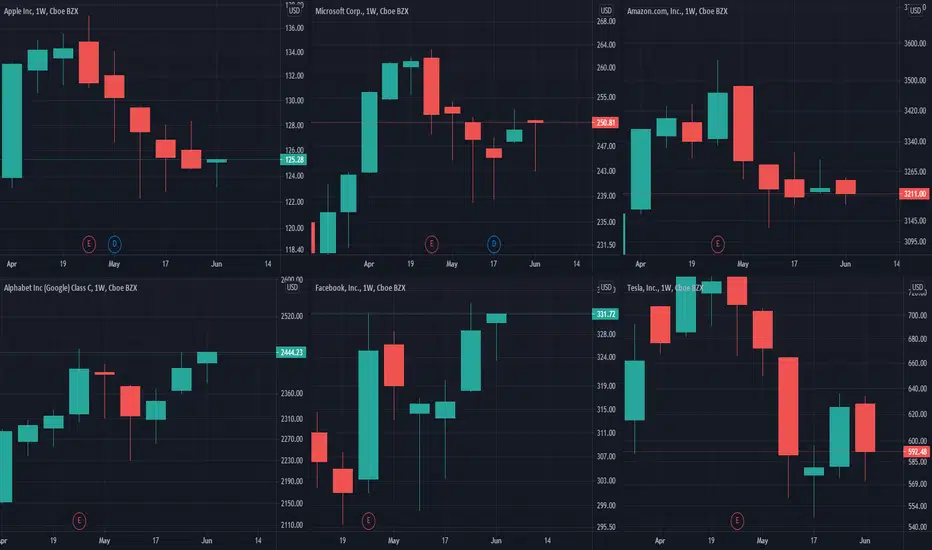
I believe it is good to review how functional our analysis is.
I want to share the multi-timeframe analysis I published last week for my Patrons/private subscribers, and let you judge the accuracy of the contents!
Some People think I publish my post to bait people to subscribe to my services!
I challenge them to publish their own analysis and next week we will review whose work has a higher rate of accuracy!
 AAPL
AAPL
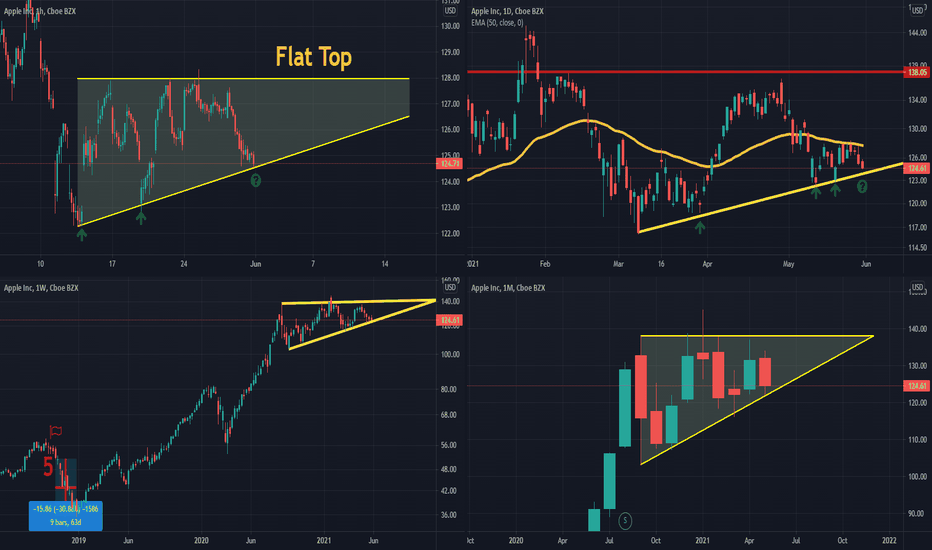
Multi-Timeframe Analysis:
Hourly Chart: Flat Top (Neutral)
Daily Chart: Flat Top (Neutral), rejected from 50 EMA, trading near its support level
Weekly Chart: Flat Top (Neutral) 5 red weeks in a row, last time it happened was October 2018, followed by a 30% correction ( Bearish )
Monthly Chart: Flat Top (Neutral)
Daily average trading value (YTD): Trading 32% below YTD (money outflow) ( Bearish )
Weekly average trading value: lowest since November 2020, 38% below last trading year. ( Bearish )
Monthly average trading value: lowest since February 2020. ( Bearish )
Conclusion: Wait to see if Apple can hold its support line, (be ready for closing your positions if you have the stock)
The most concerning point is :
Whenever Apple's average trading value dropped below its 12 monthly average we saw a correction to the level of 50 EMA /monthly.
 MSFT
MSFT
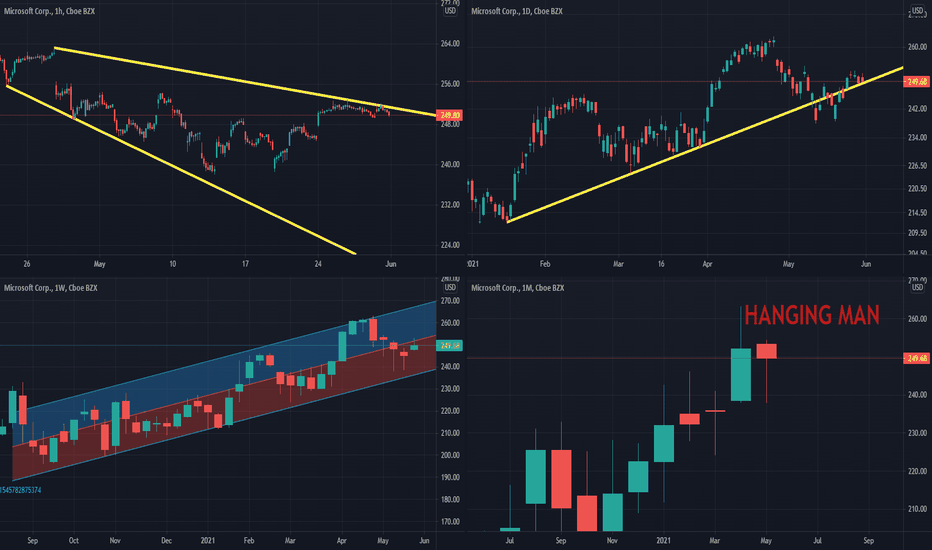
Multi-Timeframe Analysis:
Hourly Chart: Ranged below the resistance level (Neutral- Bearish )
Daily Chart: At the support line since Jan 15th, 2021 (Neutral)
Weekly Chart: after 4 negative weeks in a row, slightly positive(1.85)
Daily average trading value (YTD): Trading 33% below YTD (money outflow) ( Bearish )
Weekly average trading value: Trading 24% below last trading year average. (money outflow) ( Bearish )
Monthly average trading value: Trading 14% below last trading year average. (money outflow) ( Bearish )
Conclusion: Wait for reaction to support line. The decreased trading value is seen in all levels (D/W/M) is a concerning pattern!
 AMZN
AMZN
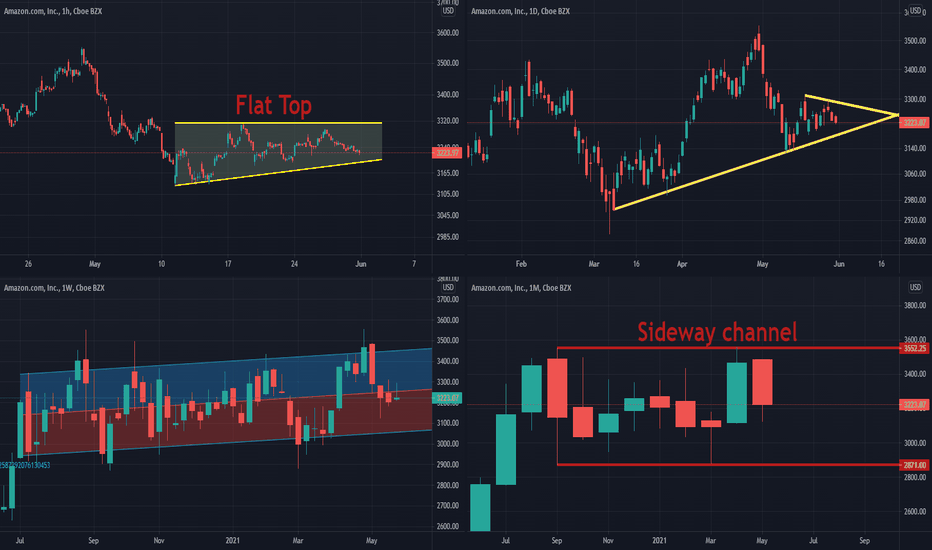
Multi-Timeframe Analysis:
Hourly Chart: Flat Top (Neutral)
Daily Chart: Moving toward its support line. (Neutral- Bearish )
Weekly Chart: Doji at the middle of the regression channel (Neutral)
Monthly Chart: Pure sideway between 3550-2870 in the past 9 months. (Neutral)
Daily average trading value (YTD): Trading 37% below YTD (money outflow) ( Bearish )
Weekly average trading value: Trading36% below last trading year average. (money outflow) ( Bearish )
Monthly average trading value: Trading 15% below last trading year average. (money outflow) ( Bearish )
Conclusion: Neutral to Bearish in a sideway channel
 GOOG
GOOG
Multi-Timeframe Analysis:
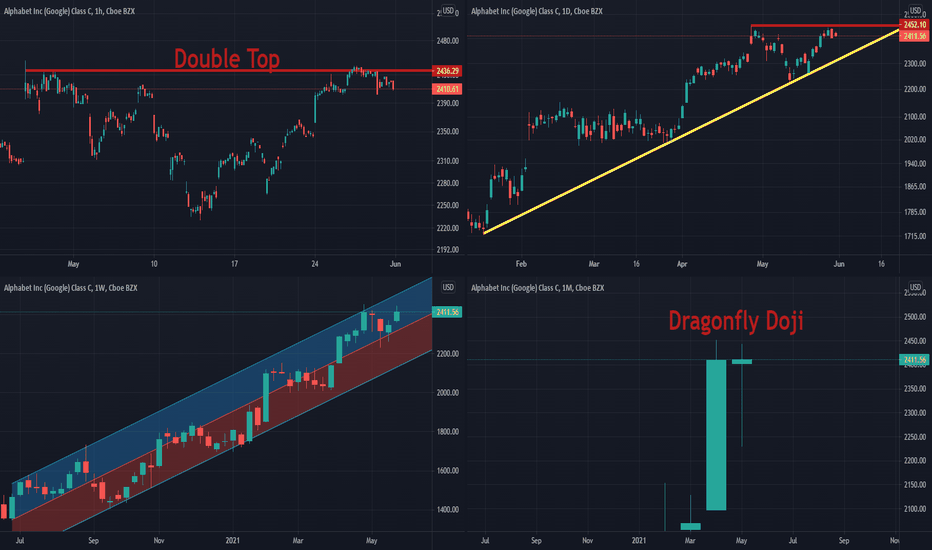
Hourly Chart: double Top with signs of rejection! ( Bearish )
Daily Chart: Bearish engulfing followed by bearish harami. ( Bearish )
Weekly Chart: bullish regression channel
Monthly Chart: Dragonfly Doji .
Daily average trading value (YTD): Trading 9% below YTD (money outflow) ( Bearish )
Weekly average trading value: Trading 7% above last trading year average. (money inflow) ( Bullish )
Monthly average trading value: Trading equal to the last trading year average. (Neutral)
Conclusion: Neutral to Bearish
$NASDAQ:FB
Multi-Timeframe Analysis:
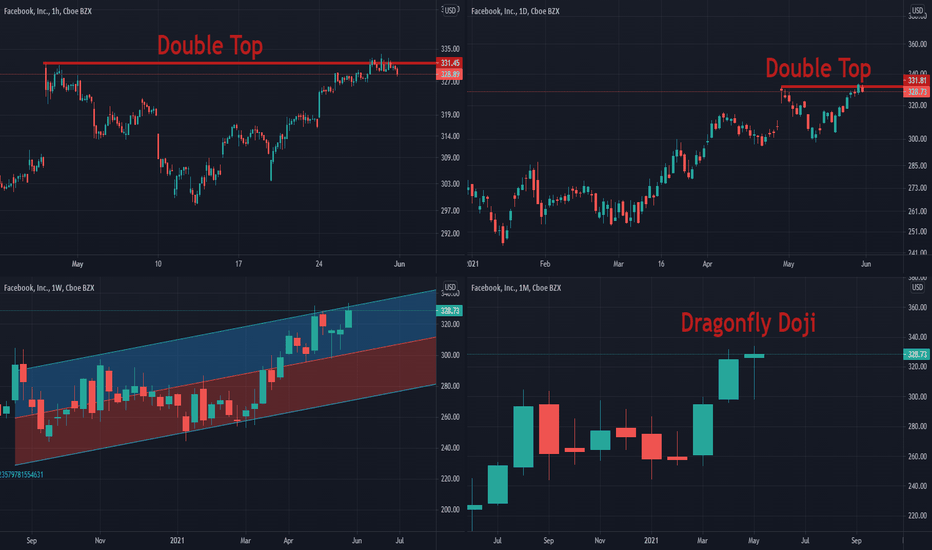
Hourly Chart: Double Top ( Bearish )
Daily Chart: Double Top ( Bearish )
Weekly Chart: at the top of the regression channel ( Bearish )
Monthly Chart: Dragonfly Doji , possible reversal??? (Neutral-Bearish)
Daily average trading value (YTD): Trading 32 % below YTD (money outflow) ( Bearish )
Weekly average trading value: Trading 12% below the last trading year average. (money outflow) ( Bearish )
Monthly average trading value: Trading 5.5% below last trading year average. (money outflow) ( Bearish )
Conclusion: wait for reversal confirmation ( Neutral- Bearish )
 TSLA
TSLA
Multi-Timeframe Analysis:
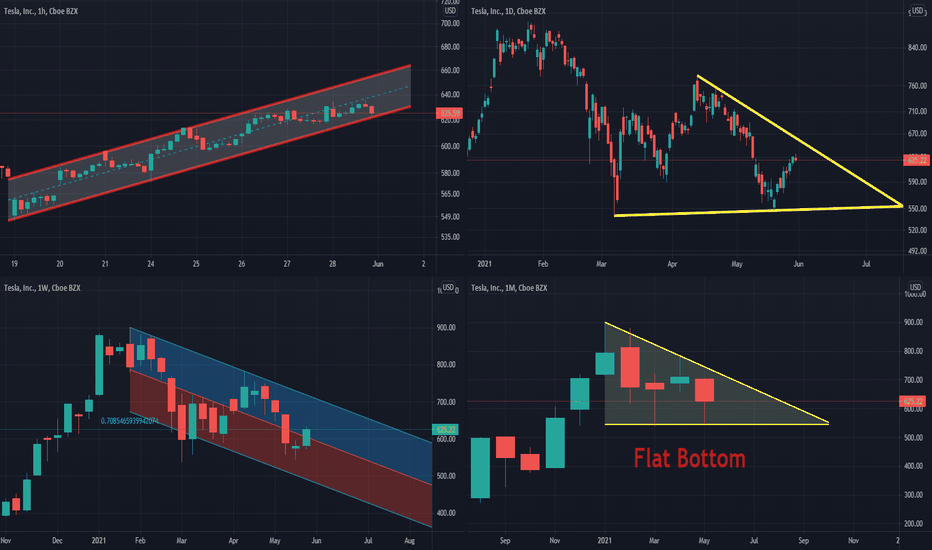
Hourly Chart: at the support level of a short-time bullish trend started 12 days ago!(Neutral)
Daily Chart: Bearish Harami and trading below 50EMA ( Bearish )
Weekly Chart: Spinning Bottom in a downward regression channel.
Monthly Chart: Flat Bottom (Neutral)
Daily average trading value (YTD): Trading 42% below YTD (money outflow) ( Bearish )
Weekly average trading value: Trading 26% below last trading year average. (money outflow) ( Bearish )
Monthly average trading value: Trading 27 % below last trading year average. (money outflow) ( Bearish )
Conclusion: Complex Correction with unpredictable moves!
what is your idea about the accuracy of these analyses???
Moshkelgosha
I want to share the multi-timeframe analysis I published last week for my Patrons/private subscribers, and let you judge the accuracy of the contents!
Some People think I publish my post to bait people to subscribe to my services!
I challenge them to publish their own analysis and next week we will review whose work has a higher rate of accuracy!
AAPLMulti-Timeframe Analysis:
Hourly Chart: Flat Top (Neutral)
Daily Chart: Flat Top (Neutral), rejected from 50 EMA, trading near its support level
Weekly Chart: Flat Top (Neutral) 5 red weeks in a row, last time it happened was October 2018, followed by a 30% correction ( Bearish )
Monthly Chart: Flat Top (Neutral)
Daily average trading value (YTD): Trading 32% below YTD (money outflow) ( Bearish )
Weekly average trading value: lowest since November 2020, 38% below last trading year. ( Bearish )
Monthly average trading value: lowest since February 2020. ( Bearish )
Conclusion: Wait to see if Apple can hold its support line, (be ready for closing your positions if you have the stock)
The most concerning point is :
Whenever Apple's average trading value dropped below its 12 monthly average we saw a correction to the level of 50 EMA /monthly.
MSFTMulti-Timeframe Analysis:
Hourly Chart: Ranged below the resistance level (Neutral- Bearish )
Daily Chart: At the support line since Jan 15th, 2021 (Neutral)
Weekly Chart: after 4 negative weeks in a row, slightly positive(1.85)
Daily average trading value (YTD): Trading 33% below YTD (money outflow) ( Bearish )
Weekly average trading value: Trading 24% below last trading year average. (money outflow) ( Bearish )
Monthly average trading value: Trading 14% below last trading year average. (money outflow) ( Bearish )
Conclusion: Wait for reaction to support line. The decreased trading value is seen in all levels (D/W/M) is a concerning pattern!
AMZNMulti-Timeframe Analysis:
Hourly Chart: Flat Top (Neutral)
Daily Chart: Moving toward its support line. (Neutral- Bearish )
Weekly Chart: Doji at the middle of the regression channel (Neutral)
Monthly Chart: Pure sideway between 3550-2870 in the past 9 months. (Neutral)
Daily average trading value (YTD): Trading 37% below YTD (money outflow) ( Bearish )
Weekly average trading value: Trading36% below last trading year average. (money outflow) ( Bearish )
Monthly average trading value: Trading 15% below last trading year average. (money outflow) ( Bearish )
Conclusion: Neutral to Bearish in a sideway channel
GOOGMulti-Timeframe Analysis:
Hourly Chart: double Top with signs of rejection! ( Bearish )
Daily Chart: Bearish engulfing followed by bearish harami. ( Bearish )
Weekly Chart: bullish regression channel
Monthly Chart: Dragonfly Doji .
Daily average trading value (YTD): Trading 9% below YTD (money outflow) ( Bearish )
Weekly average trading value: Trading 7% above last trading year average. (money inflow) ( Bullish )
Monthly average trading value: Trading equal to the last trading year average. (Neutral)
Conclusion: Neutral to Bearish
$NASDAQ:FB
Multi-Timeframe Analysis:
Hourly Chart: Double Top ( Bearish )
Daily Chart: Double Top ( Bearish )
Weekly Chart: at the top of the regression channel ( Bearish )
Monthly Chart: Dragonfly Doji , possible reversal??? (Neutral-Bearish)
Daily average trading value (YTD): Trading 32 % below YTD (money outflow) ( Bearish )
Weekly average trading value: Trading 12% below the last trading year average. (money outflow) ( Bearish )
Monthly average trading value: Trading 5.5% below last trading year average. (money outflow) ( Bearish )
Conclusion: wait for reversal confirmation ( Neutral- Bearish )
TSLAMulti-Timeframe Analysis:
Hourly Chart: at the support level of a short-time bullish trend started 12 days ago!(Neutral)
Daily Chart: Bearish Harami and trading below 50EMA ( Bearish )
Weekly Chart: Spinning Bottom in a downward regression channel.
Monthly Chart: Flat Bottom (Neutral)
Daily average trading value (YTD): Trading 42% below YTD (money outflow) ( Bearish )
Weekly average trading value: Trading 26% below last trading year average. (money outflow) ( Bearish )
Monthly average trading value: Trading 27 % below last trading year average. (money outflow) ( Bearish )
Conclusion: Complex Correction with unpredictable moves!
what is your idea about the accuracy of these analyses???
Moshkelgosha

Use the following link to access trading ideas: patreon.com/SniperTraderStocks?utm_medium=unknown&utm_source=join_link&utm_campaign=creatorshare_creator&utm_content=copyLink
相關出版品
免責聲明
這些資訊和出版物並非旨在提供,也不構成TradingView提供或認可的任何形式的財務、投資、交易或其他類型的建議或推薦。請閱讀使用條款以了解更多資訊。
Use the following link to access trading ideas: patreon.com/SniperTraderStocks?utm_medium=unknown&utm_source=join_link&utm_campaign=creatorshare_creator&utm_content=copyLink
相關出版品
免責聲明
這些資訊和出版物並非旨在提供,也不構成TradingView提供或認可的任何形式的財務、投資、交易或其他類型的建議或推薦。請閱讀使用條款以了解更多資訊。