
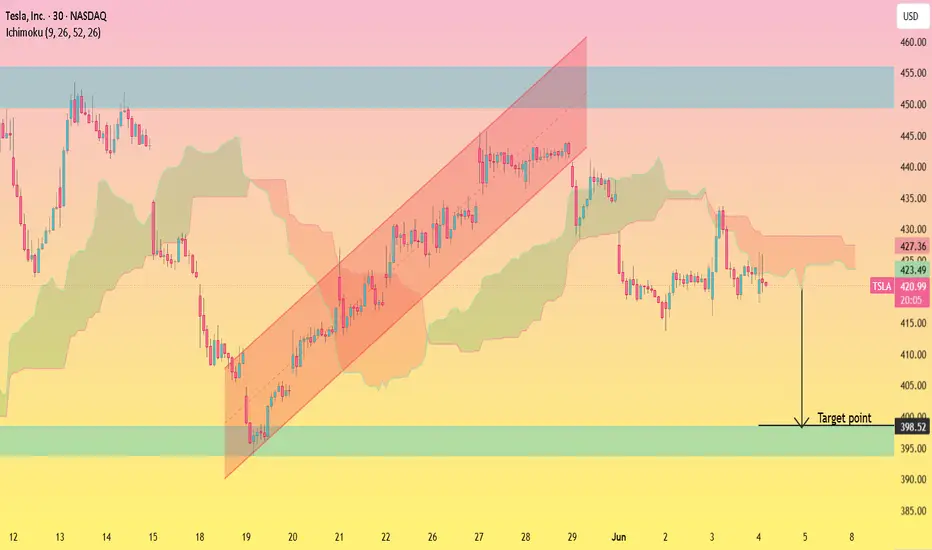
TSLA is showing signs of weakness after failing to sustain its previous bullish channel breakout. Price has moved below the Ichimoku cloud resistance and is consolidating under a key supply area, suggesting that sellers remain in control in the short term.
The chart highlights a potential bearish continuation scenario, with price likely to retrace toward the major demand zone around **398.52**. This level has previously attracted buying interest and could act as a strong support area if the decline continues.
🎯 **Target:** 398.52
📉 **Bias:** Bearish
⚠️ **Invalidation:** A sustained move back above the recent resistance zone around **435–445** would weaken the bearish outlook and signal renewed bullish momentum.
The chart highlights a potential bearish continuation scenario, with price likely to retrace toward the major demand zone around **398.52**. This level has previously attracted buying interest and could act as a strong support area if the decline continues.
🎯 **Target:** 398.52
📉 **Bias:** Bearish
⚠️ **Invalidation:** A sustained move back above the recent resistance zone around **435–445** would weaken the bearish outlook and signal renewed bullish momentum.
交易進行
my given target is achieved 交易結束:目標達成
my given target is achieved 
相關出版品
免責聲明
這些資訊和出版物並非旨在提供,也不構成TradingView提供或認可的任何形式的財務、投資、交易或其他類型的建議或推薦。請閱讀使用條款以了解更多資訊。