
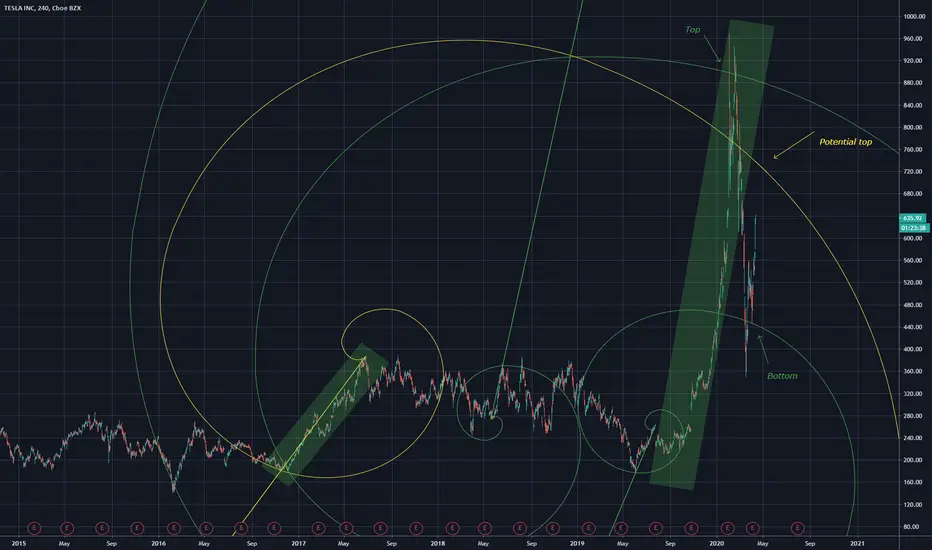
forecasting a potential top using Fibonacci spirals, and outlining how Fibonacci spirals can be used to show tops and bottoms.
For those looking to enter price is currently in a neutral zone, look for a short once the fib line is reached.
Or go long I dont really care.
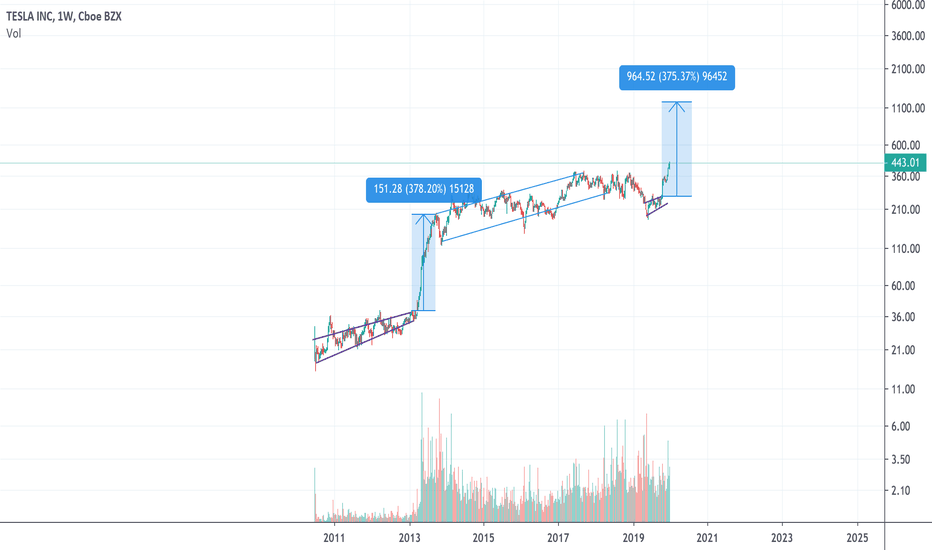
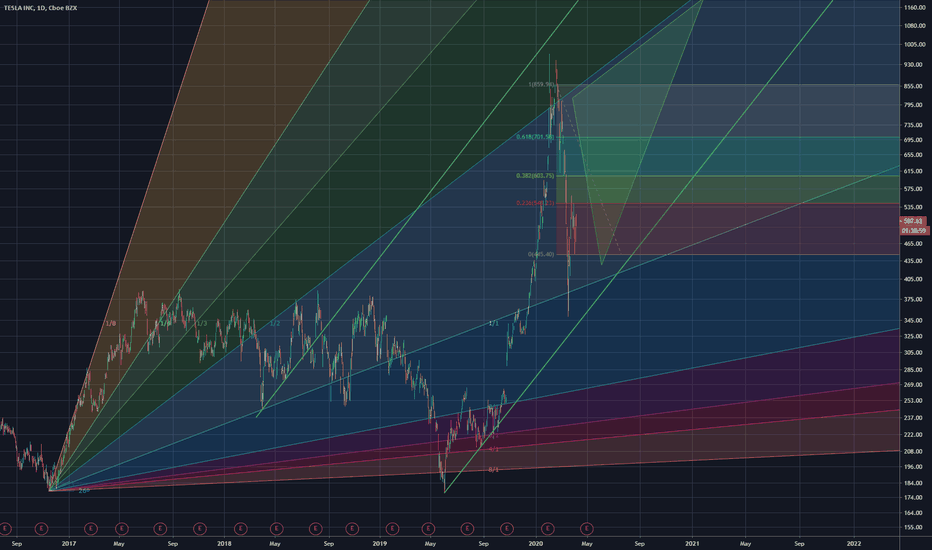
Above chart is a bit iffy, hope someone got some use out of it.
For those looking to enter price is currently in a neutral zone, look for a short once the fib line is reached.
Or go long I dont really care.
Above chart is a bit iffy, hope someone got some use out of it.

免責聲明
這些資訊和出版物並非旨在提供,也不構成TradingView提供或認可的任何形式的財務、投資、交易或其他類型的建議或推薦。請閱讀使用條款以了解更多資訊。