
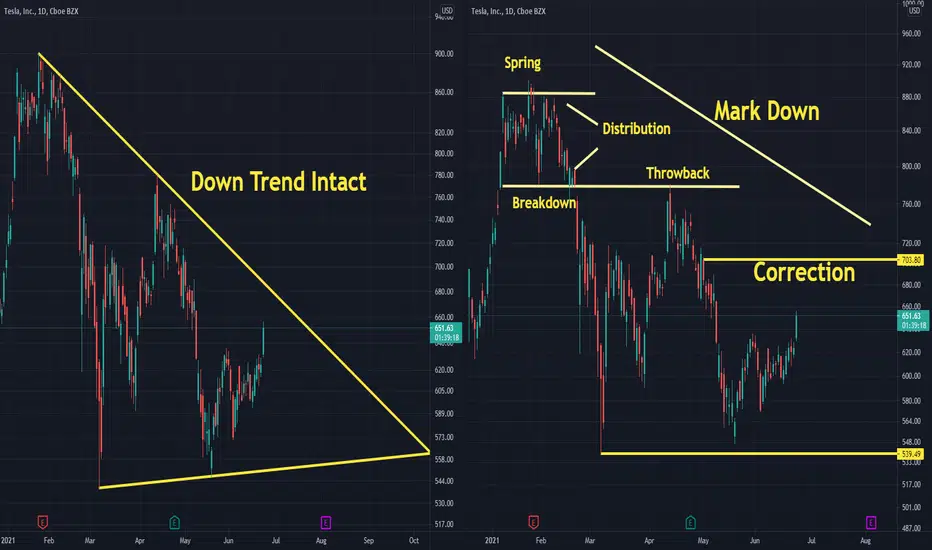
I have nothing to say, just read the article and see how many similarities exist.
I think the Tesla chart is Identical to the example chart in the article: Making Money The Wyckoff Way (CSC, DNR)
Link: https://www.investopedia.com/articles/active-trading/070715/making-money-wyckoff-way.asp
I will not surprised if tesla tests 690-700 and experience another leg down.
Moshkelgosha
I think the Tesla chart is Identical to the example chart in the article: Making Money The Wyckoff Way (CSC, DNR)
Link: https://www.investopedia.com/articles/active-trading/070715/making-money-wyckoff-way.asp
I will not surprised if tesla tests 690-700 and experience another leg down.
Moshkelgosha

Use the following link to access trading ideas: patreon.com/SniperTraderStocks?utm_medium=unknown&utm_source=join_link&utm_campaign=creatorshare_creator&utm_content=copyLink
免責聲明
這些資訊和出版物並非旨在提供,也不構成TradingView提供或認可的任何形式的財務、投資、交易或其他類型的建議或推薦。請閱讀使用條款以了解更多資訊。
Use the following link to access trading ideas: patreon.com/SniperTraderStocks?utm_medium=unknown&utm_source=join_link&utm_campaign=creatorshare_creator&utm_content=copyLink
免責聲明
這些資訊和出版物並非旨在提供,也不構成TradingView提供或認可的任何形式的財務、投資、交易或其他類型的建議或推薦。請閱讀使用條款以了解更多資訊。