
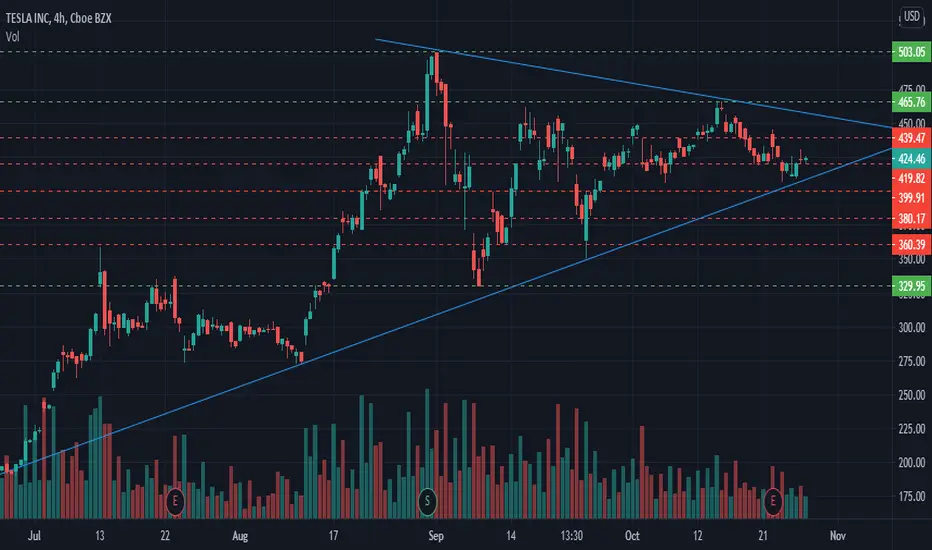
Nice Symetrical Triangle forming on the 4H/Daily charts! Could be either bullish or bearish. Looking forward to enter a small swing position when price action starts moving outside the triangle with volume!
If Bullish, the break of the 465 level could make this run all the way to ATH.
(Don't mind red levels.. I use these for intra-day trading.)
If Bullish, the break of the 465 level could make this run all the way to ATH.
(Don't mind red levels.. I use these for intra-day trading.)

免責聲明
這些資訊和出版物並非旨在提供,也不構成TradingView提供或認可的任何形式的財務、投資、交易或其他類型的建議或推薦。請閱讀使用條款以了解更多資訊。
免責聲明
這些資訊和出版物並非旨在提供,也不構成TradingView提供或認可的任何形式的財務、投資、交易或其他類型的建議或推薦。請閱讀使用條款以了解更多資訊。