
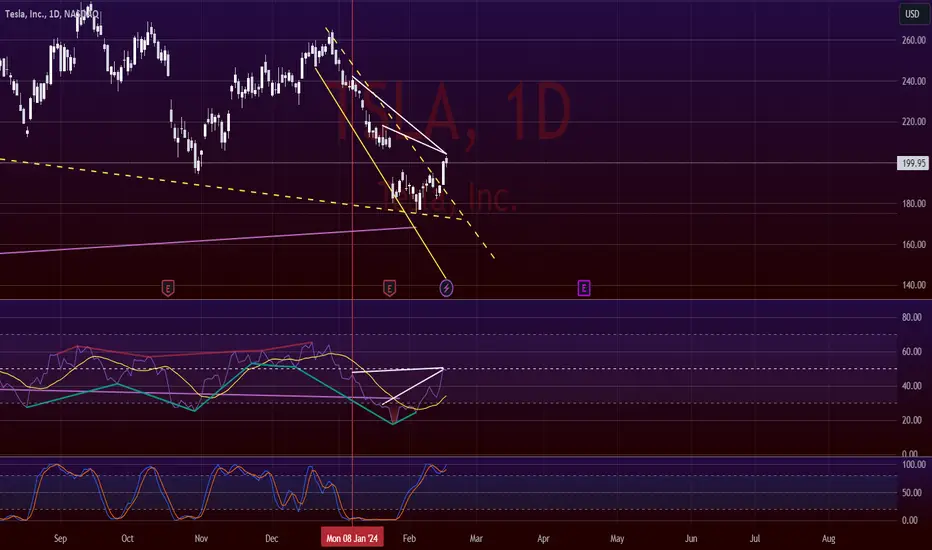
Looks like the RSI suggesting us that TSLA stock will go down to 140-150$ in upcoming week. Daily chart has bearish hidden divergence, also overbought on Stochastic RSI.
If we go down without breaking and holding 211$ the price will be rejected from 200EMA and that would be very bearish signs for Tesla.
Weekly chart looks better suggesting we will go back up fast and there shouldn't be much downside left. Putting my buy orders between 100$ to 155$
If we go down without breaking and holding 211$ the price will be rejected from 200EMA and that would be very bearish signs for Tesla.
Weekly chart looks better suggesting we will go back up fast and there shouldn't be much downside left. Putting my buy orders between 100$ to 155$

免責聲明
這些資訊和出版物並非旨在提供,也不構成TradingView提供或認可的任何形式的財務、投資、交易或其他類型的建議或推薦。請閱讀使用條款以了解更多資訊。