
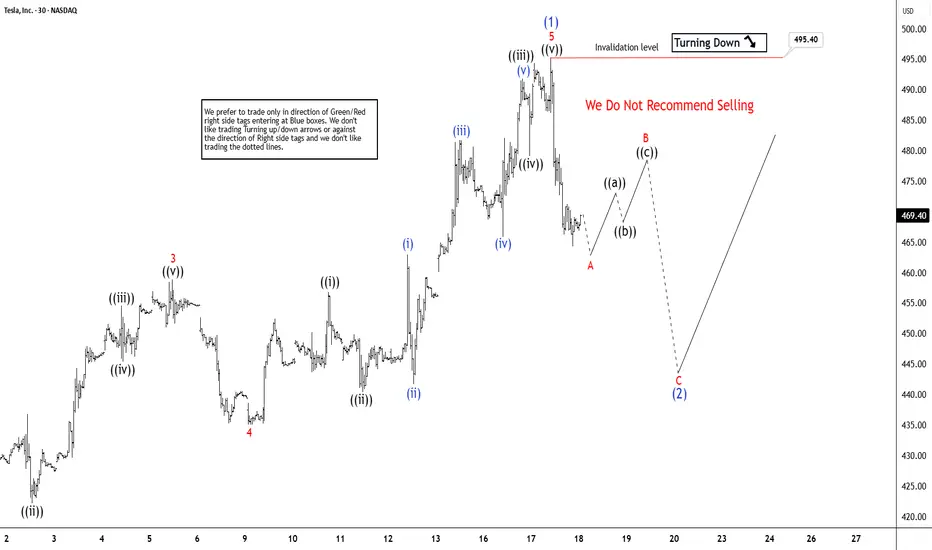
Tesla (TSLA) recently advanced to a new all‑time high, underscoring the strength of bullish momentum in the market. The short‑term Elliott Wave analysis indicates that the cycle from the November 14, 2025 low has concluded as a clear impulse structure. From that low, wave 1 terminated at $423.69, followed by a corrective decline in wave 2 that ended at $383.76. The upward progression then resumed, with wave 3 extending to $458.87. A modest pullback in wave 4 concluded at $435.
The final advance in wave 5 reached $496.16, as illustrated on the 45‑minute chart. This marked the completion of wave (1) at a higher degree and simultaneously closed the cycle that began on November 14. After this peak, the stock entered a corrective phase in wave (2), unfolding internally as a zigzag pattern. From the termination of wave (1), wave A of the zigzag is expected to finish soon. A rebound in wave B should follow, setting the stage for another decline in wave C, which would complete the corrective sequence of wave (2). As long as the pivot at $496.16 remains intact, rallies are likely to fail. The broader expectation is for Tesla to extend lower, thereby correcting the entire cycle that originated from the November 14 low.
The final advance in wave 5 reached $496.16, as illustrated on the 45‑minute chart. This marked the completion of wave (1) at a higher degree and simultaneously closed the cycle that began on November 14. After this peak, the stock entered a corrective phase in wave (2), unfolding internally as a zigzag pattern. From the termination of wave (1), wave A of the zigzag is expected to finish soon. A rebound in wave B should follow, setting the stage for another decline in wave C, which would complete the corrective sequence of wave (2). As long as the pivot at $496.16 remains intact, rallies are likely to fail. The broader expectation is for Tesla to extend lower, thereby correcting the entire cycle that originated from the November 14 low.

Intraday updates, Entries, Live Analysis, Videos, Chat room and Full Wave counts (Weekly, Daily, 4H, 1H) are in the EWF members area.
Try it for 14 days: elliottwave-forecast.com/plan-trial/?utm_source=tradingview&utm_medium=signature
Try it for 14 days: elliottwave-forecast.com/plan-trial/?utm_source=tradingview&utm_medium=signature
免責聲明
這些資訊和出版物並非旨在提供,也不構成TradingView提供或認可的任何形式的財務、投資、交易或其他類型的建議或推薦。請閱讀使用條款以了解更多資訊。
Intraday updates, Entries, Live Analysis, Videos, Chat room and Full Wave counts (Weekly, Daily, 4H, 1H) are in the EWF members area.
Try it for 14 days: elliottwave-forecast.com/plan-trial/?utm_source=tradingview&utm_medium=signature
Try it for 14 days: elliottwave-forecast.com/plan-trial/?utm_source=tradingview&utm_medium=signature
免責聲明
這些資訊和出版物並非旨在提供,也不構成TradingView提供或認可的任何形式的財務、投資、交易或其他類型的建議或推薦。請閱讀使用條款以了解更多資訊。