
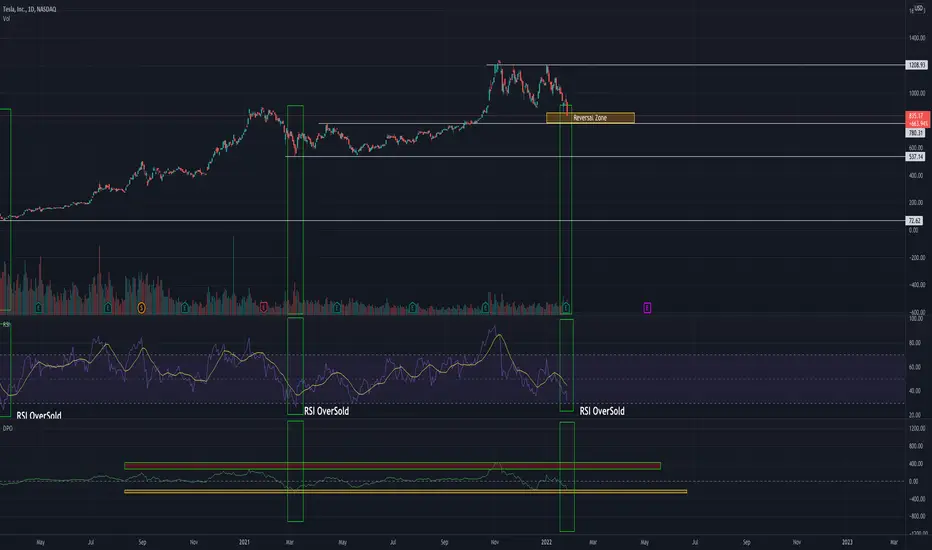
Tesla Daily Chart
The last few times, the RSI on the daily chart went under 30, it signaled the bottom of the downtrend, as well as a reversal to the upside.
I suspect Tesla could go down to $780 (Next Major Support) before bottoming out. The RSI hasn't yet gone under 30, but it is very close.
I also use the De-trended Price Oscillator to help Identify tops and bottoms. On that indicator, it is currently signaling that we are likely near the floor of this fall.
Im guessing 2022 will be a bumpy year for stocks in general, and we could see short-lived, but volatile swings in both directions.
The last few times, the RSI on the daily chart went under 30, it signaled the bottom of the downtrend, as well as a reversal to the upside.
I suspect Tesla could go down to $780 (Next Major Support) before bottoming out. The RSI hasn't yet gone under 30, but it is very close.
I also use the De-trended Price Oscillator to help Identify tops and bottoms. On that indicator, it is currently signaling that we are likely near the floor of this fall.
Im guessing 2022 will be a bumpy year for stocks in general, and we could see short-lived, but volatile swings in both directions.
註釋
Tesla's price went down to about $790 and had a strong bounce back up.For now the support has held, but it doesn't mean that we wont re-test that level again.
If the current support of $780 - $790 is broken ->
The next major area of support is between:
- $620 and $710

免責聲明
這些資訊和出版物並非旨在提供,也不構成TradingView提供或認可的任何形式的財務、投資、交易或其他類型的建議或推薦。請閱讀使用條款以了解更多資訊。
免責聲明
這些資訊和出版物並非旨在提供,也不構成TradingView提供或認可的任何形式的財務、投資、交易或其他類型的建議或推薦。請閱讀使用條款以了解更多資訊。