 TSLA
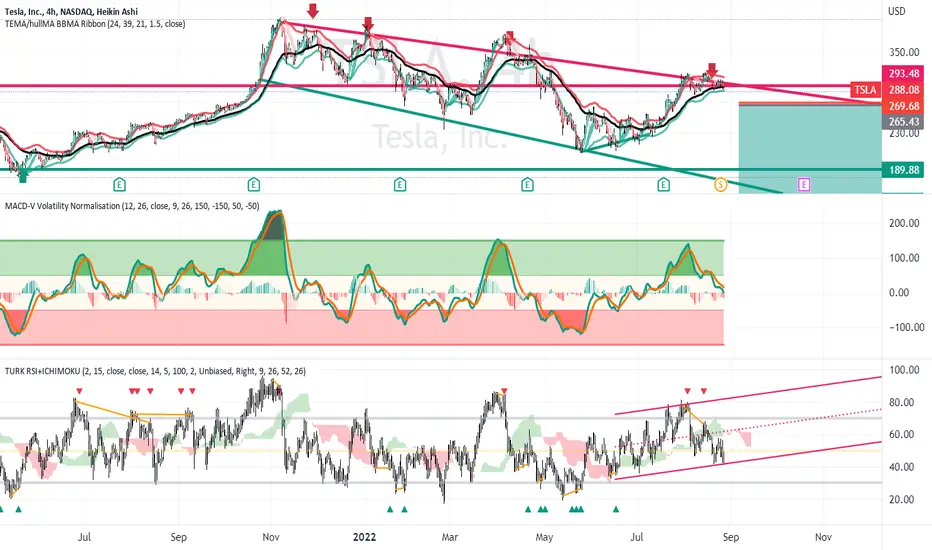
TSLA on the 4 hour chart appears to be in a downtrending parallel
channel and presently at the upper resistance boundary of
the channel. This could also be a megaphone pattern as the channel
is widening a bit as it descends. I see the horizontal resistance of February 2021
market high as resisting any breakout to higher prices.
I see horizontal support below at 190 from the market lows in March and May this year.
The MACD oscillator is in mid-range as is the RSI oscillator. The latter shows
some bearish divergence suggesting an impending reversal.
I see this as a short setup to synergize with the general market
the downturn from the current market price to 190 or until just before
the earnings report in mid-October. This is about $100 of profit
I will set a stop loss of $5 above the current market price Thid
is a great reward-to-risk ratio even if the price gets jammed up
at Fibonacci retracement levels on its way down. The low-costTR bearish ETF
is a consideration as are out of the money put options.

免責聲明
這些資訊和出版物並非旨在提供,也不構成TradingView提供或認可的任何形式的財務、投資、交易或其他類型的建議或推薦。請閱讀使用條款以了解更多資訊。
免責聲明
這些資訊和出版物並非旨在提供,也不構成TradingView提供或認可的任何形式的財務、投資、交易或其他類型的建議或推薦。請閱讀使用條款以了解更多資訊。