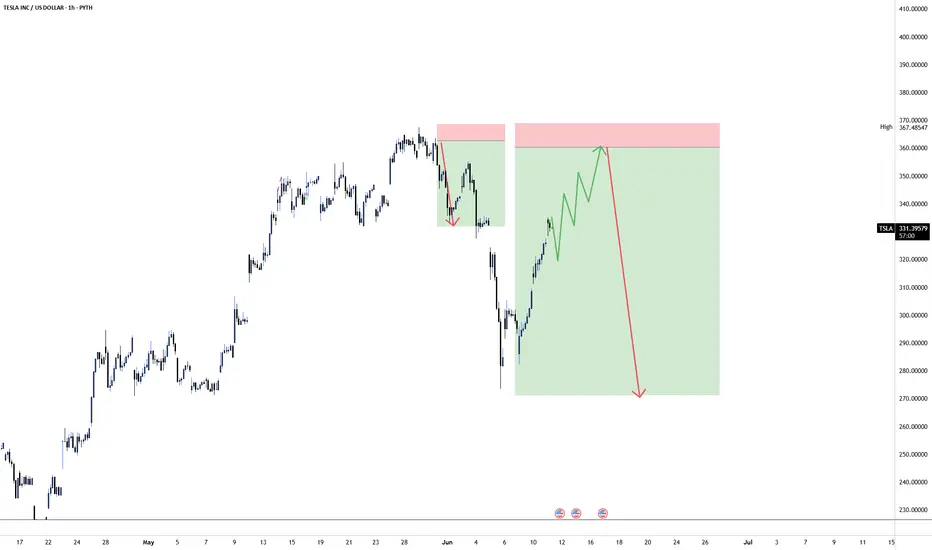
Key Technical Levels & Structure
1. 1‑Hour Chart — Uptrend and Resistance
TSLA has been in an ascending channel since April, with recent support around $274–280 on the 4‑h chart
On the 1‑hour, momentum is strong—macros like RSI, MACD, moving averages are all bullish (e.g., the 50‑hour MA is supporting around $330) .
2. Resistance Cluster ~ $357–360
That zone corresponds with prior swing highs and psychological resistance.
A push to $357.82 fits as a logical next target if TSLA maintains this bullish momentum.
3. Liquidity Grab Below
You anticipate a drop from that level to sweep stops and gather buy liquidity—common in breakout strategies.
Price could revisit intraday pivots—like the $330–335 zone or deeper around $320 on drop—which aligns with previous VWAP or double VWAP support regions noted in intraday setups .
1. 1‑Hour Chart — Uptrend and Resistance
TSLA has been in an ascending channel since April, with recent support around $274–280 on the 4‑h chart
On the 1‑hour, momentum is strong—macros like RSI, MACD, moving averages are all bullish (e.g., the 50‑hour MA is supporting around $330) .
2. Resistance Cluster ~ $357–360
That zone corresponds with prior swing highs and psychological resistance.
A push to $357.82 fits as a logical next target if TSLA maintains this bullish momentum.
3. Liquidity Grab Below
You anticipate a drop from that level to sweep stops and gather buy liquidity—common in breakout strategies.
Price could revisit intraday pivots—like the $330–335 zone or deeper around $320 on drop—which aligns with previous VWAP or double VWAP support regions noted in intraday setups .

"LIVE TRADE" Everyday on youtube.com/@Prosignalai
免責聲明
這些資訊和出版物並非旨在提供,也不構成TradingView提供或認可的任何形式的財務、投資、交易或其他類型的建議或推薦。請閱讀使用條款以了解更多資訊。
"LIVE TRADE" Everyday on youtube.com/@Prosignalai
免責聲明
這些資訊和出版物並非旨在提供,也不構成TradingView提供或認可的任何形式的財務、投資、交易或其他類型的建議或推薦。請閱讀使用條款以了解更多資訊。