
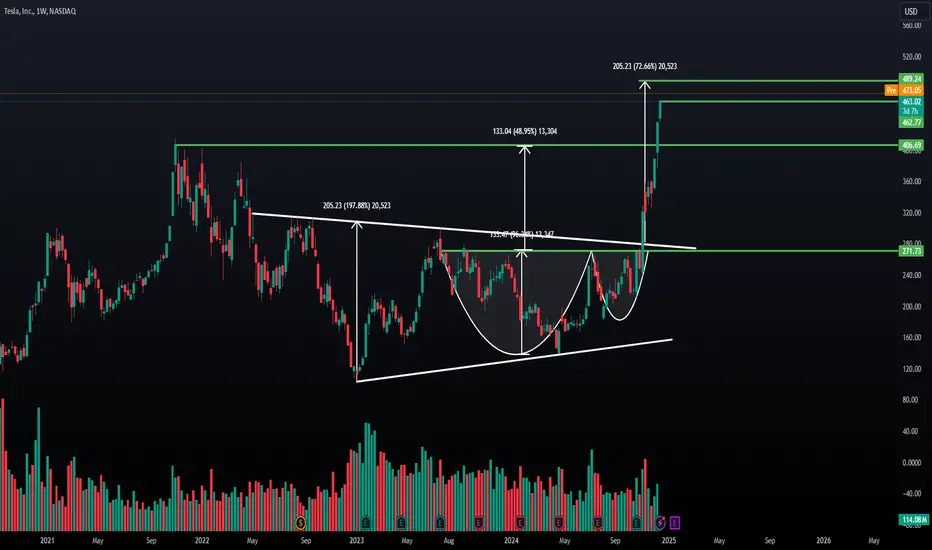
This chart shows Tesla's price on a weekly timeframe with key technical features:
1. **Cup and Handle Pattern**:
- A bullish reversal pattern formed over the past months, with two rounded bottoms resembling a "cup" shape and a minor consolidation area.
- The breakout above the resistance level confirms the pattern.
2. **Measured Move Targets**:
- **First Target**: $406.69, reached with a 48.95% move.
- **Second Target**: $489.24 for symmetrical triangle reflecting a 72.66% rise from the breakout.
3. **Key Resistance and Support Levels**:
- **Breakout Zone**: Around **$271.73**, the neckline of the cup and handle.
- **Intermediate Resistance**: Around **$406.69**.
- **Current Price**: Trading near **$463.02**.
4. **Volume**: Strong upward volume during the breakout phase, reinforcing the bullish breakout.
If the momentum continues, Tesla's price may target the next resistance near **$489.24**. Let me know if you need further insights!
1. **Cup and Handle Pattern**:
- A bullish reversal pattern formed over the past months, with two rounded bottoms resembling a "cup" shape and a minor consolidation area.
- The breakout above the resistance level confirms the pattern.
2. **Measured Move Targets**:
- **First Target**: $406.69, reached with a 48.95% move.
- **Second Target**: $489.24 for symmetrical triangle reflecting a 72.66% rise from the breakout.
3. **Key Resistance and Support Levels**:
- **Breakout Zone**: Around **$271.73**, the neckline of the cup and handle.
- **Intermediate Resistance**: Around **$406.69**.
- **Current Price**: Trading near **$463.02**.
4. **Volume**: Strong upward volume during the breakout phase, reinforcing the bullish breakout.
If the momentum continues, Tesla's price may target the next resistance near **$489.24**. Let me know if you need further insights!

免責聲明
這些資訊和出版物並非旨在提供,也不構成TradingView提供或認可的任何形式的財務、投資、交易或其他類型的建議或推薦。請閱讀使用條款以了解更多資訊。
免責聲明
這些資訊和出版物並非旨在提供,也不構成TradingView提供或認可的任何形式的財務、投資、交易或其他類型的建議或推薦。請閱讀使用條款以了解更多資訊。