
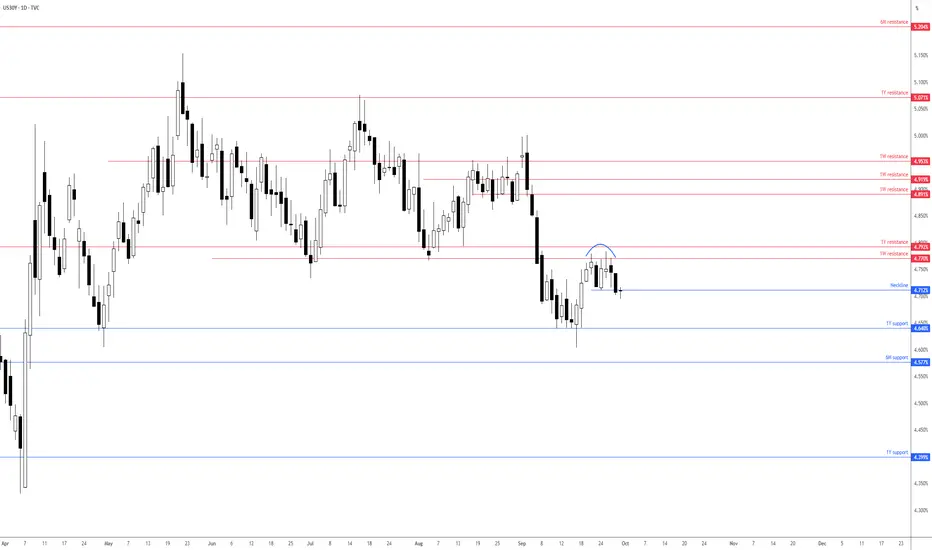
As can be seen from the chart below, price action continues to respect resistance between 4.792% (1Y) and 4.770% (1W), which has also seen flow move below the neckline of a double-top pattern at 4.712%.
With the close below a notable pattern neckline, additional underperformance towards 1Y support at 4.640% (which held on two occasions in April and September this year) might unfold. A leg below 4.640% also unearths another layer of nearby 6M support at 4.577%.
Written by the FP Markets Research Team

免責聲明
這些資訊和出版物並非旨在提供,也不構成TradingView提供或認可的任何形式的財務、投資、交易或其他類型的建議或推薦。請閱讀使用條款以了解更多資訊。
免責聲明
這些資訊和出版物並非旨在提供,也不構成TradingView提供或認可的任何形式的財務、投資、交易或其他類型的建議或推薦。請閱讀使用條款以了解更多資訊。