/CL: Bearish Deep Gartley and Bearish Shooting Star Confirmed/CL seems to be furthering it's RSI Bearish Divergence as the price-action prints a Hanging Man followed by a Bearish Shooting Star, confirming an .886 entry for a newly developed Bearish Deep Gartley. This can serve as a good secondary entry against Oil, Market Volatility, and the DXY which may likely lead to a bounce in SPX, BTC, ETH, and perhaps Silver as detailed here:
I will be careful with gold and silver and SPX as those aren't exactly fixed assets not even Gold and Silver. The producti
Bearish Gartley
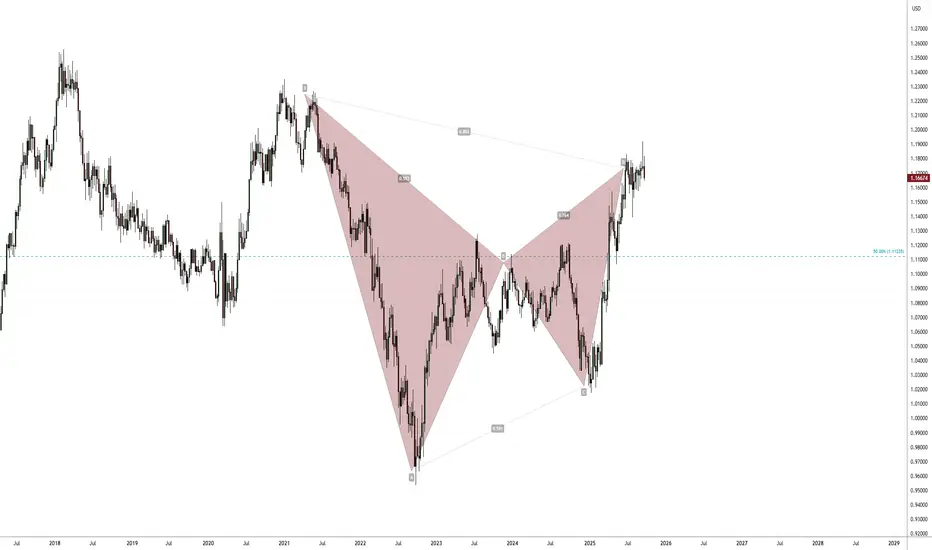
The Gartley at play? EUR/USD making a move...I have been building short positions since end of June/early July based on my original trade idea (which is still open)
....However, I noticed a potential harmonic pattern on the weekly about 3 weeks ago and this strengthened my conviction to keep and add additional shorts when we consolidated around the 1.1800+ price zone.
Although I am a chart pattern trader, I'm not a traditional harmonic trader but certain price action stands out to me and this looks like one playing out.
If this does qu
Two reasons to sell FTSE Right NOWWe are seeing some reasons to sell FTSE right now.
1) The daily trend is down.
2) H4 is pointing down, but the price is above the MA
3) There are two patterns to sell at the current level
4) 8165 is the last weeks high that will be a good resistance
Hoping for a test of last week's lows.
BTC Bearish GarleySummary of Confluences
Trade Setup Long Trade (Buy at C)
Key Confluences
✅ Fibonacci 0.618 - 0.633 Retracement (XA Leg)
✅ Weekly FVG Support
✅ Market Structure Pivot & Liquidity Grab
Short Trade (Sell at D)
✅ Bearish Gartley Completion (1.27 - 1.3 Fib Extension of BC)
✅ Anchored VWAP from ATH (Resistance)
✅ Bearish Order Block & Supply Zone
1. Long Trade Setup (From C to D – Bullish Move within the Gartley)
🔹 Trade Type: Counter-trend long (buy from C to D).
📌 Entry Criteria:
Buy
XRP - Bearish Gartley Pattern (Long & Short Positions)Confirmation:
Market Structure: The chart highlights a first weekly lower high and first weekly lower low, reinforcing a bearish trend.
Daily Fair Value Gap (FVG): Could serve as an additional target for the price.
Risk-to-Reward Ratio (RRR): The trade appears to have a favourable RRR, with an optimal entry around D.
1. Long Position (Counter-Trend Trade from C to D)
Trade Setup:
Entry: At point C, around the 0.882 Fibonacci retracement level.
Stop Loss: Below point A, ensuring protec
Shorting the S&P at 6000We previously picked the turning point of the S&P at the all time high.
We now expect this to continue with the downtrend as it approaches the strong 6000 resistance.
1) There is pattern
2) H4 and D1 are down
3) M15 is overbought, awaiting divergence
We target the low of 5915 which will give a 1:2.5 R:R
BEARISH PRESSURE ON BTC to 56,282.5 priceGood afternoon traders,
Trust you are doing great.
Please find below my outlook on this cryptocurrency, BTCUSD.
Type: Emerging Bullish Gartley
Completion Point (D):
Projected at approximately 56,282.5
Consider short positions as the pattern approaches this level.
Potential Reversal Zone (PRZ):
Range: 56,282.50 to 56,036.69
I expect to close short trades within this zone, anticipating a bullish reversal.
Target Levels:
These are my potential targets
T1: 57,487
T2: 56,935
T3: 56,282.50
These
TSLA four-hour chart shows a potential Gartley harmonic.NASDAQ:TSLA is forming a potential bearish Gartley on the four-hour chart, which would result in bullish price action on the C to D leg, as long as point C on the chart holds. Point C on the chart also corresponds to the daily 200 SMA, and is right above the psychological $200 level, which adds confluence to the long entry at $202.50.
AUDUSD M15, Intraday TradeI just shorted AUDCAD, Bearish 5-0 Pattern on the 1-hourly chart, and now AUDUSD on this Bearish Gartley Pattern.
It seems like the Australian dollar may have a bearish movement for the next couple of hours.
If you have been following, you should know I don't usually trade on the M15 chart, but this one has an upsize trade component.
What is an upsize trade?
An upsize trade is a trading setup that allows me to stretch my final target to the next pattern completion. It's a Trade Management ski
GBPUSD Sideways Consolidation and Potential Breakout MovesGBPUSD is currently in a sideways consolidation on the 1-hourly chart, presenting a potential for an expansion move or breakout in the coming week. Should the market break out to the upside, there are two potential shorting opportunities to consider.
Analysis:
- Sideways Consolidation: GBPUSD is in a range-bound phase on the 1-hourly chart.
- Potential Breakout: Watch for an expansion move.
Shorting Opportunities:
Traditional Resistance Level:
- Level: 1.2662
Strategy: Look for Magic Candle Co
Technical Analysis of GBPAUD: Bearish Gartley PatternHello traders,
Happy new week to you all.
Allow me to quickly do a detailed analysis of a pattern I identified on the GBPAUD currency pair, called bearish Gartley. I believe in the concerted might of Elliott wave and Harmonic patterns.
The Bearish Gartley pattern is a harmonic pattern that signals a potential reversal in price from bullish to bearish. This pattern consists of four price movements and five points: X, A, B, C, and D. In my GBPAUD analysis today, I noticed the following points:
Comprehensive Analysis of the Gartley Harmonic PatternThe Gartley Harmonic Pattern, a cornerstone of harmonic trading, was first introduced by H.M. Gartley in his 1935 book "Profits in the Stock Market." This pattern leverages Fibonacci retracement levels and geometric price formations to identify potential market reversals, providing traders with a strategic edge.
__________________________The Bullish Gartley Pattern___________________
Structure:
X-A Leg: The initial upward movement.
A-B Leg: A retracement of approximately 61.8% of the
A Han Seng Index Trade Early Monday morning Hello everyone,
The markets are slightly ruffled lately and there is an opportunity to short HS50 on Monday.
Trend:
W1: Up
D1: Down
H4: Down
Moving Average:
Below the Daily MA
H4 pointing downwards
Pattern:
Gartley on M15
Strong resistance at 16450.
Target is 16000
Double top on H1 and lots of divergence
Stop loss of 40 pips and a target of 120.
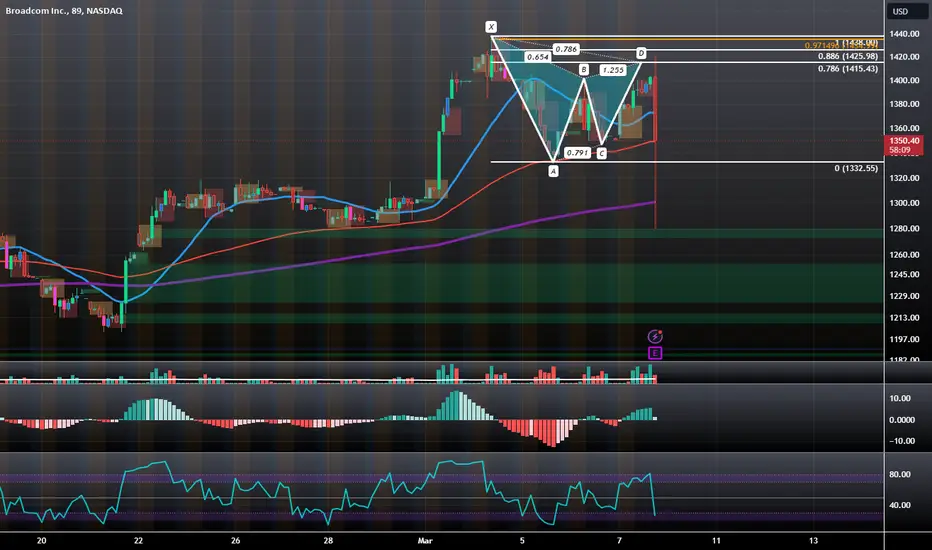
SOXL: Logscale Bearish Gartley at Trendline ResistanceSOXL has reached the Logscale 0.886 of this potential Logscale Bearish Deep Gartley which aligns with the upper trendline of the channel it has been trading within. If it plays out, I think we could see SOXL come down to the lower trendline and perhaps even lower. This May be sparked by a selloff in NVDA and AVGO.
Science of Trading ApproachToday, I'm excited to share a detailed approach for trading GBPUSD. If you're considering a short position, here's a comprehensive strategy:
1. 1-Hourly Chart: Shark Patterns at 1.2676
- Wait for Shark Patterns to complete at 1.2676 on the 1-hourly chart.
- Look for a trading combo within the chart when the market retests the Trendline Break (red line).
- Ensure the market doesn't violate the trendline during this process.
2. 4-Hourly Chart: Bearish Gartley Pattern at 1.2725
- The ideal
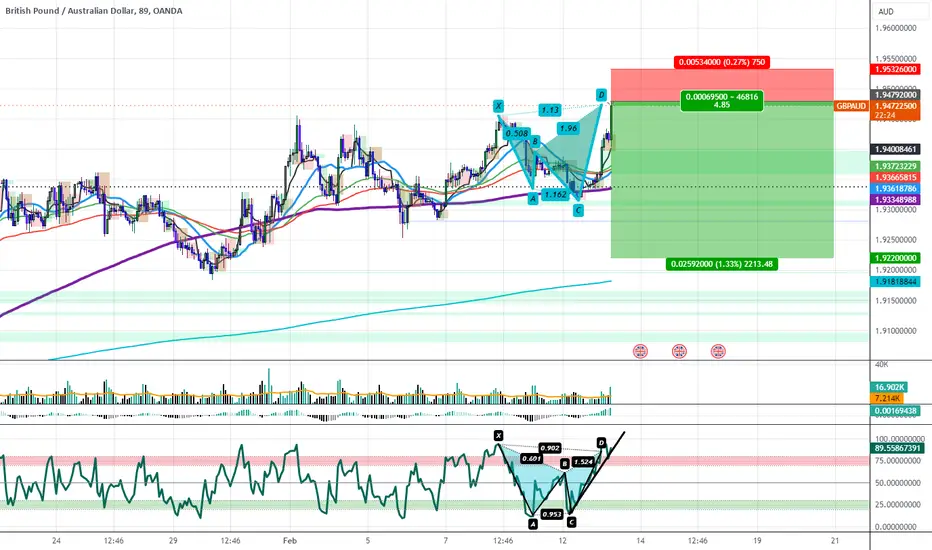
GBPAUD: Pushing into the PCZ of a Bearish SharkGBPAUD is pushing above the range resistance and into the PCZ of a Bearish Shark with elevated volumes, at the same time there is a Bearish Gartley formed on the RSI and the RSI is setting up to breakdown while in the overextended zone. I think we will likely see the AUD take back dominance for a few months in many of its pairs, particularly in the GBPAUD and AUDUSD pairs.
It is possible that the GBPAUD pushes above 1.95 for a short amount of time, I will likely continue shorting into 1.955
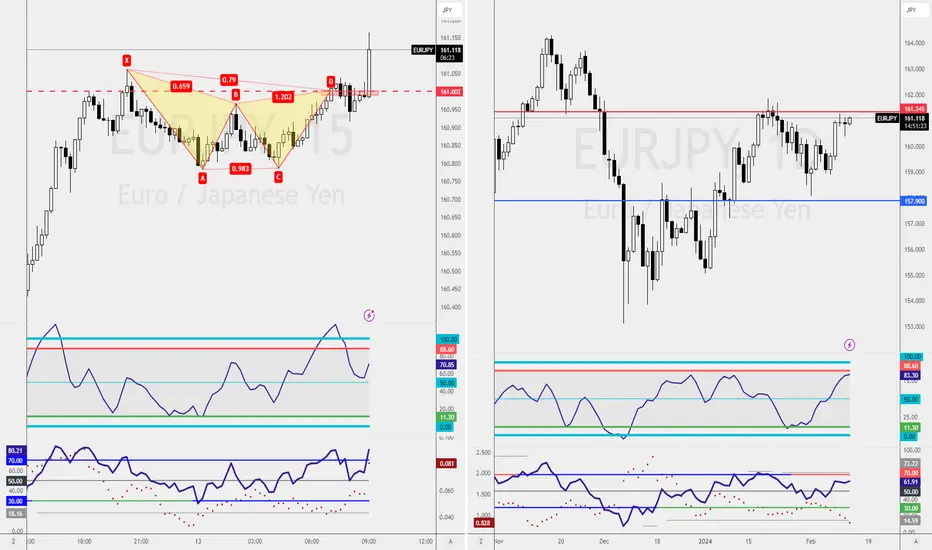
Type2 Bearish Gartley Pattern on 15 Minutes ChartAn intriguing trade opportunity has been identified on the 15-minute chart involving a type2 Bearish Gartley Pattern. While it may not appear significant on the shorter timeframe, looking at the Daily Chart provides a different perspective. Utilizing the Combo Trade Management System and targeting the first level of support can yield attractive returns.
What are your thoughts on this trade?
Combo Trade OpportunityAn amazing Bearish Fib-3 Bat with RSI Divergence has surfaced on the CADJPY 1-hourly chart.
While some may see this as a great counter-trend trading opportunity, others might interpret it as a warning sign and choose not to engage.
But here's the twist - it's a Combo Trade.
On the Weekly Chart, there's a Bearish Shark Pattern Retest, accompanied by a Type2 Bearish Gartley Pattern.
What's your take on CADJPY?
Share your trade plan for CADJPY in the comments below!