HUW insider buying adds weight to the setupStrong price move last weeks pulls this one even further out of this area of consolidation, in fact it was a a very minor area of contraction over the last couple of weeks. Worth zooming in and taking a closer look at those rising lows, a pattern I love seeing because it often results it prices breaking out.
Whilst the breakout volume here might seem small compared to the last 6 months, it is very slightly above the average, and I think the probability of this one continuing to its recent highs
Candlestick Analysis
USDJPY 4H: What Happens When Price Revisits Fresh DBD Supply?Market Context
On the 4-hour timeframe, USDJPY is currently trading near an identified Supply Zone .
This zone originated from a strong imbalance following a Drop-Base-Drop (DBD) structure, making the area technically relevant for studying how price behaves when it revisits a previous supply-origin region.
The zone is currently being observed as a fresh supply area , with a relatively strong leg-out and a structured basing formation.
Why This Zone Matters
A Drop-Base-Drop structure g
GBPUSD: This Zone Holds, or DXY Breaks ItGBPUSD — sitting right on a zone I've been tracking since the BOS
Quick one on cable. Daily structure shifted bullish back in August — LL, then a clean BOS through the prior LH, straight into a HH at 1.36758. Since then price has dumped hard off that high and run straight back down into the FVG left behind on the way up, which lines up almost exactly with the 4H weekly range low around 1.3270-1.3280. Currently sitting right inside it (~1.3368).
Zoomed into the 4H it's the same story, just clea
Possible MNQ ATH ReversionMNQ is at a Daily Supply zone originally created on 06/14/2026 with a range of 30864.25-30975.50 it has only been mitigated once on 06/22/26. Now that we have approached it we have two scenarios obviously, Red and the Blue path (explanations in screenshot)
As a Reversion trader I have a slight Bearish bias looking for a sweep of the Supply and then reversion to fill the inefficiencies below, especially testing the Order Block below (Red Box)
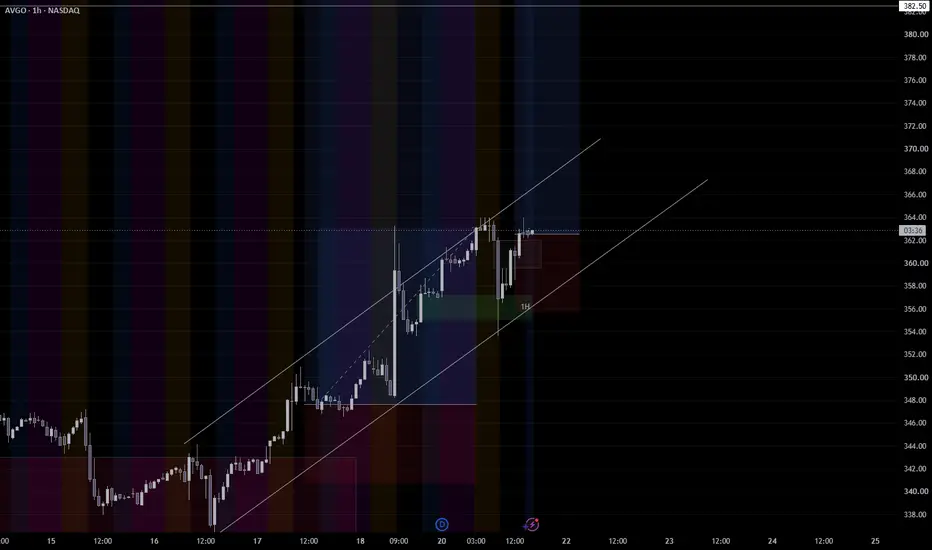
Why Are We Not Rallying Higher?I am already in calls, but an entry here wouldn't be bad either. We had a nice close back up after dropping at open.
What worries me about a long here is how we remained relatively flat the last 2 trading days, meanwhile other semiconductors and AI stocks surged higher...
Why?
S&P 500 makes island top today indicates more selling to come 5%Bearish case - Island top reversal made today suggests further selling unless the gap can be closed
Expect the price to move back to the 200EMA which is 5% away
If it does not stop there it could be a small trend change as it happened on NFP non farm payrolls day
Not advice only for educational purposes
UShort
Long trade
🔍 XAUUSD — POC / VALUE READ
Monday 21 September 2026
Direction: 🟢 Buy-side
Entry: 4343.697
Target: 4378.518 (+0.802%)
Stop: 4341.464 (-0.051%)
Planned RR: 15.59R
📊 Current Value Structure
From the chart:
Developing VAH: ~4356.12
Developing POC: ~4353.80
Developing VAL: ~4346.20
VWAP: ~4360.42
EMA: ~4359.90
Current price: ~4365.7
Entry: 4343.697
This is a strong auction progression because the entry was taken below developing value, price then reclaimed the VAL, traded through the POC, cleared
JUP August volume picking up thanks to the buybackJupiter Fund Management next, lots of choppy sideways action here and not a name I follow closely, but the chart’s telling an interesting story.
What caught my eye is the volume picking up through August, unusual for what’s normally a quiet month. Some of that’s explained by the company’s own buyback, running since April and still active, weekly purchases have been going through at prices up to 164.4p. That gives the stock a steady bid underneath it, worth knowing when you’re reading the volume
XAU/USD | Gold Drops To $4322, Another Bearish Move Ahead?By analyzing the #Gold chart on the 4H timeframe, we can see that after the previous analysis, price rallied toward $4397 but failed to maintain its momentum. With the new weekly session, selling pressure increased and Gold dropped as low as $4322 .
Currently, Gold is trading around $4351 . My outlook is relatively neutral, but I’m leaning toward another bearish move as long as buyers fail to reclaim the nearby resistance levels.
The nearest supply zones are around $4360 – $4380 , followe
ZK Major Support Holds What Comes Next?Interesting price action developing as ZK reacts from the $0.0070–$0.0085 support zone at the lower boundary of its descending channel. The immediate focus is the $0.025–$0.026 resistance area. A clean breakout and acceptance above this level could open the way toward the $0.065–$0.085 internal supply zone.
For now, the recovery is still developing within the broader descending structure. Support must hold while we watch for confirmation above the channel resistance.
Probability over prediction
BTC/USD | Bitcoin Explodes Higher! $85K Hit, Is $90K Next?By analyzing the #Bitcoin chart on the weekly timeframe, we can see that BTC followed our bullish scenario beautifully, hitting both our $82,500 and $85,000 targets and extending its rally all the way toward $86,300 !
In my view, bullish momentum remains strong, and I wouldn't be surprised to see Bitcoin challenge the psychological $90,000 level tonight , although a breakout still needs confirmation.
If you've been following these Bitcoin updates and found them useful, give this idea a Boo
USDCAD: Bearish Continuation 🇺🇸🇨🇦
USDCAD is positioned to retrace more on an hourly time frame,
following a valid bearish CHoCH and a double top pattern.
Goal - 1.3992
❤️Please, support my work with like, thank you!❤️
I am part of Trade Nation's Influencer program and receive a monthly fee for using their TradingView charts in my analysis.
Break 0.009 and this VeChain short is deadVeChain has run straight into major resistance at 0.009 and sellers are already stepping in to defend it.
🟠 Why This Level Matters:
Price tagged 0.009 after a strong volume push, but momentum is already fading and the first rejection is printing. This is the same zone that capped price earlier in the year, making it the clearest reversal point on the chart.
🟠 Gameplan / Primary Scenario:
Sell the rejection here with a tight stop just above 0.009224. The fading momentum favours a rollover,
Bitcoin: everything now runs into 89KBitcoin printed a strong break of structure, arriving earlier than the MSB we were tracking, and price is now extending toward the 89K region.
🟠 Why This Level Matters:
89K is the next major supply and the point where we expect sideways movement to develop. The BOS confirms upside momentum, but this is a volatile start to the week, and these opening moves often reverse the following day.
🟠 Gameplan / Primary Scenario:
Let price push into 89K before committing. Once it reaches that zone, wai
S&P 500: Bullish Reversal Needs ConfirmationThe S&P 500 has reacted from an important weekly support area, and the current weekly low is forming in a technically constructive location.
However, the bullish case still needs confirmation on the lower timeframes.
My preferred scenario is a short-term pullback that holds above the recent low, followed by another move higher. If price can build a higher low instead of breaking the recent bottom, that would provide stronger confirmation that the rebound is developing into a broader bullish mo
CRUDE OIL (WTI): Confirmed Liquidity Sweep?!
I see a potentially valid sell-side liquidity sweep on WTI Crude Oil after a test of a major horizontal key level.
A buying imbalance candle on an hourly time frame confirms that.
We can expect a pullback to 99.06 level.
❤️Please, support my work with like, thank you!❤️
GBPCHF: Bullish After Trap 🇬🇧🇨🇭
GBPCHF will likely pull back after a confirmed bearish trap below a strong
intraday horizontal support cluster.
The goal is 1.1033 level
❤️Please, support my work with like, thank you!❤️
I am part of Trade Nation's Influencer program and receive a monthly fee for using their TradingView charts in my analysis.
GBPUSD: Key Support in Focus Ahead of September 25The area around 1.3365–1.3315 is now the main zone I’m watching. If buyers begin to defend this region, GBPUSD could start building a more meaningful low.
A key date on my chart is September 25. This does not mean a reversal must happen on that date, but the combination of timing and support makes this period particularly important.
On the daily chart, the recovery is still not confirmed.
As long as price remains below 1.3484, another move lower into the marked support area is still possible.
**XAUUSD Daily Outlook — Weekly Bottom May Not Be In Yet**Gold is currently recovering from the recent support area, but I still do not see enough evidence to confirm that the broader weekly correction is complete.
My higher-timeframe view remains cautious.
The current rise can still be part of a **corrective rebound**, and another bearish move may develop before gold forms a stronger weekly bottom.
On the daily chart, price is now trading around an important decision area.
### Key Resistance
**4,473** is the first major level I am watching.
Ab
TPFG strong update and heavy volume at a key level.Big fan of this one on fundamentals, Property Franchise Group has grown its market share substantially over the past few years. I held for a while but took some money off the table around a year ago to fund other opportunities.
The recent trading update backs up the story. Revenue and profit both up 7%, with franchising and financial services doing the heavy lifting, licensing holding roughly flat. Solid numbers in a housing market that’s hardly been firing on all cylinders.
Worth noting the w